USE OF BRAIN DIFFUSION TENSOR IMAGING FOR THE PREDICTION OF
LONG-TERM NEUROLOGICAL OUTCOMES IN PATIENTS AFTER CARDIAC
ARREST: A MULTICENTRE, INTERNATIONAL, PROSPECTIVE,
OBSERVATIONAL, COHORT STUDY
Lionel Velly (7), Vincent Perlbarg (1, 3), Thomas Boulier (1), Nicolas Adam (9), Sebastien Delphine (1), Charles-Edouard Luyt (2), Valentine Battisti (2), Gregory Torkomian (2), Charlotte Arbelot (2), Russell Chabanne (5), Betty Jean (5), Carol Di Perri (9), Steven Laureys (9), Giuseppe Citerio (10-11), Alessia Vargiolu (10-11), Benjamin Rohaut (2), Nicolas Bruder (6), Nadine Girard (6), Stein Silva (8), Vincent Cottenceau (4), Thomas Tourdias (4), Olivier Coulon (7), Bruno Riou (2), Lionel Naccache (3), Rajiv Gupta (12), Habib Benali (1), Damien Galanaud (2), Louis Puybasset (1, 2), for the MRI-COMA Investigators
(1)CNRS, INSERM, Laboratoire d’Imagerie Biomédicale, (2)AP-HP, Hôpital Pitié-Salpêtrière and Institut du Cerveau et de la Moelle Epinière, AP-HP, (3)Hôpital Pitié-Salpêtrière, Sorbonne Université, Paris, France; (4)Hôpital Universitaire Pellegrin, Bordeaux, France; (5)Centre Hospitalier Universitaire de Clermont-Ferrand, Clermont Ferrand, France; (6)Assistance Publique–Hôpitaux de Marseille, Hôpital Timone Adultes, Marseille, France; (7)Institut de Neurosciences, MeCA (UMR 7289, CNRS), Aix Marseille Université, Marseille, France; (8)Neuro-Campus Baudot, Toulouse, France; (9)GIGA, GIGAConsciousness, Coma Science Group, University of Liège, Liège, Belgium ; (10) Milan Bicocca University, Milan, Italy ; ( 1 1 ) Hospital San Gerardo, Monza, Italy ; and ( 1 2 ) Massachusetts General Hospital, Harvard Medical School, Boston, MA, USA
ABSTRACT
Background : Prediction of neurological outcome after cardiac arrest is a major challenge. The aim of this study was to assess whether quantitative whole-brain white matter fractional anisotropy (WWM-FA) measured by diffusion tensor imaging between day 7 and day 28 after cardiac arrest can predict long-term neurological outcome.
Methods : This prospective, observational, cohort study (part of the MRI-COMA study) was done in 14 centres in France, Italy, and Belgium. We enrolled patients aged 18 years or older who had been unconscious for at least 7 days after cardiac arrest into the derivation cohort. The following year, we recruited the validation cohort on the same basis. We also recruited a minimum of five healthy volunteers at each centre for the normalisation procedure. WWM-FA values were compared with standard criteria for unfavourable outcome, conventional MRI sequences (fluid-attenuated inversion recovery and diffusion-weighted imaging), and proton magnetic resonance spectroscopy. The primary outcome was the best achieved Glasgow-Pittsburgh Cerebral
Performance Categories (CPC) at 6 months, dichotomised as favourable (CPC 1–2) and unfavourable outcome (CPC 3–5). Prognostication performance was assessed by the area under the receiver operating characteristic (ROC) curves and compared between groups. This study was registered with ClinicalTrials.gov, number NCT00577954.
Findings : Between Oct 1, 2006, and June 30, 2014, 185 patients were enrolled in the derivation cohort, of whom 150 had an interpretable multimodal MRI and were included in the analysis. 33 (22%) patients had a favourable neurological outcome at 6 months. Prognostic accuracy, as quantified by the area under the ROC curve, was significantly higher with the normalised WWM-FA value (area under the ROC curve 0·95, 95% CI 0·91–0·98) than with the standard criteria for unfavourable outcome or other MRI sequences. In a subsequent validation cohort of 50 patients (enrolled between April 1, 2015, and March 31, 2016), a normalised WWM-FA value lower than 0·91, set from the derivation cohort, had a negative predictive value of 71·4% (95% CI 41·9–91·6) and a positive predictive value of 100% (90·0–100), with 89·7% sensitivity (75·8–97·1) and 100% specificity (69·1–100) for the prediction of unfavourable outcome.
Interpretation : In patients who are unconscious 7 days after cardiac arrest, the normalised WWM-FA value, measured by diffusion tensor imaging, could be used to accurately predict neurological outcome at 6 months. This evidence requires confirmation from future large-scale trials with a strict protocol of withdrawal or limitation-of-care decisions and time window for MRI.
Funding : French Ministry of Health, French National Agency for Research, Italian Ministry of Health, and Regione Lombardia.
Introduction
Prognostication of comatose-resuscitated patients following cardiac arrest is challenging, particularly during the first week when lingering effects of sedatives and neuromuscular blocking agents,1 hypothermia,2 and unstable physiological status preclude detailed neurological examinations.3 Standard early predictors of unfavourable outcome after cardiac arrest include absence of brain-stem reflexes, absence of motor response other than extensor response, status myoclonus, high serum concentrations of neuron-specific enolase, and absence of cortical responses by somatosensory evoked potentials.4 All have substantial limitations in terms of reliability.2 The publication of the Parisian Region Out of Hospital Cardiac Arrest (PROCAT) registry5 and the Save Hearts in Arizona Registry and Education (SHARE)6 have raised some concerns about the existence of late awakeners and the consecutive risk of inappropriate early prognostication. The latest published guidelines on cardiac arrest recommend delaying prognostication after therapeutic hypothermia, and basing it on multiple prognostic tools.7,8 Physicians are, therefore, confronted with a difficult decision- making process, mainly in patients who do not recover consciousness by day 7.9 Diffusion MRI is emerging as a promising prognostic tool.10 One such measure is diffusion-weighted imaging (DWI) with the whole-brain apparent diffusion coefficient, but the ideal time window for this technique is short (between days 3 and 5 after cardiac arrest)11,12 and it has a low sensitivity (25–30%) for unfavourable prognosis, despite high specificity (95– 100%).11–13 An extension of DWI, diffusion tensor imaging (DTI), especially the calculation of fractional anisotropy (FA), allows in-vivo quantification of white matter injuries that occur in an acute, subacute, or delayed manner after global anoxia.14,15 Another technique, proton magnetic resonance spectroscopy (1H-MRS), allows the in-vivo quantification of the concentrations of brain metabolites characterising cellular dysfunction and neuronal loss. However, little evidence exists as to how these techniques might contribute to an improved prognostication for outcome after cardiac arrest.16 The goal of this study was to assess and validate the prognostic performance of whole-brain white matter FA (WWM-FA) in comatose patients 7 days after cardiac arrest, as compared with clinical symptoms, morpho- logical MRI, and 1H-MRS. Optimum cutoff was defined from a derivation cohort and assessed in an independent validation cohort.
RESEARCH IN CONTEXT
EVIDENCE BEFORE THIS STUDY
We searched MEDLINE for reports on the use of diffusion measures on MRI in cardiac arrest published in English between database inception and Nov 24, 2017, with the following search terms for the patient category of cardiac arrest: “heart arrest”, “cardiac arrest”, “cardiopulmonary resuscitation”, “ischemichypoxic encephalopathy”, “hypoxia-ischemia”, or “post anoxic coma’; the following search terms for the diffusion category: “magnetic resonance”, “MRI”, “MR”, “neuroimaging”, “apparent diffusion coefficient”, “diffusion-weighted imaging”, or “diffusion tensor imaging”; and the following search terms for outcome: “prediction”, “predictors”,
“prognosis”, “prediction model”, or “outcome”. The search yielded 21 observational cohorts, of which 17 reported outcomes. Eight studies predominantly examined apparent diffusion coefficient (ADC), seven diffusion-weighted imaging (DWI), and two diffusion tensor imaging (DTI). Except one, all the studies were based on MRI acquired during the fi week after cardiac arrest. Diffuse DWI abnormalities were highly specific but only modestly sensitive of poor outcome. Being a qualitative technique, DWI is prone to interobserver variability, but it can be standardised using semiquantitative methods such as ADC. Patients with poor outcomes exhibited a nadir in ADC values at 3–5 days after cardiac arrest, which therefore seemed to be the optimum time window for prognostication using ADC. Thresholds have been determined either regionally or globally. One study reported prognostic thresholds for percentage of brain volume below specifi values of ADC. However, this study was done in a small cohort (51 patients) and was monocentric. Indeed, all published multicentre studies on ADC had to use semiquantitative analysis because ADC metrics highly depend on diffusion acquisition parameters. Two particular bicentric studies reported the use of DTI derived parameters. Outcome was not the primary endpoint in the one including 97 patients in which data were not normalised. The second one, from our group, proposed a predictive composite score derived on 57 patients that was not externally validated and did not show direct clinical transferability.
ADDED VALUE OF THIS STUDY
To our knowledge, this is the largest, prospectively followed up cohort of patients who were still comatose 7 days after cardiac arrest reporting the predictive value of fractional anisotropy, derived from DTI. Our findings provide evidence that normalised whole-brain white matter fractional anisotropy can be useful for the prediction of poor outcome. This study also resolved two methodological issues: the requirement of measurement calibration in each centre by acquiring healthy controls to establish measurements of reference; and the great need for extensive quality checks of MRI acquisitions that led to 25 (14%) of 185 patients being excluded from our derivation cohort.
IMPLICATIONS OF ALL THE AVAILABLE EVIDENCE
Our results are relevant in the clinical setting because they might provide reliable outcome predictors and could possibly improve diagnosis of late awakeners in survivors after cardiac arrest who were still unresponsive to simple orders after 7 days. The findings of our study support the use of quantitative MRI (DTI) for proxy information and management of care withdrawal decisions in this selected population of patients with cardiac arrest.
Methods
This study is a multicentre, international, prospective, observational, cohort study and part of a larger trial named MRI-COMA (assessing outcome with multimodal MRI of comatose patients of various origin). We obtained institutional review board or ethics committee approval for each country. In the derivation cohort, we enrolled patients from 14 intensive care units in France, Belgium, and Italy (appendix). Patients were eligible for inclusion if they were aged 18 years or older at the time of cardiac arrest with persisting unconsciousness at day 7, defi as the inability to obey verbal commands not attributed to sedation or aphasia. The main exclusion criteria were contraindication to MRI; haemodynamic instability or respiratory failure precluding transport and scanning; and previous CNS disease (appendix). We obtained written informed consent from patients’ appointed proxies before MRI. The following year, we recruited the validation cohort on the same basis. We also recruited by announcement within the hospital a minimum of fi healthy volunteers at each centre for the normalisation procedure. We obtained written informed consent from the healthy volunteers directly.
PROCEDURES
Participating centres collected demographic and clinical information prospectively with an Utstein-style17 data form. The Glasgow Coma Scale (appendix) was assessed at hospital admission, day of inclusion (day 7), and day of MRI acquisition. The out-of-hospital cardiac arrest score18 was computed for each patient (appendix). An electroencephalogram (EEG) was recorded within 72 h after return of spontaneous circulation using a 21-channel digital recorder according to the International 10–20 system. Experienced neurophysiologists, who were masked to any other clinical information, categorised at least 30 min of EEG data, according to the five Synek grades (appendix).19,20 MRI acquisitions (appendix) were done between day 7 and day 28 after cardiac arrest on 15 scanners from three manufacturers: GE Medical Systems (Milwaukee, WI, USA), Siemens Medical Solutions (Erlangen, Germany), and Philips Medical Systems (Eindhoven, Netherlands). DTI, 1H-MRS, and several conventional MRI sequences, including fluid-attenuated inversion recovery (FLAIR) and DWI, were acquired (for the precise parameters of each sequence from each centre see appendix). Healthy volunteers and patients underwent the same imaging protocol. Anonymised magnetic resonance source images were transferred to the coordinating centre for independent interpretation and reviewed by a board-certified neuroradiologist masked to demographic, socioeconomic, and clinical data. The FLAIR and DWI images were qualitatively scored21 (appendix). All quantitative processes used for MRI data analysis, including the normalisation procedure for DTI values and WWM-FA and whole-brain FA calculation (appendix), are described in the appendix. Importantly, the raw value of each derived diffusion measure was divided by the mean of this measure across healthy controls, acquired in the same scanner with the same sequence. Results are thus expressed as a percentage of controls. Because FA can be normal or increased during cytotoxic oedema,22 patients were also assessed for whole-brain mean average diffusion coefficient (WB-aDC). A low WB-aDC (<0·91) was determined in the control population as the mean value minus three standard deviations.
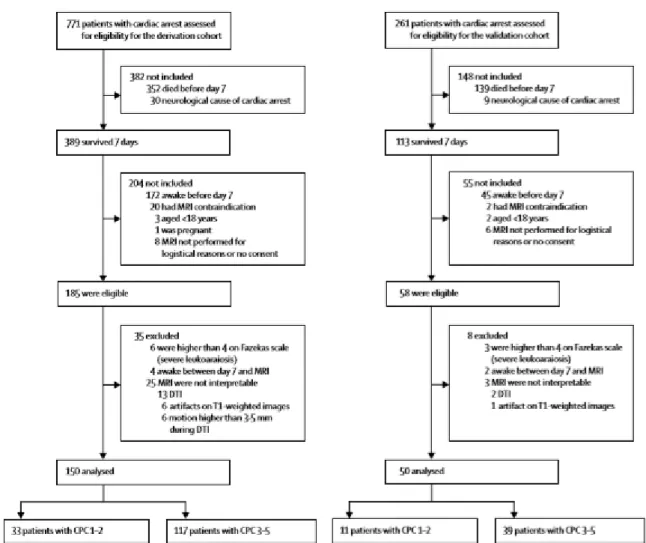
Figure 1 : Trial profile
DTI=diffusion tensor imaging. CPC=Glasgow-Pittsburgh Cerebral Performance Categories.
OUTCOME
Physicians in charge of the patients were blinded to 1H-MRS, WWM-FA, and WB-aDC, but had access to conventional MRI sequences (without FLAIR-DWI scoring), and to all clinical, biological, and electrophysiological data. All clinical decisions remained at the discretion of the treating team. Neurological performance was assessed at hospital discharge and at 6 months according to Glasgow-Pittsburgh Cerebral Performance Categories (CPC;23 appendix) and the modified Rankin scale24,25 (appendix). Best achieved CPC was the primary outcome measure for stratifying patients into favourable (CPC 1–2) or unfavourable outcome (CPC 3–5). For incapacitated patients, a personal consultee completed questionnaires on their behalf.
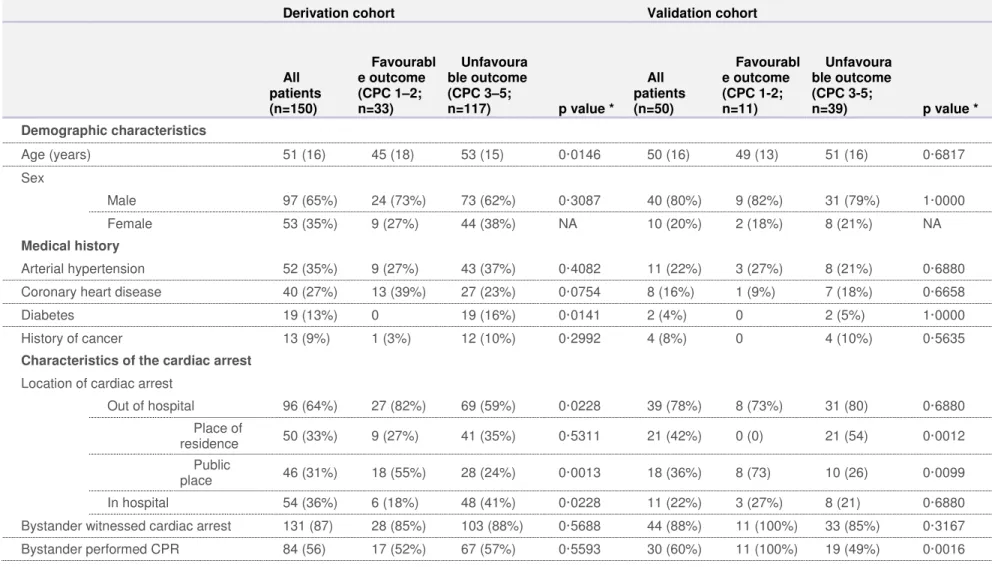
Table 1: Baseline characteristics
Derivation cohort Validation cohort
All patients (n=150) Favourabl e outcome (CPC 1–2; n=33) Unfavoura ble outcome (CPC 3–5; n=117) p value * All patients (n=50) Favourabl e outcome (CPC 1-2; n=11) Unfavoura ble outcome (CPC 3-5; n=39) p value * Demographic characteristics Age (years) 51 (16) 45 (18) 53 (15) 0·0146 50 (16) 49 (13) 51 (16) 0·6817 Sex Male 97 (65%) 24 (73%) 73 (62%) 0·3087 40 (80%) 9 (82%) 31 (79%) 1·0000 Female 53 (35%) 9 (27%) 44 (38%) NA 10 (20%) 2 (18%) 8 (21%) NA Medical history Arterial hypertension 52 (35%) 9 (27%) 43 (37%) 0·4082 11 (22%) 3 (27%) 8 (21%) 0·6880 Coronary heart disease 40 (27%) 13 (39%) 27 (23%) 0·0754 8 (16%) 1 (9%) 7 (18%) 0·6658
Diabetes 19 (13%) 0 19 (16%) 0·0141 2 (4%) 0 2 (5%) 1·0000
History of cancer 13 (9%) 1 (3%) 12 (10%) 0·2992 4 (8%) 0 4 (10%) 0·5635
Characteristics of the cardiac arrest
Location of cardiac arrest
Out of hospital 96 (64%) 27 (82%) 69 (59%) 0·0228 39 (78%) 8 (73%) 31 (80) 0·6880 Place of residence 50 (33%) 9 (27%) 41 (35%) 0·5311 21 (42%) 0 (0) 21 (54) 0·0012 Public place 46 (31%) 18 (55%) 28 (24%) 0·0013 18 (36%) 8 (73) 10 (26) 0·0099 In hospital 54 (36%) 6 (18%) 48 (41%) 0·0228 11 (22%) 3 (27%) 8 (21) 0·6880 Bystander witnessed cardiac arrest 131 (87) 28 (85%) 103 (88%) 0·5688 44 (88%) 11 (100%) 33 (85%) 0·3167 Bystander performed CPR 84 (56) 17 (52%) 67 (57%) 0·5593 30 (60%) 11 (100%) 19 (49%) 0·0016
Epinephrine 92 (61) 20 (61%) 72 (62%) 1·0000 38 (76%) 8 (73%) 30 (77%) 1·0000 Total dose of epinephrine during CPR
(mg) 3 (0–6) 3 (0–6) 3 (0–6) 0·8811 3 (1–6) 2 (1–3) 5 (2–6) 0·1600
First monitored rhythm
Shockable rhythm Total 56 (37%) 25 (76%) 31 (26%) <0·0001 22 (44%) 8 (73%) 14 (36%) 0·0419 Ventricular fibrillation 51 (34%) 25 (76%) 26 (22%) <0·0001 19 (38%) 7 (64%) 12 (31%) 0·0776 Non-perfusing ventricular tachycardia 5 (3%) 0 5 (4%) 0·5865 3 (6%) 1 (9%) 2 (5%) 0·5337 Asystole 65 (43%) 3 (9%) 62 (53%) <0·0001 18 (36%) 2 (18%) 16 (41) 0·2866 Pulseless electrical activity 22 (15%) 3 (9%) 19 (16%) 0·4093 5 (10%) 0 5 (13%) 0·5742 Unknown first rhythm 7 (5%) 2 (6%) 5 (4%) 0·6491 5 (10%) 1 (9%) 4 (10%) 1·0000 Time from cardiac arrest to event (min) †
Start of basic life support 2 (1–6) 1 (1–6) 2 (1–6) 0·2904 2 (1–5) 1 (1–2) 3 (1–8) 0·0660 Start of advanced life
support 20 (10– 30) 25 (9–40) 20 (10–30) 0·3317 20 (10– 30) 20 (15–26) 17 (10–30) 0·4327 Return of spontaneous circulation 25 (15– 35) 30 (15–40) 23 (15–33) 0·1925 23 (15– 31) 21 (17–26) 23 (14–31) 0·9533
Clinical characteristics on ICU admission
Glasgow Coma Scale score ‡ 3 (3–3) 3 (3–3) 3 (3–3) 0·2604 3 (3–5) 3 (3–5) 3 (3–5) 0·6563 Pupillary reflex absent 27 (18%) 6 (18%) 21 (18%) 1·0000 12 (24%) 2 (18%) 10 (26%) 1·0000 Corneal reflex absent 27 (18%) 3 (9%) 24 (21%) 0·1984 6 (12%) 0 6 (15%) 0·3168
Serum pH 7·23 (0·18) 7·24 (0·16) 7·23 (0·18) 0·9600 7·25 (0·12) 7·27 (0·15) 7·24 (0·11) 0·3768
Serum lactate (mmol/L) 6·4 (7·3) 6·4 (5·3) 6·3 (7·8) 0·9961 5·1 (3·0) 4·6 (2·3) 5·3 (3·2) 0·5457 Serum creatinine (μmol/L) 127 (114) 117 (74) 129 (122) 0·4965 102 (33) 110 (19) 99 (36) 0·3341 Circulatory shock § 81 (54%) 18 (55%) 63 (54%) 1·0000 34 (68%) 7 (64%) 27 (69%) 0·7278 Myocardial infarction 43 (29%) 17 (52%) 26 (22%) 0·0019 13 (26%) 4 (36%) 9 (23%) 0·4446
Therapeutic procedures during hospital treatment
Hypothermia 110 (73%) 23 (70%) 87 (74%) 0·6570 43 (86%) 11 (100%) 32 (82%) 0·3237 Lowest body
temperature in the first 24 h 35·4 (1·7) 35·6 (1·8) 35·3 (1·7) 0·4909 34·8 (1·0) 34·8 (1·1) 34·8 (0·9) 0·9222 Extracorporeal life support 22 (15%) 8 (24%) 14 (12%) 0·0956 9 (18%) 3 (27%) 6 (15%) 0·3922 Continuous renal replacement therapy
or intermittent dialysis 56 (37%) 15 (45%) 41 (35%) 0·3111 16 (32%) 4 (36%) 12 (31%) 0·7278
Data are mean (SD), n (%), or median (IQR).
CPC=Glasgow-Pittsburgh Cerebral Performance Categories. NA=not applicable.
CPR=cardiopulmonary resuscitation.
ICU=intensive care unit. *p value for patients with a best numerical CPC 1–2 (favourable outcome) versus those with categories 3–5 (unfavourable outcome). †For unwitnessed cardiac arrests, intervals were calculated from the time of the emergency call.
‡Scores on the Glasgow Coma Scale range from 3 to 15, with lower scores indicating reduced levels of consciousness. §Circulatory shock was defined as a systolic blood pressure of less than 90 mm Hg for more than 30 min.
STATISTICAL ANALYSIS
Assuming a specificity of 100% and a sensitivity of 75% of normalised WWM-FA as a reliable marker to predict unfavourable outcome, an 85% prevalence of unfavourable outcome, and an anticipated 20% loss to follow-up or technical issues,16 we estimated a sample size of 185 patients26 to obtain an adequate sensitivity with a 7·5% width of a 2-sided 95% CI. For the sample size calculation of the validation cohort, we considered the null hypothesis to be an area under the curve (AUC) of 0·5, and assumed the same prevalence of unfavourable outcome between the derivation and the validation cohorts. We calculated the necessary sample size of 49 patients to achieve at least 95% statistical power at a type I error probability of 0·1% to detect an AUC of 0·9.27 Baseline characteristics were stratified according to the primary outcome based on CPC scores. Means and SDs were used for normal distributions of continuous variables, and medians and IQRs for non-continuous variables. For categorical variables, numbers and percentages were used. We used an unpaired two-sample t test (normally distributed) or a Wilcoxon-Mann-Whitney U test (no assumption for distribution) to assess differences between continuous variables. We compared continuous variables between the two groups with a Fisher’s exact test. We examined the predictive value of each variable with univariate logistic regression models. For each predictive variable (p<0·05), we plotted a receiver operating characteristic curve, and computed the corresponding area under the receiver operating characteristic (ROC) curve using the pROC package28 for R software (version 3.3.3; the R Foundation for Statistical Computing). We defined an optimum cutoff as the value leading to the maximum sensitivity at 100% specificity. For this optimum cutoff we computed specificity, sensitivity, and positive and negative predictive values, computing 95% CI by bootstrap. We compared the area under the ROC curve of each variable with those of the normalised WWM-FA using the method described by DeLong and colleagues,29 and compared the sensitivity of each variable with those of the normalised WWM-FA using Fisher’s exact test. We also computed all these statistics for three multivariate logistic-regression models. For the validation phase of the study, the cutoff points of normalised WWM-FA and whole-brain FA were not derived. We regarded values above the cutoff point as indicative of a favourable outcome (CPC 1–2) and values below the cutoff point as indicative of an unfavourable outcome (CPC 3–5). We assessed predictive performance in the validation cohort by estimating negative and positive predictive values, sensitivity, specificity, and the area under the ROC curve, with corresponding 95% CI. Additional details of the statistical analyses, odds ratios, and logistic-regression models are available in the appendix. This study was registered with ClinicalTrials.gov, number NCT00577954. Raw data are available in the Mendeley Data secure online repository for research data (DOI:10.17632/kdj8yxp37j.1).
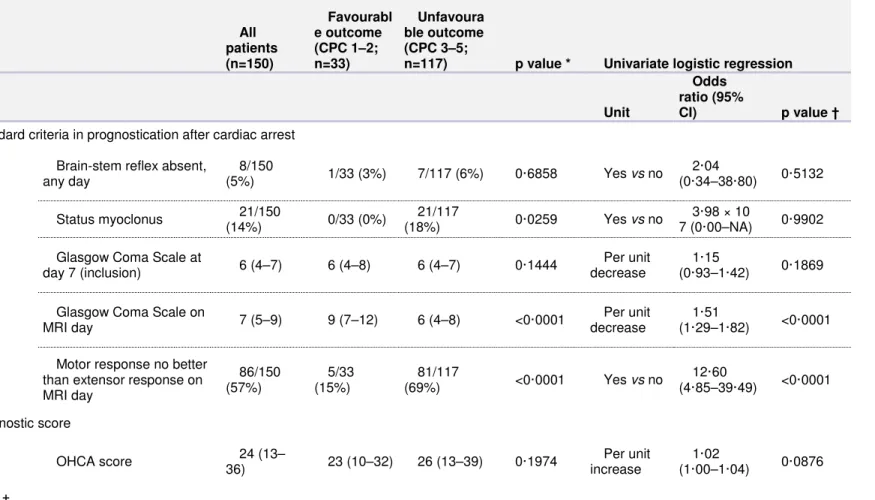
Table 2: Distribution of prognostic variables after cardiac arrest in the derivation cohort All patients (n=150) Favourabl e outcome (CPC 1–2; n=33) Unfavoura ble outcome (CPC 3–5;
n=117) p value * Univariate logistic regression
Unit
Odds ratio (95%
CI) p value †
Standard criteria in prognostication after cardiac arrest Brain-stem reflex absent,
any day 8/150 (5%) 1/33 (3%) 7/117 (6%) 0·6858 Yes vs no 2·04 (0·34–38·80) 0·5132 Status myoclonus 21/150 (14%) 0/33 (0%) 21/117 (18%) 0·0259 Yes vs no 3·98 × 10 7 (0·00–NA) 0·9902
Glasgow Coma Scale at
day 7 (inclusion) 6 (4–7) 6 (4–8) 6 (4–7) 0·1444
Per unit decrease
1·15
(0·93–1·42) 0·1869
Glasgow Coma Scale on
MRI day 7 (5–9) 9 (7–12) 6 (4–8) <0·0001
Per unit decrease
1·51
(1·29–1·82) <0·0001
Motor response no better than extensor response on MRI day 86/150 (57%) 5/33 (15%) 81/117 (69%) <0·0001 Yes vs no 12·60 (4·85–39·49) <0·0001 Prognostic score OHCA score 24 (13– 36) 23 (10–32) 26 (13–39) 0·1974 Per unit increase 1·02 (1·00–1·04) 0·0876 EEG ‡
Synek classification 3 (3–4) 3 (2–3) 3 (3–4) 0·0045 Per unit increase 3·80 (2·01–7·95) 0·0001 Favourable (grade 1–2) 21/136 (15%) 10/27 (37%) 11/109 (10%) NA NA NA NA Uncertain (grade 3) 78/136 (57%) 15/27 (56%) 63/109 (58%) NA NA NA NA Unfavourabl e (grade 4–5) 36/136 (26%) 1/27 (4%) 35/109 (32%) NA NA NA NA
EEG reactivity absent 95/136
(70%) 12/27 (44%) 83/109 (76%) 0·0022 Yes vs no 3·99 (1·67–9·78) 0·0020 Crisis 31/136 (23%) 5/27 (19%) 26/109 (24%) 0·7969 Yes vs no 1·31 (0·48–4·22) 0·6209
Qualitative MRI variables ..
FLAIR and DWI MRI interpretation Hyperintens ity in deep grey nuclei 98/148 (66%) 8/33 (24%) 90/115 (78%) <0·0001 Yes vs no 11·25 (4·70–29·57) <0·0001 Hyperintens ity in cortical areas 66/148 (45%) 6/33 (18%) 60/115 (52%) 0·0006 Yes vs no 4·91 (2·00–13·96) 0·0011
FLAIR-DWI scoring system
Overall score 35 (26) 15 (10) 40 (27) <0·0001 Per unit
increase
1·10
(1·06–1·15) <0·0001
Cortex score 21 (17) 11 (7) 24 (18) <0·0001 Per unit
increase
1·10
Cortex plus deep grey nuclei score 32 (23) 14 (10) 37 (23) <0·0001 Per unit increase 1·09 (1·05–1·14) <0·0001
Quantitative MRI variables
Quantitative diffusion tensor imaging Whole-brain white matter FA 0·82 (0·14) 0·96 (0·03) 0·78 (0·13) <0·0001 Per 0·01 unit decrease 1·42 (1·26–1·67) <0·0001 Whole-brain FA 0·86 (0·12) 0·99 (0·05) 0·82 (0·11) <0·0001 Per 0·01 unit decrease 1·28 (1·18–1·42) <0·0001 Grey matter aDC 1·06 (0·20) 1·11 (0·07) 1·05 (0·22) 0·0075 Per 0·01 unit decrease 1·02 (1·00–1·04) 0·1081 Whole brain aDC 1·04 (0·17) 1·08 (0·04) 1·03 (0·20) 0·0183 Per 0·01 unit decrease 1·02 (0·99–1·04) 0·1758 NAA/Cr thalami § 1·19 (0·37) 1·53 (0·29) 1·09 (0·33) <0·0001 Per 0·1 unit decrease 1·55 (1·32–1·87) <0·0001 NAA/Cr pons ¶ 1·96 (0·46) 2·31 (0·38) 1·88 (0·43) <0·0001 Per 0·1 unit decrease 1·27 (1·13–1·45) 0·0002
Data are mean (SD), n (%), or median (IQR). OHCA score calculation, FLAIR-DWI scoring system, and EEG Synek classification are described in the appendix.
CPC=Glasgow-Pittsburgh Cerebral Performance Categories. NA=not applicable. OHCA=out-of-hospital cardiac arrest. EEG=electroencephalogram. FLAIR=fluid-attenuated inversion recovery. DWI=diffusion weighted imaging. FA=fractional anisotropy. aDC=average diffusion coefficient. 1H-MRS=proton magnetic resonance spectroscopy.
NAA/Cr=1H-MRS N-acetyl aspartate over creatine ratio. *p value for patients with a best numerical CPC of 1–2 (favourable outcome) versus patients with CPCs of 3–5 (unfavourable outcome). †p value for odds ratio greater than 1. ‡Based on 136 (91%) participants for whom EEG were interpretable or available. §The ratio is based on 131 (87%) participants for whom thalami were interpretable. ¶The ratio is based on 124 (83%) participants for whom pons spectra were interpretable
ROLE OF THE FUNDING SOURCE
The funder of the study had no role in study design, data collection, data analysis, data interpretation, or writing of the report. The corresponding author had full access to all the data in the study and had fi responsibility for the decision to submit for publication.
Results
Between Oct 1, 2006, and June 30, 2014, we enrolled 185 patients in the derivation cohort who met the inclusion criteria, of whom 150 were included in the analysis (figure 1); 33 (22%) had a favourable neurological outcome (12 with a best-achieved CPC score of 1 and 21 with a CPC of 2), of whom four eventually died within 6 months. Unfavourable outcome was reported in 117 (78%) patients, of whom 102 (87%) died with a median survival time of 19 days (IQR 13–32); at 6 months, ten had a CPC score of 4, and five had a score of 3. CPC and Rankin scale scores, and cause of death are given in the appendix. Withdrawal or limitation-of-care decisions were taken for 72 (48%) patients, 66 for neurological reasons, of whom 64 died and two eventually had a CPC score of 2 (appendix). Patients with a favourable outcome were younger (p=0·0146), less likely to have diabetes (p=0·0141), and more often had out-of-hospital cardiac arrest (p=0·0228), with a shockable first monitored rhythm (p<0·0001) and more frequent myocardial infarction (p=0·0019; table 1). At baseline, we found no significant difference between patients with favourable or unfavourable outcome in terms of Glasgow Coma Scale, resuscitation time, or return of spontaneous circulation (table 1).
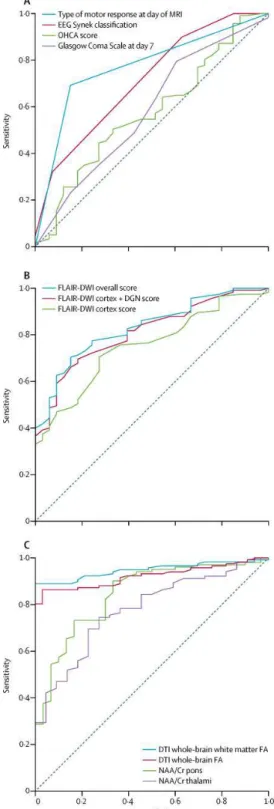
Patients with favourable outcomes were less likely to have a motor response the same or worse than the extensor response on the day of MRI (p<0·0001) or status myoclonus (p=0·0259; table 2). Three (9%) of 33 patients with favourable outcomes presented with at least two of the criteria of poor outcome according to the European Resuscitation Council and European Society of Intensive Care Medicine guidelines30 (appendix). In total, 136 (91%) patients had interpretable EEG. Median time to EEG was 3 days (IQR 2–5). Absence of EEG reactivity was recorded in 12 (44%) patients with a favourable outcome, and 83 (76%) with an unfavourable outcome (p=0·0022). Patients with a favourable outcome were more likely to have a favourable EEG pattern on Synek classification, but 15 (56%) of these patients were in the uncertain zone (table 2). Median time to MRI was not significantly different between patients with unfavourable outcomes (13 days [IQR 8–18]) or favourable outcomes (13 days [10–18]; p=0·8076). 88 scans were obtained within the second week after the cardiac arrest, 41 within the third week, and 21 after the third week. FLAIR or DWI images showed mild-to-severe signal abnormalities in basal ganglia or cortex in 12 patients with a favourable outcome (appendix p 18). 90 (78%) patients with an unfavourable outcome had FLAIR or DWI hypersignal in basal ganglia and 60 (52%) patients in cortex. FLAIR-DWI scores were significantly higher (ie, worse) in the unfavourable outcome group (table 2, appendix). Normalised WWM-FA and whole-brain FA by DTI were significantly lower in patients with unfavourable outcomes than in patients with favourable outcomes (table 2). 25 patients presented with severe
reductions in mean normalised WB-aDC (<0·91), all between days 7 and 14 after the cardiac arrest, none of whom had a favourable outcome at 6 months (appendix). In total, 131 (87%) 1H-MRS spectra were interpretable for thalami and 124 (83%) were interpretable for pons. The 1H-1H-MRS N-acetyl aspartate over creatine ratios in the thalami and pons were significantly lower in patients with unfavourable outcomes than in patients with favourable outcomes (table 2). The prognostic accuracy, as quantified by the area under the ROC curve, was significantly higher for unfavourable outcome with the normalised WWM-FA than with standard criteria or the other MRI sequences (figure 2, table 3). The optimum cutoff value of normalised WWM-FA was lower than 0·91, with a specificity of 100% (sensitivity 89%; table 3). The same cutoff value and similar specificity and sensitivity were obtained in adjusted analyses of the subpopulation excluding patients with withdrawal or limitation of care (appendix). For the whole population, after excluding the patients presenting a diffuse cytotoxic oedema, as defined by a low WB-aDC, the area under the ROC curve for normalised WWM-FA improved to 0·99 (95% CI 0·95–1·00), and sensitivity up to 0·95 (95% CI 0·88–0·98). The probability of unfavourable outcome with normalised WWM-FA values of 0·85 or lower was 100% (95% CI 99·8–100), and the probability of favourable outcome with a normalised WWM-FA value of higher than 0·95 was 94·9% (86·4–100; appendix). In the first combined model of the multivariate analyses, significant variables selected by stepwise regression (appendix) were Synek classification of EEG and motor response no better than extensor response at the day of MRI (area under the ROC curve 0·83, 95% CI 0·75–0·91; table 3). The second model, which included the FLAIR-DWI overall score, increased the area under the ROC curve to 0·92 (95% CI 0·87–0·96). Finally, the third model, which included normalised WWM-FA, increased the area under the ROC curve to 0·99 (0·98–1·00), with a specificity of 100% (95% CI 86–100) and a sensitivity of 98% (95% CI 93– 100). Between April 1, 2015, and March 31, 2016, we enrolled 58 patients in the validation cohort who met the inclusion criteria, of whom 50 were included in the analysis (figure 1). 11 (22%) analysed patients had a favourable neurological outcome (one with a best-achieved CPC score of 1 and ten with a CPC of 2), among whom one eventually died within 6 months. Unfavourable outcome was reported in 39 patients, among whom 29 (74%) died, with a median survival time of 19 days (IQR 16–45). At 6 months, six (15%) patients with an unfavourable outcome had a score of CPC 4, and four (10%) had a score of CPC 3. Rankin scale scores and cause of death are shown in the appendix. A normalised WWM-FA value lower than 0·91 had a negative predictive value of 71·4% (95% CI 41·9–91·6) and a positive predictive value of 100% (90·0–100), with 89·7% sensitivity (75·8–97·1) and 100% specificity (69·1–100).
Figure 2: Receiver operating characteristic curves of the principal predictors of unfavourable outcome
B.Qualitative MRI.
C.Quantitative MRI biomarkers for unfavourable outcome in the derivation cohort. OHCA score calculation, FLAIR-DWI scoring system, and EEG Synek classification are described in the appendix. EEG=electroencephalogram. OHCA=out-of-hospital cardiac arrest. FLAIR=fluid-attenuated inversion recovery. DWI=diffusion-weighted imaging. DNG=deep grey nuclei. DTI=diffusion tensor imaging. FA=fractional anisotropy. NAA/Cr=1H-MRS N-acetyl aspartate over creatine ratio. 1H-MRS=proton magnetic resonance spectroscopy.
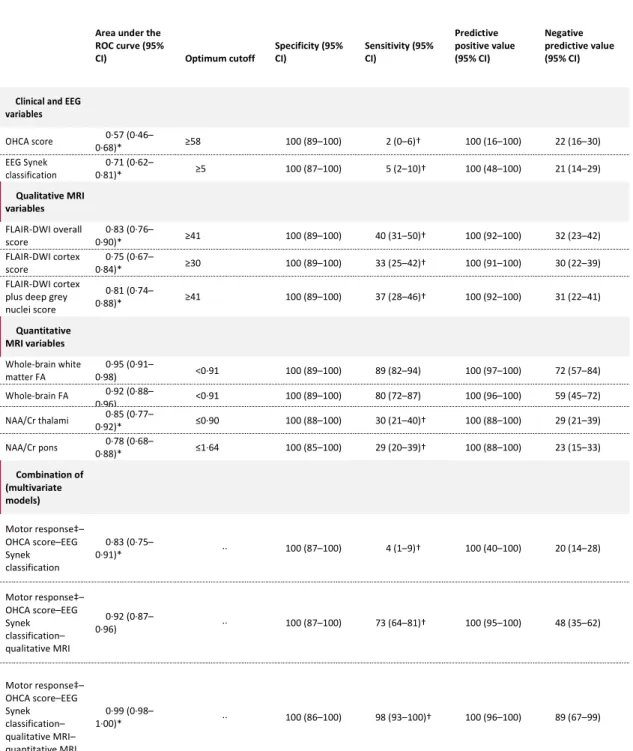
Table 3: Area under the receiver operating characteristic curve values and cutoff values with 100% specificity predicting unfavourable outcome after cardiac arrest in the derivation cohort
Area under the ROC curve (95%
CI) Optimum cutoff
Specificity (95% CI) Sensitivity (95% CI) Predictive positive value (95% CI) Negative predictive value (95% CI)
Clinical and EEG
variables OHCA score 0·57 (0·46– 0·68)* ≥58 100 (89–100) 2 (0–6)† 100 (16–100) 22 (16–30) EEG Synek classification 0·71 (0·62– 0·81)* ≥5 100 (87–100) 5 (2–10)† 100 (48–100) 21 (14–29) Qualitative MRI variables FLAIR-DWI overall score 0·83 (0·76– 0·90)* ≥41 100 (89–100) 40 (31–50)† 100 (92–100) 32 (23–42) FLAIR-DWI cortex score 0·75 (0·67– 0·84)* ≥30 100 (89–100) 33 (25–42)† 100 (91–100) 30 (22–39) FLAIR-DWI cortex plus deep grey nuclei score 0·81 (0·74– 0·88)* ≥41 100 (89–100) 37 (28–46)† 100 (92–100) 31 (22–41) Quantitative MRI variables Whole-brain white matter FA 0·95 (0·91– 0·98) <0·91 100 (89–100) 89 (82–94) 100 (97–100) 72 (57–84) Whole-brain FA 0·92 (0·88– 0·96) <0·91 100 (89–100) 80 (72–87) 100 (96–100) 59 (45–72) NAA/Cr thalami 0·85 (0·77– 0·92)* ≤0·90 100 (88–100) 30 (21–40)† 100 (88–100) 29 (21–39) NAA/Cr pons 0·78 (0·68– 0·88)* ≤1·64 100 (85–100) 29 (20–39)† 100 (88–100) 23 (15–33) Combination of (multivariate models) Motor response‡– OHCA score–EEG Synek classification 0·83 (0·75– 0·91)* ·· 100 (87–100) 4 (1–9)† 100 (40–100) 20 (14–28) Motor response‡– OHCA score–EEG Synek classification– qualitative MRI 0·92 (0·87– 0·96) ·· 100 (87–100) 73 (64–81)† 100 (95–100) 48 (35–62) Motor response‡– OHCA score–EEG Synek classification– qualitative MRI– quantitative MRI 0·99 (0·98– 1·00)* ·· 100 (86–100) 98 (93–100)† 100 (96–100) 89 (67–99)
OHCA score calculation, the FLAIR-DWI scoring system, and EEG Synek classification are described in the appendix. ROC=receiver operating characteristic. EEG=electroencephalogram. OHCA=out-of-hospital cardiac arrest. FLAIR=fluid-attenuated inversion recovery. DWI=diffusion-weighted imaging. FA=fractional anisotropy. 1H-MRS=proton magnetic resonance spectroscopy. NAA/Cr=1H-MRS N-acetyl aspartate over creatine ratio. *Area under the ROC curve significantly different than the one of the whole-brain white matter FA (p<0·05). †Sensitivity significantly different than the one of the whole-brain white matter FA (p<0·05). ‡Motor response no better than extensor response on MRI day.
Discussion
The present study focused on a subset of patients with cardiac arrest who did not regain consciousness by day 7. In our opinion, this is the patient group for whom major ethical issues arise, and in whom systematic withdrawal of care would alter the likeliness of late awakening in a subset of patients. In our study, 22% of patients not responding to simple verbal orders by day 7 after cardiac arrest had a CPC score of 1 or 2 at 6 months. The normalised WWM-FA measurement requires standardised post-processing steps from nearly conventional MRI sequences (DTI and three-dimensional T1-weighted images), which can be safely acquired during the second week after cardiac arrest, and is more accurate than other measures. The latest guidelines have recommended delaying cardiac arrest outcome prognostication for at least 72 h after rewarming,7,8 which corresponds to days 5–7 after cardiac arrest in most cases. However, so-called late awakeners after a cardiac arrest have been described as late as 25 days after arrest.31– 33 Our data clearly show that a proportion of patients can still recover after this period of time, despite absence of a response to simple orders after day 7. For these late awakeners remaining unresponsive at day 7, our results also suggest that evaluation by means of clinical symptoms, EEG, and conventional MRI are not specific or sensitive enough to be clinically usable. As early as 2001, FLAIR34 and DWI images were shown to add prognostic value to the clinical examination and CT. Hirsch and colleagues21 reported that a combination of FLAIR and DWI lesion counts leads to a sensitivity of 80% for a specificity of 100% in predicting unfavourable outcome, but in a population which included conscious patients scanned before day 8 after cardiac arrest. However, in our selected population, the FLAIR-DWI overall score had a sensitivity of only 40% for a specificity of 100%. This lower sensitivity might be attributable to the inclusion of only unresponsive patients on one hand, and because of a difference in the delay of MRI on the other. Indeed, in our selected population, some survivors had a favourable neurological outcome (especially patients with a CPC of 2) despite mild-to-severe signal abnormalities in the basal ganglia or cortex. Our finding supports the results of a large retrospective multicentre study, in which 15% of patients with favourable outcome had DWI signal abnormalities on MRI.35 Our study also showed that thalamic and pons 1H-MRS had a predictive accuracy similar to FLAIR and DWI scores. The substantial decrease in normalised WWM-FA reported in survivors with unfavourable outcome can be linked to the occurrence of delayed white matter injuries after cardiac arrest.14 Laitio and colleagues36 confirmed by use of DTI that demyelination occurred in comatose survivors of cardiac arrest and was mainly responsible for the decrease in FA. In our study, the clinically relevant values of normalised WWM-FA were 0·85, a threshold below which the probability of unfavourable outcome was close to 100%, and 0·95, a threshold above which the likelihood of favourable outcome was above 95%. Finally, we observed low WB-aDC in 25 patients in the derivation cohort—a feature
specifi to MRI performed between 7 and 14 days after cardiac arrest in patients with diffuse cytotoxic oedema. None of these patients had a favourable outcome, and 32% had FA above the threshold of 0·91, resulting in false negative scores if only normalised WWM-FA is considered. FA depends on the ratio between axial and radial diff , which are both decreased in low WB-aDC syndrome, which accounts for why FA measures can be unreliable in this context. Another potential limitation of the technique is the requirement for transportation of a ventilated patient to the MRI suite for 20–40 min, with total immobilisation, including potential use of sedation or even neuromuscular blockers. Currently, the FA measure also needs to be standardised for each scanner. Our findings should be interpreted in light of the following potential limitations. First, we cannot exclude the possibility of unmeasured confounding factors in this observational study. Second, our validation and derivation cohorts were consecutive rather than simultaneous. Therefore, we cannot eliminate a change in clinical care during the two periods. However, the change is very unlikely to be of such an extent to affect prognostic of cardiac arrest or affect the relation between anatomical changes of the white matter as assessed by normalised WWM-FA and outcome at 6 months. Third, we based our analysis on comparison of DTI with tools validated for an earlier prognostication. However, our point is that the clinical issue of prognostication arises in patients unconscious after 7 days not matching the usual criteria of poor outcome (grey-zone patients). Another limitation is our inclusion criteria and the timing of MRI, such that our results cannot be applied to MRI performed before day 7. Finally, we cannot exclude misclassification of outcome due to so-called self-fulfilling prophecies arising from premature decisions to withdraw life-sustaining therapy. However, even if we exclude all patients who died from care withdrawal, the cutoff for normalised WWM-FA and AUC did not vary significantly (appendix). In conclusion, our data suggest that quantitative MRI, specifically normalised WWM-FA derived from DTI, is a tool that could be used to predict outcome with a high degree of accuracy in patients with altered consciousness at day 7 after cardiac arrest. This evidence requires confirmation from future large-scale trials with a strict protocol of withdrawal or limitation-of-care decisions and time window for MRI.
Contributors
LP was the lead intensivist and contributed to the protocol development; study design and concept; conduct, data acquisition, and coordination; data interpretation; writing; and critical revision and reviewing of the report. LP takes responsibility for the integrity of the data and the accuracy of the data analysis. LV was involved in study design, concept, and conduct; the coordination and supervision of data collection; data interpretation; diffusion tensor imaging pipeline development; writing and coordinating drafts of the report; and reviewing the report. VP was involved in study design and conduct, diffusion tensor imaging pipeline development, data interpretation and quality check, and writing and reviewing the report. TB was involved in data analysis, statistical analysis, data interpretation, and editing the report; contributed to the statistical analysis plan; and approved the final report as submitted. SD was involved in data interpretation, diffusion tensor imaging pipeline development, and quality checking. DG and HB were involved in study design and concept, and revising the report critically. NA, GT, and VB were
involved in data collection and analysis, and preparation of the report; and contributed to the statistical analysis plan. AV, BJ, BRo, CA, CDP, C-EL, LN, NB, NG, OC, RC, SS, TT, and VC were involved in study conduct, data acquisition, and revising the report. BRi and RG were involved in data interpretation and revising the report critically. SL and GC were involved in study conduct, data acquisition and coordination, and revising the report critically. All authors approved the final version.
Declaration of interests
LP, DG, HB, and VP share together with institutions (AP-HP, INSERM, CNRS, and Sorbonne University) the property of patent WO2012160316, which partly covers the research of the present study. All other authors declare no competing interests.
References
1. Samaniego EA, Mlynash M, Caulfield AF, Eyngorn I, Wijman CA. Sedation confounds outcome prediction in cardiac arrest survivors treated with hypothermia. Neurocrit Care 2011; 15: 113–19. 2. Kamps MJ, Horn J, Oddo M, et al. Prognostication of neurologic outcome in cardiac arrest patients
after mild therapeutic hypothermia: a meta-analysis of the current literature. Intensive Care Med 2013; 39: 1671–82.
3. Ben-Hamouda N, Taccone FS, Rossetti AO, Oddo M. Contemporary approach to neurologic prognostication of coma after cardiac arrest. Chest 2014; 146: 1375–86.
4. Rossetti AO, Rabinstein AA, Oddo M. Neurological prognostication of outcome in patients in coma after cardiac arrest. Lancet Neurol 2016; 15: 597–609.
5. Paul M, Bougouin W, Geri G, et al. Delayed awakening after cardiac arrest: prevalence and risk factors in the Parisian registry. Intensive Care Med 2016; 42: 1128–36.
6. Irisawa T, Vadeboncoeur TF, Karamooz M, et al. Duration of coma in out-of-hospital cardiac arrest survivors treated with targeted temperature management. Ann Emerg Med 2017; 69: 36–43.
7. Cronberg T, Brizzi M, Liedholm LJ, et al. Neurological prognostication after cardiac arrest— recommendations from the Swedish Resuscitation Council. Resuscitation 2013; 84: 867–72.
8. Sandroni C, Cariou A, Cavallaro F, et al. Prognostication in comatose survivors of cardiac arrest: an advisory statement from the European Resuscitation Council and the European Society of Intensive Care Medicine. Resuscitation 2014; 85: 1779–89.
9. Sandroni C, Cariou A, Cavallaro F, et al. Prognostication in comatose survivors of cardiac arrest: an advisory statement from the European Resuscitation Council and the European Society of Intensive Care Medicine. Intensive Care Med 2014; 40: 1816–31.
10. Els T, Kassubek J, Kubalek R, Klisch J. Diffusion-weighted MRI during early global cerebral hypoxia: a predictor for clinical outcome? Acta Neurol Scand 2004; 110: 361–67.
11. Mlynash M, Campbell DM, Leproust EM, et al. Temporal and spatial profile of brain diffusion-weighted MRI after cardiac arrest. Stroke 2010; 41: 1665–72.
12. Wijman CA, Mlynash M, Caulfield AF, et al. Prognostic value of brain diffusion-weighted imaging after cardiac arrest. Ann Neurol 2009; 65: 394–402.
13. Greer DM, Scripko PD, Wu O, et al. Hippocampal magnetic resonance imaging abnormalities in cardiac arrest are associated with poor outcome. J Stroke Cerebrovasc Dis 2013; 22: 899–905. 14. Gerdes JS, Walther EU, Jaganjac S, Makrigeorgi-Butera M, Meuth SG, Deppe M. Early detection of
widespread progressive brain injury after cardiac arrest: a single case DTI and post-mortem histology study. PLoS One 2014; 9: e92103.
15. Newcombe VF, Williams GB, Scoffings D, et al. Aetiological differences in neuroanatomy of the vegetative state: insights from diffusion tensor imaging and functional implications. J Neurol Neurosurg Psychiatry 2010; 81: 552–61.
16. Luyt CE, Galanaud D, Perlbarg V, et al. Diffusion tensor imaging to predict long-term outcome after cardiac arrest: a bicentric pilot study. Anesthesiology 2012; 117: 1311–21.
17. Jacobs I, Nadkarni V, Bahr J, et al. Cardiac arrest and cardiopulmonary resuscitation outcome reports: update and simplification of the Utstein templates for resuscitation registries: a statement for healthcare professionals from a task force of the International Liaison Committee on Resuscitation (American Heart Association, European Resuscitation Council, Australian Resuscitation Council, New Zealand Resuscitation Council, Heart and Stroke Foundation of Canada, InterAmerican Heart Foundation, Resuscitation Councils of Southern Africa). Circulation 2004; 110: 3385–97.
18. Adrie C, Cariou A, Mourvillier B, et al. Predicting survival with good neurological recovery at hospital admission after successful resuscitation of out-of-hospital cardiac arrest: the OHCA score. Eur Heart J 2006; 27: 2840–45.
19. Synek VM. Prognostically important EEG coma patterns in diffuse anoxic and traumatic encephalopathies in adults. J Clin Neurophysiol 1988; 5: 161–74.
20. Synek VM. EEG abnormality grades and subdivisions of prognostic importance in traumatic and anoxic coma in adults. Clinical EEG 1988; 19: 160–66.
21. Hirsch KG, Mlynash M, Jansen S, et al. Prognostic value of a qualitative brain MRI scoring system after cardiac arrest. J Neuroimaging 2015; 25: 430–37.
22. Sotak CH. The role of diffusion tensor imaging in the evaluation of ischemic brain injury—a review. NMR Biomed 2002; 15: 561–69.
23. Brain Resuscitation Clinical Trial I Study Group. Randomized clinical study of thiopental loading in comatose survivors of cardiac arrest. N Engl J Med 1986; 314: 397–403.
24. Rankin J. Cerebral vascular accidents in patients over the age of 60. II. Prognosis. Scott Med J 1957; 2: 200–15.
25. van Swieten JC, Koudstaal PJ, Visser MC, Schouten HJ, van Gijn J. Interobserver agreement for the assessment of handicap in stroke patients. Stroke 1988; 19: 604–07.
26. Buderer NM. Statistical methodology: I. Incorporating the prevalence of disease into the sample size calculation for sensitivity and specificity. Acad Emerg Med 1996; 3: 895–900.
27. Hanley JA, McNeil BJ. A method of comparing the areas under receiver operating characteristic curves derived from the same cases. Radiology 1983; 148: 839–43.
28. Robin X, Turck N, Hainard A, et al. pROC: an open-source package for R and S+ to analyze and compare ROC curves. BMC Bioinformatics 2011; 12: 77.
29. DeLong ER, DeLong DM, Clarke-Pearson DL. Comparing the areas under two or more correlated receiver operating characteristic curves: a nonparametric approach. Biometrics 1988; 44: 837–45. 30. Nolan JP, Soar J, Cariou A, et al. European Resuscitation Council and European Society of Intensive
Care Medicine 2015 guidelines for post-resuscitation care. Intensive Care Med 2015; 41: 2039–56. 31. Rittenberger JC, Popescu A, Brenner RP, Guyette FX, Callaway CW. Frequency and timing of
nonconvulsive status epilepticus in comatose post-cardiac arrest subjects treated with hypothermia. Neurocrit Care 2012; 16: 114–22.
32. Al Thenayan E, Savard M, Sharpe M, Norton L, Young B. Predictors of poor neurologic outcome after induced mild hypothermia following cardiac arrest. Neurology 2008; 71: 1535–37.
33. Greer DM. Unexpected good recovery in a comatose post-cardiac arrest patient with poor prognostic features. Resuscitation 2013; 84: e81–82.
34. Wijdicks EF, Campeau NG, Miller GM. MR imaging in comatose survivors of cardiac resuscitation. AJNR Am J Neuroradiol 2001; 22: 1561–65.
35. Ryoo SM, Jeon SB, Sohn CH, et al. Predicting outcome with diffusion-weighted imaging in cardiac arrest patients receiving hypothermia therapy: multicenter retrospective cohort study. Crit Care Med 2015; 43: 2370–77.
36. Laitio R, Hynninen M, Arola O, et al. Effect of inhaled xenon on cerebral white matter damage in comatose survivors of out-of-hospital cardiac arrest: a randomized clinical trial. JAMA 2016; 315: 1120–28.