Integrating functional connectivity and climate
change in the design of protected area networks
Thèse
Sarah Bauduin
Doctorat en sciences forestières
Philosophiæ doctor (Ph.D.)
Québec, Canada
Integrating functional connectivity and climate
change in the design of protected area networks
Thèse
Sarah Bauduin
Sous la direction de :
Steve Cumming, directeur de recherche
Eliot McIntire, codirecteur de recherche
iii
Résumé
Le rapide déclin actuel de la biodiversité est inquiétant et les activités humaines en sont la cause directe. De nombreuses aires protégées ont été mises en place pour contrer cette perte de biodiversité. Afin de maximiser leur efficacité, l’amélioration de la connectivité fonctionnelle entre elles est requise. Les changements climatiques perturbent actuellement les conditions environnementales de façon globale. C’est une menace pour la biodiversité qui n’a pas souvent été intégrée lors de la mise en place des aires protégées, jusqu’à récemment. Le mouvement des espèces, et donc la connectivité fonctionnelle du paysage, est impacté par les changements climatiques et des études ont montré qu’améliorer la connectivité fonctionnelle entre les aires protégées aiderait les espèces à faire face aux impacts des changements climatiques.
Ma thèse présente une méthode pour concevoir des réseaux d’aires protégées tout en tenant compte des changements climatiques et de la connectivité fonctionnelle. Mon aire d’étude est la région de la Gaspésie au Québec (Canada). La population en voie de disparition de caribou de la Gaspésie-Atlantique (Rangifer tarandus caribou) a été utilisée comme espèce focale pour définir la connectivité fonctionnelle. Cette petite population subit un déclin continu dû à la prédation et la modification de son habitat, et les changements climatiques pourraient devenir une menace supplémentaire. J’ai d’abord construit un modèle individu-centré spatialement explicite pour expliquer et simuler le mouvement du caribou. J’ai utilisé les données VHF éparses de la population de caribou et une stratégie de modélisation patron-orienté pour paramétrer et sélectionner la meilleure hypothèse de mouvement. Mon meilleur modèle a reproduit la plupart des patrons de mouvement définis avec les données observées. Ce modèle fournit une meilleure compréhension des moteurs du mouvement du caribou de la Gaspésie-Atlantique, ainsi qu’une estimation spatiale de son utilisation du paysage dans la région. J’ai conclu que les données éparses étaient suffisantes pour ajuster un modèle individu-centré lorsqu’utilisé avec une modélisation patron-orienté. Ensuite, j’ai estimé l’impact des changements climatiques et de différentes actions de conservation sur le potentiel de mouvement du caribou. J’ai utilisé le modèle individu-centré pour simuler le mouvement du caribou dans
iv
des paysages hypothétiques représentant différents scénarios de changements climatiques et d’actions de conservation. Les actions de conservation représentaient la mise en place de nouvelles aires protégées en Gaspésie, comme définies par le scénario proposé par le gouvernement du Québec, ainsi que la restauration de routes secondaires à l’intérieur des aires protégées. Les impacts des changements climatiques sur la végétation, comme définis dans mes scénarios, ont réduit le potentiel de mouvement du caribou. La restauration des routes était capable d’atténuer ces effets négatifs, contrairement à la mise en place des nouvelles aires protégées. Enfin, j’ai présenté une méthode pour concevoir des réseaux d’aires protégées efficaces et j’ai proposé des nouvelles aires protégées à mettre en place en Gaspésie afin de protéger la biodiversité sur le long terme. J’ai créé de nombreux scénarios de réseaux d’aires protégées en étendant le réseau actuel pour protéger 12% du territoire. J’ai calculé la représentativité écologique et deux mesures de connectivité fonctionnelle sur le long terme pour chaque réseau. Les mesures de connectivité fonctionnelle représentaient l’accès général aux aires protégées pour le caribou de la Gaspésie-Atlantique ainsi que son potentiel de mouvement à l’intérieur. J’ai utilisé les estimations de potentiel de mouvement pour la période de temps actuelle ainsi que pour le futur sous différents scénarios de changements climatiques pour représenter la connectivité fonctionnelle sur le long terme. Le réseau d’aires protégées que j’ai proposé était le scénario qui maximisait le compromis entre les trois caractéristiques de réseau calculées.
Dans cette thèse, j’ai expliqué et prédit le mouvement du caribou de la Gaspésie-Atlantique sous différentes conditions environnementales, notamment des paysages impactés par les changements climatiques. Ces résultats m’ont aidée à définir un réseau d’aires protégées à mettre en place en Gaspésie pour protéger le caribou au cours du temps. Je crois que cette thèse apporte de nouvelles connaissances sur le comportement de mouvement du caribou de la Gaspésie-Atlantique, ainsi que sur les actions de conservation qui peuvent être prises en Gaspésie afin d’améliorer la protection du caribou et de celle d’autres espèces. Je crois que la méthode présentée peut être applicable à d’autres écosystèmes aux caractéristiques et besoins similaires.
v
Abstract
The world is facing worrisome declines in biodiversity. Species extinction rates have increased as a direct consequence of human activities. Protected areas have been implemented around the world in an effort to counter biodiversity loss. Although protected areas are part of the solution, they should be designed systematically in a way to maximize their effectiveness. Enhancing functional connectivity between protected areas is one way to increase their effectiveness. Climate change is disrupting environmental conditions globally. It is a threat to biodiversity that until recently was not often integrated into protected area design. Climate change has been shown to impact species movements, and therefore landscape functional connectivity. Some studies have suggested that enhancing functional connectivity between protected areas can also help species cope with climate change impacts.
My thesis presents a methodology to design protected area networks while accounting for climate change and functional connectivity. My study area is located in the natural region of Gaspésie in Québec (Canada). The endangered Atlantic-Gaspésie population of woodland caribou (Rangifer tarandus caribou) was used as the focal species to define functional connectivity. This small population is in long-term decline due to predation and habitat change, but climate change may become an additional threat. First, I built a spatially explicit individual-based model to explain and simulate caribou movement. I used sparse VHF data available at the time of the study to select and parameterize a movement model using a pattern-oriented modeling strategy. My best model reproduced most of the movement patterns defined from the observed data. This model improved the understanding of the movement drivers for the Atlantic-Gaspésie caribou. It also provided spatial estimates of caribou landscape use in the Gaspésie region. I concluded that sparse data were sufficient to fit individual-based models when coupled with a pattern-oriented modeling strategy. Second, I estimated how climate change and conservation activities may impact caribou movement potential. I used the individual-based model to simulate caribou movements in hypothetical landscapes representing the impacts of various climate change scenarios and conservation activities. Conservation activities represented the implementation of new protected areas in Gaspésie, according to the scenario developed by
vi
the government of Québec, and the restoration of secondary roads inside protected areas. Climate change impacts on vegetation, as defined in my scenarios, reduced caribou movement potential. Road restoration was able to mitigate these negative effects whereas the implementation of the new protected areas did not improve caribou movement potential. Third, I presented a methodology to design effective protected area networks and proposed new protected areas to implement in Gaspésie to conserve biodiversity in the presence of climate change. I created a large sample of protected area networks expanding the existing network to reach an areal target of 12%. I then calculated an ecological representativeness index and two measures of functional connectivity over time for each network. Functional connectivity measures represented the overall access to the protected areas and the movement potential in them for the Atlantic-Gaspésie caribou. I used movement potential estimates for the current time period and for the future under different climate change scenarios to represent functional connectivity. The protected area network I proposed maximized the trade-off between the three network features I calculated.
In this thesis I examined Atlantic-Gaspésie caribou movements under different environmental conditions, including climate change impacted landscapes. These results helped define new protected areas for the Gaspésie region that will protect the caribou population over time. I believe this thesis gives new insights on the Atlantic-Gaspésie caribou movement behavior, as well as on the management actions that could be taken in Gaspésie to improve conservation of caribou and of other species. I believe this methodology could be applied to other ecosystems with similar characteristics and needs.
vii
Table of content
Résumé ... iii
Abstract ... v
Table of content ... vii
List of tables ... ix
List of figures ... x
List of appendices ... xii
Abbreviations ... xiii
Remerciements ... xv
Avant-propos ... xviii
General introduction ... 1
Global biodiversity decline ... 1
The concept of protected area networks ... 2
Building effective protected area networks ... 4
Case study: the Gaspésie peninsula ... 5
Focal population: the Atlantic-Gaspésie caribou ... 6
Thesis outline ... 8
References ... 10
Chapter 1: Overcoming challenges of sparse telemetry data to estimate caribou movement ... 15
Résumé ... 16
Abstract ... 17
Introduction ... 18
Material and methods ... 20
Case study: the Atlantic-Gaspésie caribou population ... 20
Spatially explicit individual-based model ... 23
Movement models ... 29
Model parameterization ... 31
Movement hypothesis testing ... 33
Model validation ... 33
Landscape use estimate and comparison with habitat selection model ... 34
Results ... 34
Model parameterizations and selection ... 34
Model validation ... 38
Landscape use estimate ... 38
Comparison of SE-IBM and RSF landscape use estimates ... 39
Discussion ... 40
Conclusion ... 43
Acknowledgements ... 44
References ... 45
Appendix ... 51
Chapter 2: Reducing movement barriers mitigates negative effects of climate change on caribou movement potential ... 62
viii
Abstract ... 64
Introduction ... 65
Material and methods ... 66
Case study: the Atlantic-Gaspésie caribou ... 66
Movement model ... 69 Landscape scenarios ... 71 Movement potential ... 72 Results ... 74 Discussion ... 76 Management Implications ... 79 Acknowledgements ... 80 References ... 81 Appendices ... 85
Chapter 3: Maximizing ecological representativeness and functional connectivity over time when designing protected area networks ... 92
Résumé ... 93
Abstract ... 94
Introduction ... 95
Material and methods ... 97
Study area ... 97
Building protected area networks ... 99
Network ecological representativeness ... 101
Network functional connectivity ... 101
Network selection ... 103
Results ... 103
Protected area networks ... 103
Network ecological representativeness and functional connectivity trade-off ... 105
Discussion ... 107
Acknowledgements ... 111
References ... 112
General conclusion ... 116
The power of individual-based models ... 117
Importance of incorporating functional connectivity and climate change ... 118
Multi-model integration ... 119
ix
List of tables
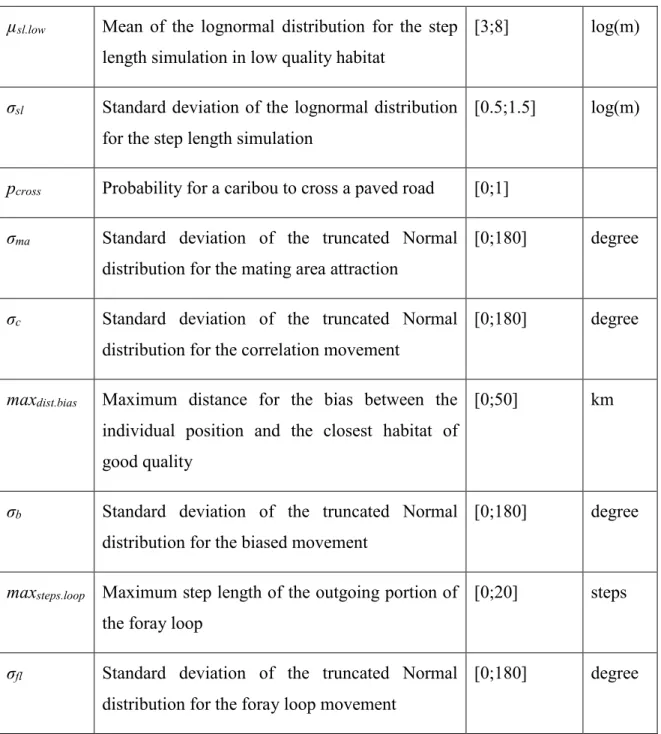
Table 1.1: Model parameters to be estimated with the range of values tested within the
pattern-oriented modeling strategy and their unit... 27
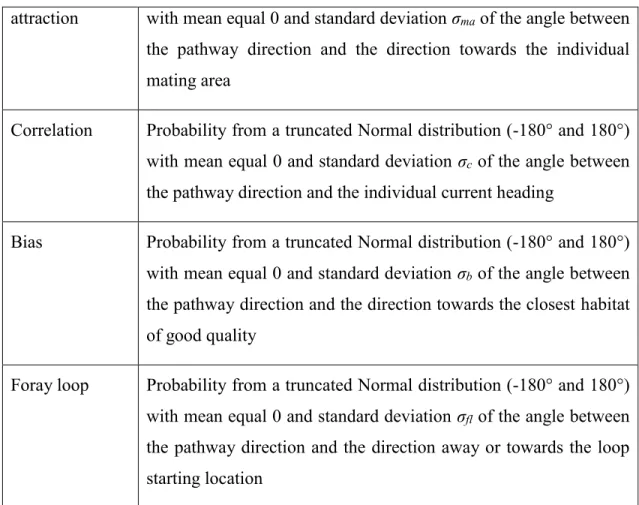
Table 1.2: Movement characteristic and index values used to assign pathway probabilities
(see Appendix 1.A for more details). ... 29
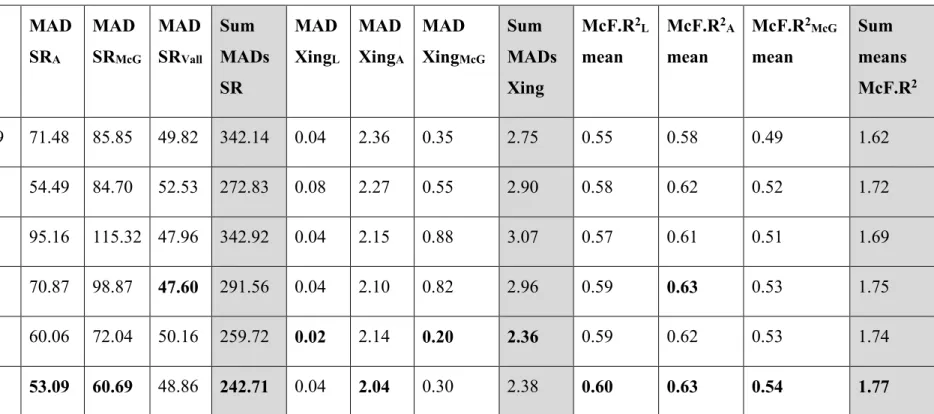
Table 1.3: Parameter estimates with 95% confidence intervals for each model. ... 35 Table 1.4: Pattern statistics for the model selection process. White columns are the statistic
means over the 10,000 simulations and grey columns are the sum of these statistic means over each of the three global patterns. Bold values highlight the model which performed the best for that statistic. SR=subpopulation range pattern, L=Logan, A=Albert, McG=McGerrigle, Vall= Vallières-St-Réal, Xing=road crossing pattern, McF.R2=
McFadden’s R². ... 37
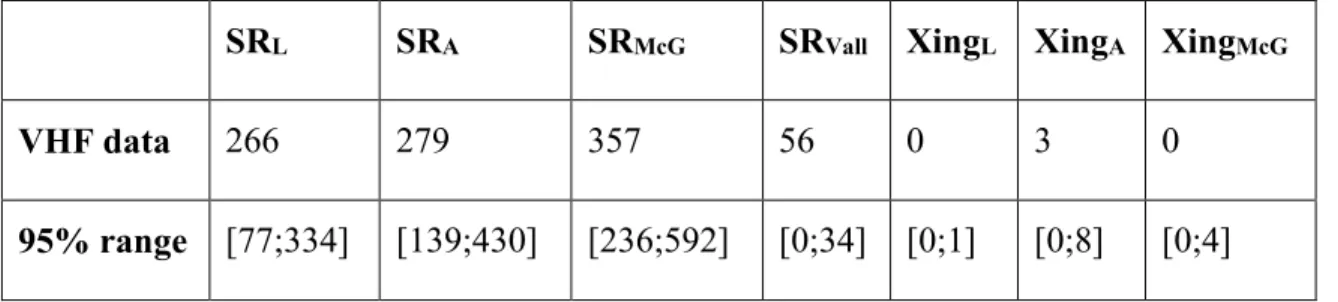
Table 1.5: Pattern values from the VHF data and 95% coverages from simulation outputs
with the best model. SR=subpopulation range pattern, L=Logan, A=Albert, McG=McGerrigle, Vall= Vallières-St-Réal, Xings=road crossing pattern. ... 38
Table 2.A.1: Parameter estimates and their 95% confidence interval for the caribou
x
List of figures
Figure 1.1: Left inset: The province of Québec (Canada), with study area, the Gaspésie
natural region, outlined. Lower map: Summer resource selection function for the Atlantic-Gaspésie caribou (Gaudry 2013) applied over our study area. Paved roads are shown in thin lines and the boundary of Gaspésie National Park is the thick outline. The four towns nearest to recent caribou sightings distant from the park are indicated (St-Laurent, unpublished data). Right inset: Caribou movement paths defined from consecutive VHF locations, with the park boundary and subpopulation ranges outlined. ... 21
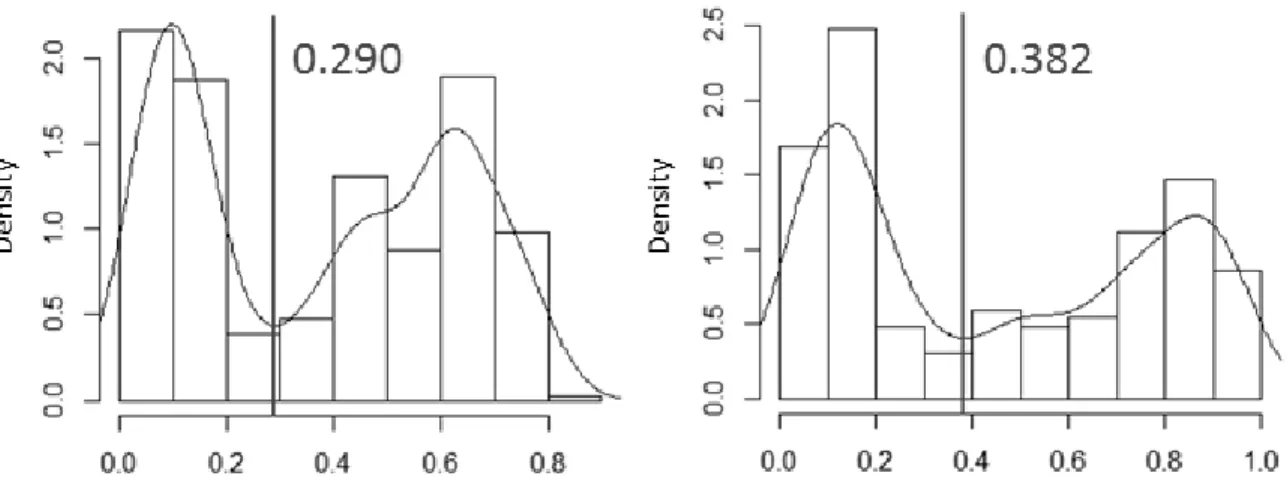
Figure 1.2: Kernel density estimates of habitat quality values at VHF locations for summer
(800 locations) and winter (770 locations). The thresholds separating good and low habitat quality behaviors are shown. ... 25
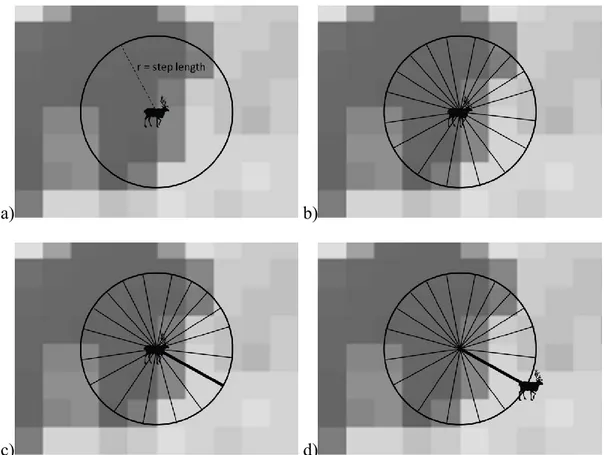
Figure 1.3: Movement illustrations of one daily time step for one individual. a) A step
length is sampled. b) All unique pathways are identified, going from the individual current position to every unique cell of the gridded landscape at the sampled distance. c) One pathway is selected (thick line) based on probabilities derived from the characteristics of the movement model followed by the individual. d) The individual moves to the end of the selected pathway. The underling grey-scale grid represents the habitat quality layer. ... 28
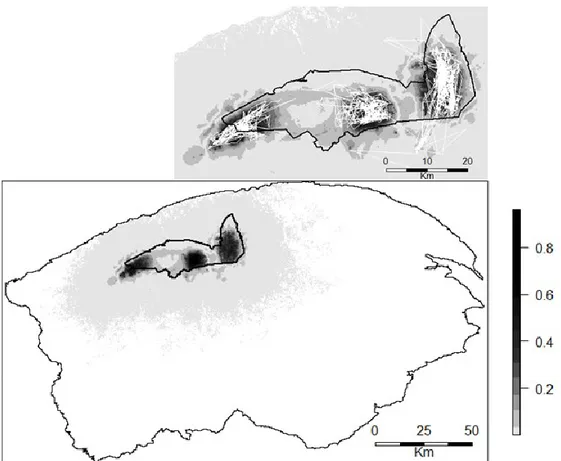
Figure 1.4: Lower map: Atlantic-Gaspésie caribou predicted landscape use for the time
period of the VHF data surveys with the Gaspésie National Park boundary overlaid. Inset: Landscape use in the vicinity of the park with caribou paths inferred from VHF data (Fig. 1.1) shown as thin white lines. ... 39
Figure 1.5: Atlantic-Gaspésie caribou relative landscape use as a function of distance to the
nearest subpopulation range, calculated from resource selection function (RSF) and spatially explicit individual-based model (SE-IBM). ... 40
Figure 1.A.1: Illustration of how pathway index values, which are then rescaled into
probabilities, were calculated for each movement characteristic. a) Probabilities based on landscape quality. The colors represent quality values with green/yellow for high values (good quality habitats) and pink for low values (low quality habitats). b) Probabilities based on the presence of paved road on the pathways and the crossing probability pcross (Table 1.1) for an Atlantic-Gaspésie caribou. c) Probabilities based on the deviation of the pathways with the direction towards the individual mating area (i.e., heart shape). d) Probabilities based on deviation of the pathway with the current individual’s heading defined with the location at the previous time step (t-1). e) Probabilities based on the deviation of the pathways with the direction towards the closest area of good quality (i.e., green area). f) Probabilities based on the deviation of the pathway with the direction away from the individual loop starting point. g) Probabilities based on the deviation of the pathway with the direction towards the individual loop starting point. ... 53
Figure 2.1: Left inset: Province of Québec (Canada) with study area outlined. a) Study area
with the existing protected areas and proposed new biodiversity reserves. The largest protected area in the north-west of the study area is the Gaspésie National Park. Subpopulation ranges are delineated by an 80% kernel density using caribou VHF and GPS
xi
data (L=Logan, A=Albert and M=McGerrigle). b) Road network in the study area overlaid on the existing protected areas... 67
Figure 2.2: Total area of high movement potential (AreaHMP) under climate change and
road restoration scenarios. The bars indicate the means over the two protected area scenarios, with 95 % confidence intervals. The dashed line at AreaHMP = 575.8 km²
represents the area for the scenario without climate change and road restoration. The values are averaged over the two protected areas scenarios (PA0 and PA+). ... 74
Figure 2.3: Spatial representation of movement potential for the Atlantic-Gaspésie caribou
around the Gaspésie National Park (black outline) for the most extreme climate change and road restoration scenarios. The grey scale represents a gradient of movement potential, from high (black) to low (pale grey), measured relatively to a null model. Values are averaged over the two protected area scenarios (PA0 and PA+). ... 76
Figure 3.1: The Gaspésie natural region with existing protected areas and the additions
proposed by the government of Québec (MDDELCC). Right inset: Province of Québec (Canada) with study area outlined. ... 98
Figure 3.2: Scatter plots of network time-averaged functional connectivity against
ecological representativeness. a) The time-averaged functional connectivity index represents the proportion of protected areas reachable by the caribou. b) The time-averaged functional connectivity index represents the proportion of protected areas in which the caribou movement potential was above 0.01 km². The orange dashed lines represent fitted linear regression models of the functional connectivity features against ecological representativeness. The solid lines represent the feature values at quantile Q (Q = 0.956 in Fig. a and Q = 0.998 in Fig. b) to identify the scenario (dot of the same color as the solid lines) with the best trade-off between the two features plotted. The blue dots represent the networks selected as the best trade-off using each non-time-averaged movement potential estimates to calculate the functional connectivity measure presented. The five blue dots in each figure are not all visible due to some overlaps. The yellow dot identifies the network with the best trade-off between ecological representativeness and the two time-averaged functional connectivity measures. This network scenario is the one mapped in Figure 3.3. The pink triangle represents the network scenario proposed by the government of Québec (MDDELCC). a) The red dot represents the scenario with the best trade-off between the two features plotted in Fig. b. b) The green dot represents the scenario with the best trade-off between the two features plotted in Fig. a. ... 105
Figure 3.3: Protected area network scenario with the best trade-off between ecological
representativeness and the two measures of time-averaged functional connectivity. The existing protected areas are represented by their catchment limits as used in the analysis by the BEACONs tools. The outlines of the new protected areas proposed by the government of Québec (MDDELCC) are overlaid with their intersections (dashed areas) with our proposed scenario. ... 107
xii
List of appendices
Appendix 1.A: Movement model for the Atlantic-Gaspésie caribou: Overview, Design
concepts, and Details protocol. ... 51
Appendix 2.A: New parameter estimates (Table 2.A.1) for the caribou movement model.
We followed the model parameterization method used in Bauduin et al. (Chapter 1). We aimed to reproduce two sets of movement patterns, one defined with VHF data and one with GPS data. These parameter estimates were used to simulate caribou movement for this study. ... 85
Appendix 2.B: Construction of potential future landscapes for the climate change and
xiii
Abbreviations
AAC: annual allowable cut AD: absolute deviation ANOVA: analysis of variance
AreaHMP: area of high movement potential
BEACONs: Boreal Ecosystems Analysis for Conservation Networks BFEC: Bureau du Forestier en Chef du Québec
CC (CC0, CCMin, CCMed, CCHigh): climatic scenarios (CC0 = no climate change, CCMin = minimum climate change impacts, CCMed = medium climate change impacts, CCHigh = high climate change impacts)
COSEWIC: Committee on the Status of Endangered Wildlife in Canada GIS: geographical information system
good-HQ: good habitat quality GPS: global positioning system
hm-BCRW: habitat-mediated biased correlated random walk hm-FL: habitat-mediated foray loop
hm-RW: habitat-mediated random walk IBM: individual-based model
IPCC: Intergovernmental Panel on Climate Change IUCN: International Union for Conservation of Nature low-HQ: low habitat quality
M1 to M6: model 1 to model 6 MAD: mean absolute deviation
xiv
MDDELCC: Ministère du Développement Durable, de l’Environnement et de la Lutte contre les Changements Climatiques du Québec
MFFP: Ministère des Forêts, de la Faune et des Parcs du Québec ODD: overview, design concepts, and details
PA (PA0, PA+): protected area network scenarios (PA0 = current protected areas, PA+ = current protected areas coupled with the biodiversity reserves from the scenario proposed by the government of Québec (MDDELCC))
POM: pattern-oriented modeling R. t. c.: Rangifer tarandus caribou
Road (Road0, Road50, Road100): road restoration scenarios (Road0 = no restoration, Road50 = restoration of 50% of the secondary roads, Road100 = restoration of all secondary roads)
RSF: resource selection function
SE-IBM: spatially explicit individual-based model VHF: very high frequency
xv
Remerciements
Je tiens à remercier tout d’abord mes trois directeurs qui m’ont guidée et encouragée pendant toutes ces années. Merci à Steve Cumming de m’avoir accueillie dans son laboratoire. Merci de l’aide apportée, de m’avoir fait confiance et laissé prendre mes décisions dans ce projet. Merci à Eliot McIntire pour son aide, autant à distance que lors de mes visites au Pacific Forestry Centre. L’énorme travail effectué ensemble lors de mon premier passage à Victoria aura été déterminant pour ma thèse et son passage à la vitesse supérieure. De plus, mon temps passé à Victoria aura été un magnifique séjour dans l’Ouest. Merci à Martin-Hugues St-Laurent qui, aussi malgré la distance, a toujours été là pour m’aider. Merci d’avoir toujours été rapide et efficace à me répondre, pour mes corrections et tous mes questionnements.
De l’Université Laval, je tiens à remercier particulièrement Pierre Racine qui m’a été d’une grande aide pour mes débuts avec ArcGIS. Merci à mes collègues de bureau d’avoir rendu les journées plus agréables; ceux du 2111 : Aude Corbani, Toshinori Kawaguchi et Jean Marchal (merci aussi pour son aide avec R et l’informatique en général); ainsi que ceux du 2107 : Flavie Noreau, Mathieu Paradis et Mélina Houle. Merci aux Cool Kids de m’avoir intégrée dans leur cercle : Christian Roy, Nicole Barker, Sébastien Renard, Josh Nowak (merci de m’avoir fait découvrir le hockey !) et Jerod Merkle. Merci aux membres du Métalab, présents entre autres pour m’aider dans la préparation de mes présentations orales. Merci à François Fabianek, Renée Roy et Julie Faure-Lacroix d’avoir fait des diners une pause divertissante dans la routine du travail. Merci à Louis Bélanger et à tous les Beavers de m’avoir accueillie dans la secte du castor, pour tous les moments (sérieux ou de détente) partagés ensemble. Je pense particulièrement à ceux avec qui tout a commencé : Amélie Denoncourt, Marie-Ève Deshaies, Victor David, et Eric Domaine, ainsi que Papy-Claude Bolaluembe Boliale et Michel Babalé.
Du Pacific Forestry Centre, je ne remercierai jamais assez Alex Chubaty d’avoir mis au point Condor, avec Eliot, pour faire tourner mes simulations. J’ai tant fait appel à Alex pour réparer et ajuster Condor et mon projet ne serait rien sans la capacité informatique à laquelle j’ai eu accès grâce à lui. Merci à Julia Chacón et Alana Clason pour le temps passé
xvi
ensemble à Victoria. Merci à toutes les personnes du Pacific Forestry Centre avec qui j’ai interagi, de près ou de loin, et qui ont toutes été formidables avec moi durant mes visites à Victoria.
De l’Université du Québec à Rimouski, je tiens à remercier particulièrement William Gaudry, Mathieu Boudreau et Fréderic Lesmerises. Un grand merci à William pour son aide avec la fonction de sélection de ressources sur le caribou et d’avoir répondu à mes innombrables emails et appels Skype quand j’ai débuté. Merci à Mathieu pour le temps passé ensemble à arranger nos cartes. Et merci à Frédéric d’avoir toujours été là pour répondre à mes questions et me fournir les données que j’avais besoin, toujours avec une rapidité appréciée. Merci à Marylène Ricard pour le temps passé ensemble, ainsi qu’à tous les membres du laboratoire de Martin-Hugues que j’ai pu rencontrer lors de mon bref passage à Rimouski et lors de la conférence à Whitehorse.
Je remercie énormément Ouranos, le Centre d’étude de la forêt, Eliot et Steve pour le soutien financier au cours de toutes ces années. Merci au Ministère des Forêts, de la Faune et des Parcs du Québec pour les données fournies et à Catherine Périé pour son aide. Merci au Ministère du Développement Durable, de l’Environnement et de la Lutte contre les Changements Climatiques du Québec pour les données fournies et à François Brassard et Dominic Boisjoly pour leur intérêt dans mon projet et d’avoir toujours été présents lorsque j’avais des questions. Merci au Bureau du Forestier en Chef du Québec pour les données fournies. Merci à l’équipe BEACONs pour les données fournies et à Kim Lisgo et Pierre Vernier pour leur aide à m’expliquer l’utilisation de leurs outils.
Merci aux membres de mon comité d’évaluation d’avoir accepté de réviser mon travail : Nathalie Barrette et Louis Bélanger pour mes débuts, et Marc Mazerolle, Lael Parrott et Scott Nielsen pour mon comité final.
Je tiens à remercier Julien Martin du Florida Fish and Wildlife Conservation Commission, mon directeur de stage de 2ème année de maitrise, ainsi que sa collègue Holly Edwards. Ce stage est probablement l’une des raisons principales pour laquelle je suis ici. Merci de l’encadrement et du soutien apportés pendant ce projet.
Enfin, je tiens à remercier mes amis qui m’ont accompagnée pendant ce périple et qui m’ont donné la dose de bonne humeur requise : Charlène, ma colocataire des premiers
xvii
jours; Jeremy, qui est entré dans l’aventure doctorat en même temps que moi; mes génialissimes colocataires: Maude, Simon, Alex, Oli et Kim; Audrey et Lina, mes deux Québécoises; Françoise, ma colocataire de Victoria qui aura poussé à l’extrême mon proverbe préféré « Qui veut peut »; et enfin Negar, Kyle et Rob, mes superbes rencontres à Victoria qui ont rendu ce passage sur l’Ile de Vancouver un épisode inoubliable. Finalement, je tiens à remercier ma maman, mon frère et ma grand-mère, qui malgré les milliers de kilomètres qui nous séparent, sont toujours là pour moi et me soutiennent.
xviii
Avant-propos
La thèse présentée comporte trois chapitres. Ils sont rédigés sous la forme d’article scientifique pour des fins de publication. Je suis l’auteure principale de chaque article. J’ai réalisé avec l’aide de mes coauteurs : la définition des objectifs et des hypothèses, l’établissement de la méthodologie et l’interprétation des résultats. J’ai réalisé seule : la construction des modèles, la réalisation des analyses statistiques et la rédaction des manuscrits. Les étapes réalisées seules ont été revues et corrigées par mes coauteurs. La version présentée des articles dans cette thèse est la version soumise, ou à être soumise, excepté pour les résumés. Les résumés ont été raccourcis pour répondre aux critères de la Faculté des études supérieures et postdoctorales pour le dépôt de la thèse.
L’article du premier chapitre s’intitule « Overcoming challenges of sparse telemetry
data to estimate caribou movement ». Il a été réalisé en collaboration avec Eliot McIntire,
Martin-Hugues St-Laurent et Steve Cumming. L’article a été accepté pour publication dans la revue Ecological Modelling en mai 2016.
L’article du second chapitre s’intitule « Reducing movement barriers mitigates
negative effects of climate change on caribou movement potential ». Il a été réalisé en
collaboration avec Eliot McIntire, Martin-Hugues St-Laurent et Steve Cumming. L’article a été soumis à la revue Journal of Applied Ecology en mai 2016.
L’article du troisième chapitre s’intitule « Maximizing ecological representativeness
and functional connectivity over time when designing protected area networks ». Il a été
réalisé en collaboration avec Steve Cumming, Martin-Hugues St-Laurent et Eliot McIntire. L’article sera prochainement soumis à Landscape Ecology.
1
General introduction
Global biodiversity decline
Biodiversity decline is currently a global phenomenon (Pereira et al. 2010; Ceballos et al. 2015). Even with conservative assumptions, modern rates of extinction for vertebrate species are 8 to 100 times higher than the background rates (Ceballos et al. 2015). Among the various ecosystem functions contributing to human well-being, more than half are declining due to a loss of biodiversity (Millennium Ecosystem Assessment 2005). Five major drivers of biodiversity decline have been identified, affecting differently the various ecosystems on the planet. These drivers are habitat change, climate change, invasive species, over-exploitation, and pollution (Secretariat of the Convention on Biological Diversity 2006). All are direct consequences of human activities.
Habitat change, through landscape modification and habitat fragmentation, has the greatest impact on biodiversity decline on a global scale (Secretariat of the Convention on Biological Diversity 2006). The conversion of species’ habitats into landscapes adapted for human needs has driven past extinctions of species and continues to be a current threat. In Canada, most of the caribou populations (Rangifer tarandus) are declining (Vors & Boyce 2009; Festa-Bianchet et al. 2011). For boreal populations of woodland caribou (R. t.
caribou), alterations of caribou habitat by forestry is recognized as a major driver of trends
in population demographics (Leclerc, Dussault & St-Laurent 2014; Losier et al. 2015). Another example refers to the modern decline of the Atlantic-Gaspésie caribou population (R. t. c.) in Québec, which is largely related to higher predation pressure exacerbated by anthropogenic disturbances. Indeed, predator populations are sustained by other prey species that are favored by young forests resulting from intense forestry activities in the region. This is referred as apparent competition (St-Laurent et al. 2009; Boisjoly, Ouellet & Courtois 2010).
Climate change is affecting all of the planet’s ecosystems. Rapid shifts of species range to higher latitudes or elevation are occurring in order to keep pace with changing climate (Loarie et al. 2009; Chen et al. 2011). In eastern North America, boreal forest tree
2
species are likely to be impacted by climate change (Périé et al. 2014). Some southern hardwood species may find better environmental conditions in the future. They may be able to expand their range into more northern latitudes or higher elevations. However, modeling studies suggest that some conifer species common in the boreal region, such as Jack pine (Pinus banksiana), white spruce (Picea glauca), eastern larch (Larix laricina) or balsam fir (Abies balsamea) may suffer significant declines over more than 20% of their current range (Périé et al. 2014).
The concept of protected area networks
Protected areas have been implemented in many parts of the world to counter the loss of biodiversity (Ervin 2003; Coetzee, Gaston & Chown 2014). The IUCN Protected Areas Categories System defines different levels of protection for these areas limiting the human activities permitted inside (Dudley 2008). Single protected areas mostly reduce the threats of habitat change and over-exploitation inside their boundaries. However, they cannot alone solve all the negative impacts of these two threats. For examples, some habitat changes outside protected areas can still modify the ecosystem functions inside them by contamination (Hansen & DeFries 2007). Also, poaching and illegal fishing inside protected areas are hard to control (Agnew et al. 2009). The impacts of climate change, invasive species and pollution on biodiversity are less, or not at all, mitigated by individual protected areas as these threats do not stop at human-delineated boundaries.
A protected area network is a group of single protected areas (i.e., cores of the network) which are functionally connected between each other (Bennett & Mulongoy 2006; Ervin et al. 2010). Functional connectivity is “the degree to which the landscape facilitates or impedes movement among resource patches” (Taylor et al. 1993), as perceived by a particular species or population (Baguette & Van Dyck 2007; Kadoya 2009). The enhancement of functional connectivity in landscapes is beneficial for species conservation (Bennett 2003; Rudnick et al. 2012), particularly when enhanced between protected areas (Bennett & Mulongoy 2006; Andrello et al. 2014). High functional connectivity allows individual movement or dispersal between protected areas. It increases the effective protected surface available for an individual or a population (Di Minin et al. 2013). A
3
connected protected area network can help counter the negative impacts from habitat change and over-exploitation that cannot be solved within single protected areas. For example, strong connectivity between protected areas can help reduce the impacts of land use contamination from outside, as individuals are more able to travel further to find resources and avoid disturbances (Bennett & Mulongoy 2006). Connectivity could also help reduce poaching as animals could have better access to refuges. Protected area networks could also decrease accessibility by poachers if landscape fragmentation due to trails and road networks is reduced (Linkie et al. 2006). A connected network of protected areas can also help species better cope with climate change and reduce invasive species impacts. Climate change disturbs environmental conditions (Loarie et al. 2009) and therefore resource distribution, potentially driving some species out of the protected areas where they currently live (Araújo et al. 2004). Populations moving to follow their optimal environmental conditions (Chen et al. 2011) could still remain partly protected if they can easily move from one protected area to another through a connected network. Functional connectivity is enhanced in the protected area network for some particular species. If invasive species have different needs (e.g., open vs closed areas), suitably designed networks could delay the spread of these species while favoring the sustainability of the focal ones (Bakker & Wilson 2004).
Protected area networks can decrease the rate at which species are going extinct (Geldmann et al. 2013; Andrello et al. 2014). However, the protection they provide is limited to certain biodiversity threats and is ineffective for most of the species living outside of their boundaries. Protected area networks are part of the solution to counter biodiversity loss but they cannot solve it alone. A global conservation effort is required, including a better management of the surrounding matrix (i.e., outside of the networks) (Ervin et al. 2010; Hansen et al. 2011; Lesmerises et al. 2013), as well as actions aimed towards reducing the causes of biodiversity decline (Secretariat of the Convention on Biological Diversity 2006).
4
Building effective protected area networks
There are many approaches to designing protected areas systems so that they form a cohesive, functionally connected network which would be effective, currently and in the future, at protecting the biodiversity in a defined region (Heller & Zavaleta 2009). Here, I present a three-step method: 1) defining the current and future environmental conditions in the focal region taking into account projected climate change; 2) defining the movements for the focal species which require(s) protection, for the same time periods as the environmental conditions; 3) defining a set of protected areas to create a network that achieves ecological representativeness and functional connectivity for the focal species, now and under projected future conditions.
Understanding the current state of the regional landscape requires defining the current climate, vegetation and terrain conditions (e.g., elevation, cover types). This is usually done by remote sensing and data can be obtained from research and governmental agencies (e.g., Hijmans et al. 2005; Dupigny-Giroux et al. 2007; Xie, Sha & Yu 2008). To define the future environmental conditions in a context of climate change, scenarios and models are required. The Intergovernmental Panel on Climate Change (IPCC 2007) established various climate scenarios which lead to predicted future climates (Randall et al. 2007). Given climate, future vegetation can be predicted in several ways. For example, bioclimatic envelope models are fit from empirical data to describe the realized niche of a target species. The species’ future distribution is then projected using the future climate predicted and the current species-climate relationship (Heikkinen et al. 2006). These models assume a consistency over time of the observed species-climate relationship (equilibrium assumption), as well as a strong adaptive capacity of the species to the new environmental conditions (Araújo & Peterson 2012). Individual-based models are more mechanistic. They can define the potential location of a population based on its life cycle and different types of interactions, such as with climate, landscape conditions, or with other species (e.g., Wiegand et al. 2006). While complex mechanistic models require more data and knowledge about the species ecology than species distribution models, they can overcome empirical model limitations by adapting the species behavior to different environmental conditions.
5
Focal species movement through time needs to be described to account for functional connectivity between the protected areas. First, the choice of the focal species needs to accord with regional conservation needs. The focal species needs to be either of high importance for conservation (e.g., high cultural value, important for ecological processes) or an umbrella species (Roberge & Angelstam 2004; Baldwin et al. 2010). Movement pattern of the focal population can be modelled from telemetry data (e.g., VHF or GPS collars) or field observations (Movebank 2015). Not all individuals can be monitored at all times; thus models must be developed from the observation data. There are many kinds of movement models (Turchin 1998). The choice depends, among other things, on the population movement assumptions, the data available and the goal of the study. If the movement models include climatic or climate-dependent variables (e.g., vegetation cover), it is then possible to predict potential future movement of populations by inserting the variable predicted value under climate change (e.g., Lawler et al. 2013).
Protected area networks need to preserve a representative set of the regional biodiversity. Protecting most of the undisturbed habitat types according to their original proportions in the landscape is expected to protect the majority of the regional biodiversity (Hunter 1991; Dudley & Parish 2006). To be robust to climate change, and ensure protection over time, landscape changes need to be planned for in advance (Hannah et al. 2007). While protected areas should maximize ecological representativeness over time, they should also be located in a way that the focal species can easily move from one area to another, considering its current movement patterns and the predicted ones for the future (Nuñez et al. 2013; Andrello et al. 2014).
Case study: the Gaspésie peninsula
The present thesis was originated as part of a bigger project initiated by the Québec government. It aimed to adapt the design and the management of the protected area networks in Québec to climate change (Bélanger et al. 2013). Two study areas were identified because of their ecological challenges regarding climate change: one of which is my study area, the natural region of the Gaspésie peninsula (MDDELCC 2014).
6
The natural region of the Gaspésie covers about 25,000 km² at the tip of the Gaspésie peninsula. Most of the area, except for the coasts, belongs to the balsam fir - white birch bioclimatic domain (Saucier et al. 2003). It is a mountainous area with open alpine tundra on mountain tops mostly maintained by wind (Renard, Isabel & McIntire 2015). The tundra may be threatened by vegetation colonization due to climate change (Logan 2012; Dumais et al. 2014); though there is also some evidence that it may not change (Renard, McIntire & Fajardo 2015). The main natural disturbance in the region is spruce budworm outbreaks (Choristoneura fumiferana). Future spruce budworm impacts could be less important than they are currently since spruce budworm growth rate is predicted to decrease with climate change (Gray 2008; Régnière, St-Amant & Duval 2012). A large portion of the Gaspésie is public land. Forestry activities, with their associated road network, are the main human disturbances in the area (MDDELCC 2014).
Currently, the existing protected areas cover 5.5% of the region (Fig. 3.1). Most of these areas are small but the biggest protected area, the Gaspésie National Park, covers 802 km² (LeSage & Paquin 2000). This park helps the conservation of several endangered species among which are two endemic taxa, the Atlantic-Gaspésie caribou population and the green-scaled willow (Salix chlorolepis) (MDDELCC 2014). A gap analysis of the current network showed that several environmental features were poorly represented in the existing protected areas (MDDELCC 2014). The Québec government aims to protect 12% of its territory (Brassard et al. 2010). The “Comité sur les aires protégées terrestres de la Gaspésie” (Ministère du Développement Durable, de l'Environnement et de la Lutte contre les Changements Climatiques du Québec, MDDELCC) proposed a scenario of new protected areas (Fig. 3.1), which when associated with the existing ones, would protect a total of 12.3% in the natural region of the Gaspésie peninsula (MDDELCC 2014).
Focal population: the Atlantic-Gaspésie caribou
The Atlantic-Gaspésie caribou was used as the focal population for measuring functional connectivity of protected area networks. This caribou population belongs to the mountain ecotype (COSEWIC 2011) of the woodland caribou subspecies (Banfield 1961). In 1850, the southern limit of the caribou range went as south as Vermont, USA (Courtois et al.
7
2003). The caribou range has shrunk over time and now the Atlantic-Gaspésie population is the last one surviving south of the St. Lawrence River. The population mostly occupies the Gaspésie National Park (Mosnier et al. 2003; Lalonde 2015). Population surveys began in the 1980s and estimated the population to be around 200 (Fournier & Faubert 2001). The population has declined continually since then. The last survey in 2015 estimated the herd size of around 100 individuals (Lalonde 2015). The population was identified as a Designatable Unit for the caribou species in Canada (COSEWIC 2011) and it is listed as endangered since 2000 (Environment Canada 2015).
The Atlantic-Gaspésie caribou is mostly threatened by human disturbances. The proximate cause of the population decline is predation, mostly by coyotes (Canis latrans) which first appeared in the Gaspésie National Park in the early 1980s, and black bears (Ursus americanus) (Crête & Desrosiers 1995). The predation pressure is driven by apparent competition due to a large abundance of alternative prey, mostly moose (Alces
americanus), which can sustain large predator populations. These alternate prey species are
themselves sustained by the large areas of young forests produced by forestry activities which seem the ultimate cause of caribou decline (St-Laurent et al. 2009; Boisjoly, Ouellet & Courtois 2010). Forestry activities also decrease the area of mature fir forests on which caribou rely during winter to feed on arboreal lichen (Mosnier et al. 2003). Aside from habitat change, climate change may become a threat to this population in the future. Indeed, the population inhabits the alpine tundra in the Gaspésie National Park and relies on fir stands (Mosnier et al. 2003), two ecosystems potentially threatened by climate change (Loarie et al. 2009; Périé et al. 2014; Dumais et al. 2014).
The future of the Atlantic-Gaspésie caribou population is at risk due to its long-term consistent population decline and its uniqueness, making it a primary target for conservation measures. This population is also sensitive to human disturbances and is therefore a good indicator of the health of the ecosystems in Gaspésie. I assumed that conservation measures directed towards the caribou population would also protect the other local species affected by the same disturbances or sharing the same habitat preferences, making the Atltantic-Gaspésie caribou a potential umbrella species (Bichet 2014) and therefore a relevant focal species.
8
Thesis outline
The aim of this thesis is to propose a methodology to define effective protected area networks by integrating functional connectivity and climate change into their design. This thesis is composed of three chapters.
The first chapter shows that sparse data, when used with individual-based models and pattern-oriented modeling, can be sufficient to understand and simulate potential animal movement. I modeled Atlantic-Gaspésie caribou movement using sparse VHF telemetry data available for this population. I parameterized individual-based models that included environmental and intrinsic variables with a pattern-oriented modeling strategy to reproduce the movement patterns from telemetry data. Then, I simulated caribou movement to define the potential landscape use of the Gaspésie region by the caribou.
In the second chapter, I show that decreasing movement barriers through road restoration can mitigate the predicted loss of movement potential for caribou under climate change. It was beyond the scope of this project to build robust vegetation-landscape models to predict the potential future state of the environmental conditions in Gaspésie. Therefore, I built possible future landscapes under various climate change scenarios from the literature. I included in these scenarios the outcomes of alternate conservation activities including new protected areas and road restoration. I used the individual-based model from the first chapter to predict the movements of the Atlantic-Gaspésie caribou in the scenario created landscapes. I estimated the caribou movement potential by comparing the movement model outputs to those produced by a null model, defined as a random walk in a homogeneous landscape. Scenarios with road restoration inside the protected areas led to an increase of the area of high movement potential for caribou, compensating for losses induced by climate change.
In the third chapter I present a strategy for designing effective protected area networks and illustrate it for the Gaspésie region. I built multiple protected area networks and quantified the degrees to which they achieved current ecological representativeness and functional connectivity over time. I could not measure ecological representativeness over
9
time as no models were available to predict detailed landscapes under climate change. I used the methodology and results of the second chapter to measure network functional connectivity over time using estimates of caribou movement potential. I used quantile-based criteria to select the optimal protected area network scenario that simultaneously achieved high degrees of ecological representativeness and functional connectivity. I also compared the performances of the network proposed by the government with the networks I created.
10
References
Agnew, D.J., Pearce, J., Pramod, G., Peatman, T., Watson, R., Beddington, J.R. & Pitcher, T.J. (2009) Estimating the worldwide extent of illegal fishing. PLoS ONE, 4, e4570. Andrello, M., Jacobi, M.N., Manel, S., Thuiller, W. & Mouillot, D. (2014) Extending
networks of protected areas to optimize connectivity and population growth rate.
Ecography, 35, 001–010.
Araújo, M.B., Cabeza, M., Thuiller, W., Hannah, L. & Williams, P.H. (2004) Would climate change drive species out of reserves? An assessment of existing reserve-selection methods. Global Change Biology, 10, 1618–1626.
Araújo, M.B. & Peterson, A.T. (2012) Uses and misuses of bioclimatic envelope modeling.
Ecology, 93, 1527–1539.
Baguette, M. & Van Dyck, H. (2007) Landscape connectivity and animal behavior: functional grain as a key determinant for dispersal. Landscape Ecology, 22, 1117– 1129.
Bakker, J.D. & Wilson, S.D. (2004) Using ecological restoration to constrain biological invasion. Journal of Applied Ecology, 41, 1058–1064.
Baldwin, R.F., Perkl, R.M., Trombulak, S.C. & Burwell III, W.B. (2010) Modeling ecoregional connectivity. Landscape-scale conservation planning, 1st ed (eds S.C. Trombulak), & R.F. Baldwin), pp. 349–367. Springer Netherlands, Dordrecht.
Banfield, A.W.F. (1961) A Revision of the Reindeer and Caribou Genus Rangifer. Department of Northern Affairs and National Resources, Ottawa, ON.
Bélanger, L., Berteaux, D., Bouthiliier, L., Brassard, F., Casajus, N., Cummings, S., David, V., Denoncourt, A., Deshaies, M.-È., Desmarais, M.-È., Domaine, É., Jutras, S., Lamarre, J.-F., Marchal, J., Mcintire, E., Ricard, M., St-Laurent, M.-H. & Tremblay, J.-P. (2013) Adaptation Aux Changements Climatiques Du Design et de La Gestion
Du Réseau D’aires Protégées Au Québec. Montréal, QC.
Bennett, A.F. (2003) Linkages in the Landscape: The Role of Corridors and Connectivity in
Wildlife Conservation. Gland, Switzerland; Cambridge, UK.
Bennett, G. & Mulongoy, K.J. (2006) Review of Experience with Ecological Networks,
Corridors and Buffer Zones. Montréal, QC.
Bichet, O. (2014) L’aménagement de l’habitat du caribou forestier permet-il la
conservation de la biodiversité? Université Laval.
Boisjoly, D., Ouellet, J.-P. & Courtois, R. (2010) Coyote habitat selection and management implications for the Gaspésie caribou. Journal of Wildlife Management, 74, 3–11. Brassard, F., Bouchard, A.R., Boisjoly, D., Poisson, F., Bazoge, A., Bouchard, M.-A.,
Lavoie, G., Tardif, B., Bergeron, M., Perron, J., Balej, R. & Blais, D. (2010) Portrait
Du Réseau D’aires Protégées Au Québec.
Ceballos, G., Ehrlich, P.R., Barnosky, A.D., García, A., Pringle, R.M. & Palmer, T.M. (2015) Accelerated modern human-induced species losses: Entering the sixth mass
11 extinction. Sciences Advances, 1, 1–5.
Chen, I.-C., Hill, J.K., Ohlemüller, R., Roy, D.B. & Thomas, C.D. (2011) Rapid range shifts of species associated with high levels of climate warming. Science, 333, 1024– 1026.
Coetzee, B.W.T., Gaston, K.J. & Chown, S.L. (2014) Local scale comparisons of biodiversity as a test for global protected area ecological performance: a meta-analysis. PLoS ONE, 9, e105824.
COSEWIC. (2011) Designatable Units for Caribou (Rangifer Tarandus) in Canada. Ottawa, ON.
Courtois, R., Ouellet, J.-P., Gingras, A., Dussault, C., Breton, L. & Maltais, J. (2003) Historical changes and current distribution of caribou, Rangifer tarandus, in Quebec.
The Canadian Field-Naturalist, 117, 399–414.
Crête, M. & Desrosiers, A. (1995) Range expansion of coyotes, Canis latrans, threatens a remnant herd of caribou, Rangifer tarandus, in southeastern Québec. The Canadian
Field-Naturalist, 109, 227–235.
Dudley, N. (2008) Guidelines for Applying Protected Area Management Categories. Iucn, Gland, Switzerland.
Dudley, N. & Parish, J. (2006) Closing the Gap. Creating Ecologically Representative
Protected Area Systems: A Guide to Conducting the Gap Assessments of Protected Area Systems for the Convention on Biological Diversity. Montréal, QC.
Dumais, C., Ropars, P., Denis, M.-P., Dufour-Tremblay, G. & Boudreau, S. (2014) Are low altitude alpine tundra ecosystems under threat? A case study from the Parc National de la Gaspésie, Québec. Environmental Research Letters, 9, 094001.
Dupigny-Giroux, L.-A., Ross, T.F., Elms, J.D., Truesdell, R. & Doty, S.R. (2007) NOAA’S climate database modernization program: Rescuing, archiving, and digitizing history.
Bulletin of the American Meteorological Society, 88, 1015–1017.
Environment Canada. (2015) Species at Risk Public Registry, http://www.registrelep.gc.ca/.
Ervin, J. (2003) Protected area assessments in perspective. BioScience, 53, 819–822.
Ervin, J., Mulongoy, K.J., Lawrence, K., Game, E.T., Sheppard, D., Bridgewater, P., Bennett, G., Gidda, S.B. & Bos, P. (2010) Making Protected Areas Relevant: A Guide
to Integrating Protected Areas into Wider Landscapes, Seascapes and Sectoral Plans and Strategies. Montréal, Canada.
Festa-Bianchet, M., Ray, J.C., Boutin, S., Côté, S.D. & Gunn, A. (2011) Conservation of caribou (Rangifer tarandus) in Canada: an uncertain future. Canadian Journal of
Zoology, 89, 419–434.
Fournier, N. & Faubert, R. (2001) Évaluation Du Troupeau de Caribous de La Gaspésie. Direction de l’aménagement de la faune de la région de la Gaspésie-Iles-de-la-Madeleine.
12
Effectiveness of terrestrial protected areas in reducing habitat loss and population declines. Biological Conservation, 161, 230–238.
Gray, D.R. (2008) The relationship between climate and outbreak characteristics of the spruce budworm in eastern Canada. Climatic Change, 87, 361–383.
Hannah, L., Midgley, G., Andelman, S.J., Araújo, M.B., Hughes, G., Martinez-Meyer, E., Pearson, R. & Williams, P.H. (2007) Protected area needs in a changing climate.
Frontiers in Ecology and the Environment, 5, 131–138.
Hansen, A.J., Davis, C.R., Piekielek, N., Gross, J., Theobald, D.M., Goetz, S., Melton, F. & DeFries, R. (2011) Delineating the ecosystems containing protected areas for monitoring and management. BioScience, 61, 363–373.
Hansen, A.J. & DeFries, R. (2007) Ecological mechanisms linking protected areas to surrounding lands. Ecological Applications, 17, 974–988.
Heikkinen, R.K., Luoto, M., Araújo, M.B., Virkkala, R., Thuiller, W. & Sykes, M.T. (2006) Methods and uncertainties in bioclimatic envelope modelling under climate change. Progress in Physical Geography, 30, 751–777.
Heller, N.E. & Zavaleta, E.S. (2009) Biodiversity management in the face of climate change: A review of 22 years of recommendations. Biological Conservation, 142, 14– 32.
Hijmans, R.J., Cameron, S.E., Parra, J.L., Jones, P.G. & Jarvis, A. (2005) Very high resolution interpolated climate surfaces for global land areas. International Journal of
Climatology, 25, 1965–1978.
Hunter, M.L. (1991) Coping with ignorance: The coarse filter strategy for maintaining biodiversity. Balancing on the Brink of Extinction (ed K.A. Kohm), pp. 266–281. Island press, Washington, D.C.
IPCC. (2007) Fourth Assessment Report (AR4) of the United Nations Intergovernmental
Panel on Climate Change. Cambridge, UK; New-York, USA.
Kadoya, T. (2009) Assessing functional connectivity using empirical data. Population
Ecology, 51, 5–15.
Lalonde, M. (2015) Inventaire Aérien de La Population de Caribou de La Gaspésie
(Rangifer Tarandus Caribou), Automne 2014. Caplan, QC.
Lawler, J.J., Ruesch, A.S., Olden, J.D. & McRae, B.H. (2013) Projected climate-driven faunal movement routes. Ecology Letters, 16, 1014–1022.
Leclerc, M., Dussault, C. & St-Laurent, M.-H. (2014) Behavioural strategies towards human disturbances explain individual performance in woodland caribou. Oecologia,
176, 297–306.
LeSage, L. & Paquin, P. (2000) Historique, géographie physique et biogéographie du Parc de conservation de la Gaspésie, Québec. Proceedings of the Entomological Society of
Ontario, 131, 17–66.
Lesmerises, R., Ouellet, J.-P., Dussault, C. & St-Laurent, M.-H. (2013) The influence of landscape matrix on isolated patch use by wide-ranging animals: conservation lessons
13 for woodland caribou. Ecology and Evolution.
Linkie, M., Chapron, G., Martyr, D.J., Holden, J. & Leader-Williams, N. (2006) Assessing the viability of tiger subpopulations in a fragmented landscape. Journal of Applied
Ecology, 43, 576–586.
Loarie, S.R., Duffy, P.B., Hamilton, H., Asner, G.P., Field, C.B. & Ackerly, D.D. (2009) The velocity of climate change. Nature, 462, 1052–1055.
Logan, T. (2012) Scénarios Climatiques Pour Les Régions Naturelles de La Péninsule de
La Gaspésie et La Dépression de La Tuque. Québec, QC.
Losier, C.L., Couturier, S., St-Laurent, M.-H., Drapeau, P., Dussault, C., Rudolph, T., Brodeur, V., Merkle, J.A. & Fortin, D. (2015) Adjustments in habitat selection to changing availability induce fitness costs for a threatened ungulate. Journal of Applied
Ecology, 52, 496–504.
MDDELCC. (2014) Portrait Du Réseau D’aires Protégées Au Québec - Analyse de
Carence écorégionale, Gaspésie (Terrestre).
Millennium Ecosystem Assessment. (2005) Ecosystems and Human Well-Being:
Biodiversity Synthesis. Washington, D.C.
Di Minin, E., Hunter, L.T.B., Balme, G.A., Smith, R.J., Goodman, P.S. & Slotow, R. (2013) Creating larger and better connected protected areas enhances the persistence of big game species in the Maputaland-Pondoland-Albany biodiversity hotspot. PLoS
ONE, 8, e71788.
Mosnier, A., Ouellet, J., Sirois, L. & Fournier, N. (2003) Habitat selection and home-range dynamics of the Gaspé caribou: a hierarchical analysis. Canadian Journal of Zoology,
81, 1174–1184.
Movebank. (2015) https://www.movebank.org/.
Nuñez, T.A., Lawler, J.J., McRae, B.H., Pierce, D.J., Krosby, M.B., Kavanagh, D.M., Singleton, P.H. & Tewksbury, J.J. (2013) Connectivity planning to address climate change. Conservation Biology, 27, 407–416.
Pereira, H.M., Leadley, P.W., Proença, V., Alkemade, R., Scharlemann, J.P.W., Fernandez-Manjarrés, J.F., Araújo, M.B., Balvanera, P., Biggs, R., Cheung, W.W.L., Chini, L., Cooper, H.D., Gilman, E.L., Guénette, S., Hurtt, G.C., Huntington, H.P., Mace, G.M., Oberdorff, T., Revenga, C., Rodrigues, P., Scholes, R.J., Sumaila, U.R. & Walpole, M. (2010) Scenarios for global biodiversity in the 21st century. Science, 330, 1496– 1501.
Périé, C., de Blois, S., Lambert, M.-C. & Casajus, N. (2014) Effets Anticipés Des
Changements Climatiques Sur L’habitat Des Espèces Arborescentes Au Québec.
Québec, QC.
Randall, D.A., Wood, R.A., Bony, S., Colman, R., Fichefet, T., Fyfe, J., Kattsov, V., Pitman, A., Shukla, J., Srinivasan, J., Stouffer, R.J., Sumi, A. & Taylor, K.E. (2007) Climate models and their evaluation. Climate change 2007: The physical science
basis. Contribution of working group I to the Four Asssessment Report of the Integovernmental Panel on Climate Change (eds S. Solomon, D. Quin, M. Manning,
14
Z. Chen, M. Marquis, K.B. Averyt, M. Tignor, & H.L. Miller), pp. 579–662. Cambridge University Press, Cambridge, UK; New-York, USA.
Régnière, J., St-Amant, R. & Duval, P. (2012) Predicting insect distributions under climate change from physiological responses: spruce budworm as an example. Biological
Invasions, 14, 1571–1586.
Renard, S.M., Isabel, C. & McIntire, E.J.B. (2015) Le vent, un facteur déterminant pour le maintien de la toundra alpine. Bulletin de conservation, 27–30.
Renard, S.M., McIntire, E.J.B. & Fajardo, A. (2015) Winter conditions – not summer temperature – influence establishment of seedlings at white spruce alpine treeline in Eastern Quebec. Journal of Vegetation Science, in press.
Roberge, J.-M. & Angelstam, P. (2004) Usefulness of the umbrella species concept as a conservation tool. Conservation Biology, 18, 76–85.
Rudnick, D.A., Ryan, S.J., Beier, P., Cushman, S.A., Dieffenbach, F., Epps, C.W., Gerber, L.R., Hartter, J., Jenness, J.S., Kintsch, J., Merenlender, A.M., Perkl, R.M., Preziosi, D. V. & Trombulak, S.C. (2012) The role of landscape connectivity in planning and implementing conservation and restoration priorities. Issues in Ecology, 16, 1–21. Saucier, J.-P., Grondin, P., Robitaille, A. & Bergeron, J.-F. (2003) Zones de végétation et
les domaines bioclimatiques du Québec.
Secretariat of the Convention on Biological Diversity. (2006) Global Biodiversity Outlook
2. Montréal, QC.
St-Laurent, M.-H., Ouellet, J.-P., Mosnier, A., Boisjoly, D. & Courtois, R. (2009) Le parc national de la Gaspésie est-il un outil de conservation efficace pour maintenir une population menacée de caribou ? Le Naturaliste Canadien, 133, 6–14.
Taylor, P.D., Fahrig, L., Henein, K. & Merriam, G. (1993) Connectivity is a vital element of landscape structure. Oikos, 68, 571–572.
Turchin, P. (1998) Quantitative Analysis of Movement. Sinaeur Associates, Sunderland, MA.
Vors, L.S. & Boyce, M.S. (2009) Global declines of caribou and reindeer. Global Change
Biology, 15, 2626–2633.
Wiegand, T., Camarero, J.J., Rüger, N. & Gutiérrez, E. (2006) Abrupt population changes in treeline ecotones along smooth gradients. Journal of Ecology, 94, 880–892.
Xie, Y., Sha, Z. & Yu, M. (2008) Remote sensing imagery in vegetation mapping: a review. Journal of Plant Ecology, 1, 9–23.
15
Chapter 1 : Overcoming challenges of sparse telemetry data to
estimate caribou movement
16
Résumé
Les modèles individu-centré spatialement explicites peuvent reproduire le mouvement des espèces. Lorsqu’ils sont couplés avec une modélisation patron-orienté, ils peuvent être paramétrés et évaluer différentes hypothèses de mouvement en comparant leurs résultats avec les patrons des données de mouvement. Nous l’avons illustré en utilisant les données VHF (« Very High Frequency ») éparses de la population en voie de disparition de caribou de la Gaspésie-Atlantique. Notre meilleur modèle a pu reproduire avec succès la plupart des patrons de mouvement dérivés des localisations VHF. Nous avons utilisé le modèle pour estimer et cartographier l’utilisation potentielle du paysage par le caribou. Nous avons conclu que les données éparses, comme les localisations VHF, peuvent être utilisées pour ajuster des modèles de mouvement dont les paramètres ne peuvent pas être estimés directement des données observées. Ces modèles peuvent s’avérer utiles dans la gestion du paysage afin d’identifier les régions où développer des stratégies de conservation pour assurer la persistance de populations menacées.
17
Abstract
Spatially explicit individual-based models (SE-IBMs) can simulate species’ movement behaviors. Coupled with a pattern-oriented modeling strategy, SE-IBMs can be parameterized and assess alternate hypotheses on movement behaviors by comparing simulated to observed patterns of movement. We illustrated this with the endangered Atlantic-Gaspésie caribou population while using sparse Very High Frequency (VHF) telemetry data. The best fitted model we built successfully reproduced most of the movement patterns derived from the VHF locations. We used the model to estimate and map potential landscape use by the Atlantic-Gaspésie caribou. We concluded that sparse data sets, such as VHF collar locations, can be used to fit movement models whose parameters could not be estimated directly from the data. SE-IBMs coupled with pattern-oriented modeling can reveal new insights about landscape use and can identify habitat locations where management actions could be taken to facilitate persistence or recovery of endangered populations.