DO FIRMS MANAGE NOMINAL STOCK PRICES FOR THEIR EMPLOYEES?
Timothée WAXIN♦♦♦♦
Université Paris-Dauphine, DRM This version: April 20, 2011
Abstract
We investigate the link between employee ownership and price levels of stocks. Using a comprehensive sample of firms in the Société des Bourses Françaises (SBF) 120 Index from 2000 to 2007, we document a negative correlation between share price levels and employee ownership. This suggests that employee shareholders might prefer lower-priced stocks as they tend to be wealth constrained and cannot afford to buy a firm’s stock if the price is too high. We also examine the link between employee ownership and the likelihood that a firm splits its stock. Our results show that the presence of employee ownership within the firm encourages stock split behavior. We conclude that employee ownership is predominant in firms which manage their stock prices and thus have attractive shares.
JEL classification: G14, G30, G32
Key words: Stock prices, Stock splits, Employee ownership
♦ Ph.D. Candidate, please address correspondence to: Université Paris-Dauphine, DRM Finance, Place du Maréchal de Lattre de Tassigny, 75775 Paris Cedex 16. Tel: + 33 1 44 05 42 27 - Fax: + 33 1 44 05 40 23 - E-mail: Timothee.Waxin@dauphine.fr. This paper is part of a doctoral research conducted under the supervision of Professor Edith Ginglinger. I thank participants in the 2011 Eastern Finance Association conference, Savannah, United States (April 2011). The financial support of the Fédération Bancaire Française Chair in Corporate Finance is gratefully acknowledged. All remaining errors are my own responsibility.
1. Introduction
Stock splits remain a common managerial decision (Mukherji, et al. (1997), Dyl and Elliott (2006) and Weld, et al. (2009)) and have received strong interest in the literature (Easley, et al., 2001).1 Concurrently, employee ownership is an important economic phenomenon and shows an increasing long-term trend (Kim and Ouimet (2009) for the U.S. case, Ginglinger, et al. (2011) for the French case). The aim of the paper is to show a preference of employee-shareholders for low-priced stocks and therefore firms which manage their stock prices as these shareholders tend to be wealth constrained and cannot afford to buy a firm’s stock if the price is too high.
In this paper, we focus on the French case. France is a country with a dynamic employee share ownership policy. In several large French listed companies, employees are the first or second largest shareholder of the firm.2 The 2007 Annual Economic Survey of Employee Ownership in European Countries conducted by the European Federation of Employee Share Ownership3 reveals that compared to other European countries, France is clearly number one for employee ownership regarding the criteria of the fraction of shares held by employees and the fraction of large companies having broad-based employee share plans. There has been a general promotion of employee ownership in France. Governments have proposed major changes to encourage employee share ownership. Moreover, Euronext and the Fédération Française des Associations d’Actionnaires Salariés et d’Anciens Salariés (FAS) launched the first employee shareholding index in the world in December 2006. The Euronext FAS IAS index is composed of all SBF 250 firms having a significant percentage of employee ownership (defined as at least 3% of the company’s shares being owned by more than one-fourth of the employees).4
Why do firms tend to develop employee ownership? Academic literature distinguishes two main motivations for firms to develop employee share ownership. First, employee ownership is a means to motivate employees and improve firm performance thanks to a convergence of financial interests with employees. According to Kim and Ouimet (2009), small ESOPs (Employee Stock Ownership Plans) defined as those controlling less than 5% of
1 A stock split is a corporate event defined as an increase in the number of outstanding shares of a firm without changing the shareholders’ equity. For instance, a two-for-one stock split involves replacing every outstanding share with two. The only effect if to halve the nominal prices of the shares.
2
For instance, employees were the largest shareholder of Groupe Steria in 2007 with a stake of 12.88% of outstanding shares and approximately the same fraction of voting rights, the second largest shareholder in Sagem (20.31%), Eiffage (20.20%), Bouygues (18.30%), Air France-KLM (11.00%) (sources: reference documents). 3 See http://www.efesonline.org/.
4
outstanding shares, increase both productivity and firm value. Ginglinger, et al. (2011) also show that moderate levels of employee ownership increase firm value and profitability of French listed firms.
Employee ownership is also seen in the literature as a tool for managers to reduce takeover threat of the firm. New shares give immediate voting rights to employees rebalancing effectively the ownership structure of the firm. Chaplinsky and Niehaus (1994) and Beatty (1995) show that firms with ESOPs are less likely to be taken over. Pagano and Volpin (2005) argue that these firms have more stable management.
We link motivations to develop employee ownership to those to keep low stock prices and to split stocks. There have been several explanations for why firms split their stock. According to the signal hypothesis, stock splits inform investors of substantial future returns (Grinblatt, et al. (1984), Brennan and Copeland (1988)) and are used by undervalued firms to attract the attention of analysts (Grinblatt, et al. (1984), Brennan and Hughes (1991)). The market maker hypothesis predicts that companies use stock splits to obtain an optimal tick size. A stock split increases the relative bid-ask spread and a larger tick size will result in more profitable market making, providing brokers with more incentives to promote the stock (Schultz, 2000). More recently, Weld, et al. (2009) argue that keeping the prices of shares in the same range is the result of firms following traditions and norms. Baker, et al. (2009) suggest a catering theory of nominal share prices which posits that when investors place higher valuations on low-priced firms, managers respond by supplying shares at lower price levels.
We mainly focus on the two following explanations of stock splits. First, the optimal trading range hypothesis (Copeland (1979), Baker and Gallagher (1980), Lakonishok and Lev (1987), Dyl and Elliott (2005)) states that small investors are less likely than institutions to buy high-priced stocks.5 Under this hypothesis, if firms want to have employee ownership, they will be more likely to enact a stock split in order to lower their stock prices as employees have limited financial resources.
A second motivation is that stock splits may serve entrenched managers (managerial entrenchment hypothesis). Managers concerned with a takeover threat are more likely to carry out stock splits in order to have a broad and heterogeneous shareholder base (Lakonishok and
5 Splitting stock to attract new shareholders is a common motive for firms. For instance, on May 10, 2007, the Vinci Annual General Meeting of shareholders approved a division by two of the nominal value of the company’s shares. The French concession and construction company which had, at the time of the stock split, an employee ownership of 8.20% mentioned in a press release: “This transaction will increase the market liquidity of the shares and improve access to them for new shareholders, and particularly individual private shareholders” (Vinci press release, Two-for-one share split, May 2007).
Lev (1987) and Mukherji, et al. (1997)). Takeovers will become more difficult with an increase in the percentage of individual shareholders and the total number of shareholders.
We first explore the relation between share prices and the level of employee ownership. We also investigate the link between employee ownership and the likelihood that a firm splits its stock.
Using a comprehensive sample of firms in the Société des Bourses Françaises (SBF) 120 Index from 2000 to 20076, we find a negative correlation between share price and employee ownership. This result suggests that employee shareholders might prefer lower-priced stocks as they tend to be wealth constrained and cannot afford to buy a firm’s stock if the price is too high. Furthermore, our investigation indicates that the presence of employee ownership within the firm encourages stock split behavior. We conduct a series of robustness checks and find that our results are robust to various alternative specifications, subsample analyses and control for endogeneity. Overall, our findings suggest that employee ownership is predominant in firms which manage their stock prices.
The paper proceeds as follows. We first review in Section 2 the motives for firms to split their stocks as well as to develop employee ownership discussed in the literature and present our testable hypotheses. In Section 3, we present the empirical methodology and variables used in our tests. We describe our sample and data in Section 4. In Section 5, we investigate the link between employee ownership, share prices and stock splits. We provide robustness tests in Section 6. Conclusions follow in Section 7.
2. Institutional background, literature and testable hypotheses
2.1. Employee ownership in France: institutional background
Employee ownership can take four different forms in French listed companies. In the first form called direct employee ownership, employees can individually buy shares at any time at market value and thus become registered individual shareholders of the company. In the indirect employee ownership form of acquisition of firm’s shares, shares are collectively held on behalf of employees after a certain length of employment through an employee trust
6 Companies that form our core sample of firms are all large, highly visible and a lot of them are cross-listed on U.S. and/or European stock markets. Non-French institutional investors (mostly from the U.S. or the U.K.) hold a significant stake of ownership of these firms.
called Fonds Commun de Placement d’Entreprise (FCPE).7 It usually takes place under issuances of shares reserved for employees.8 The firm can contribute to the share ownership scheme under certain limits or discount the price at which employees eventually buy the shares (the most common case is up to 20% of the then market value if shares are kept for five years, up to 30% if shares are kept for ten years) to encourage acquisition of shares by employees. Employees are exempted from tax on employer’s contribution and discount. These amounts are also tax deductible within certain limits for employers. Then, firms can give to employees free shares or stock options. Firms may combine these four methods of acquisition of shares by their employees but the main vehicle for broad-based employee ownership in France is the indirect form via FCPEs.
2.2. Literature review and testable hypotheses
Firms may have incentives to develop employee ownership. Literature has examined the influence of employee ownership on several outcomes. A first set concerns the impact of this ownership on employee motivation, firm productivity and performance. Employee ownership is seen as a tool to increase employee incentives and worker productivity (Jones and Kato (1995), FitzRoy and Kraft (1987), Beatty (1995)). Cramton, et al. (2005) show from a sample of U.S. bargaining data for the period 1970-1995 that ESOPs create incentives for unions to become weaker bargainers. Beatty (1995) mentions that there are also tax benefits for companies which promote employee ownership. Moderate employee ownership is usually associated with better firm performance. Kim and Ouimet (2009) find from a sample of U.S. public firms that adopting employee ownership plans leads to an increase in firm value only when the plan is small (i.e., less than 5%). Ginglinger, et al. (2011) obtain the same result using a sample of French listed firms. Faleye, et al. (2006) show that labor-controlled U.S. publicly traded firms deviate more from value maximization, invest less in long-term assets, take fewer risks, grow more slowly, create fewer new jobs and exhibit lower labor and total
7 Employees hold shares of the FCPE. The FCPE exercises voting rights attached to firm’s shares. The supervisory board of the FCPE is composed of employee-shareholders and company management.
8 “Augmentations de capital réservées aux salariés”. For instance, on December 15, 2006, Veolia Environnement, a French company acting in the field of services related to the environment and having at that time an employee ownership of 1.41%, recorded the completion of a share capital increase reserved for employees of the Company and the Group, which had been approved by the Board of Directors on September 14, 2006. The shares were subscribed for by several employee investment funds acting as intermediaries on behalf of beneficiaries. Following the transaction, 1,931,340 new shares (nominal value €5) were subscribed for at a price of €37.12 each, causing share capital to increase by €9,656,700, representing approximately 0.47% of the Company’s share capital at such date (see the 2006 Veolia reference document).
factor productivity. Then, employee ownership may help firms retain employees as it will be costly for them to leave the company due to the retention period (Oyer and Schaefer, 2005).
A second view of employee ownership is that it decreases the takeover threat of the firm. Employee ownership reduces the occurrence of takeovers and increases the relative bargaining power of the firm vis-à-vis the raider. Employees are likely to vote with management in a takeover contest (Gordon and Pound (1990), Chang and Mayers (1992), Dhillon and Ramirez (1994), Pagano and Volpin (2005)). Firms with employee ownership are less likely to be acquired, taken private or thrust into bankruptcy (Blair, et al., 2000).
Employee ownership is an incentive mechanism which implies an initial decision by employees to buy shares. Investment behaviors of employee-shareholders are specific; they differ from a neoclassical model of investing behavior. Employees may be reluctant to buy firm’s shares as they will suffer from concentration of both their human and financial capital in the firm. Those with limited financial resources and undiversified human capital may prefer to invest outside the firm (Degeorge, et al. (2004), La Bruslerie (2009)). When the company goes bankrupt, employees lose both their jobs and savings. Investors have therefore to balance the risks of losing their income and savings, and the expected benefits of having insiders’ information on the company (Aubert and Rapp, 2010). If firms have incentives to promote employee ownership, we hypothesize that a means to do it is to lower stock prices. Employee-shareholders, as well as individual Employee-shareholders, are wealth constrained investors, so they will be reluctant to buy shares when the price is too high (see, for instance, Degeorge, et al., 2004). It is broadly accepted that firms manage their share prices (Dyl and Elliott, 2006). Weld, et al. (2009) document that the average nominal share prices of common stocks traded on the New York Stock Exchange have remained constant at approximately $35 per share since the Great Depression. Keeping the prices of shares in the same range for 70 years is, according to the authors, the result of firms splitting their stocks. Stock splits remain a popular managerial decision (Mukherji, et al., 1997).
A number of explanations for stock splits have been suggested in the literature. Among them, the optimal trading range hypothesis (see, among others, Copeland (1979) or Baker and Gallagher (1980)) states that managers split firm’s stock to get price into some optimal trading range. Adjusting the price level of the firm’s stock is a motive for stock splits in several studies. For instance, Lakonishok and Lev (1987) or Ikenberry, et al. (1996) find that stock splits are mainly aimed at restoring stock prices to a “normal range”. Managers believe that stock splits will attract individual investors thanks to lower stock prices as they are less likely than institutions to buy high-priced stocks. Using a sample of U.S. firms from
1976 to 2001, Dyl and Elliott (2006) show that firms owned by small investors have lower share prices whereas large and well-known firms have higher share prices. Baker and Gallagher (1980) argue that following a stock split, more of the company’s stock will be purchased by individual investors. Lamoureux and Poon (1987), Maloney and Mulherin (1992) or Mukherji, et al. (1997) find that stock splits result in an increase in the number of individual shareholders. Schultz (2000) documents a large number of small buy orders following splits. The managerial entrenchment hypothesis also suggests that managers concerned with a takeover threat prefer a broad and heterogeneous stockholder base and thus proceed to a stock split (Lakonishok and Lev (1987) and Mukherji, et al. (1997)). However, some studies find a positive relationship between the level of institutional ownership and the likelihood that firms will enact a stock split as institutional investors will benefit from signals of new information, pre-split price increases and improved liquidity (Mason and Shelor, 1998).
As a consequence, firms having an active employee ownership policy may have some interests to keep low stock prices and split their stocks. Employees are wealth constrained and cannot afford to buy high-priced stocks. Stock splits will enable employees to buy shares at a lower price and should therefore be more frequent in firms with employee ownership. Employees will prefer to buy shares at a more affordable price and invest in firms which manage their stock prices. These arguments lead us to the two following hypotheses:
H1: Employee ownership is more prevalent in firms with low-priced stocks.
H2: Employee ownership encourages stock split behavior.
3. Empirical methodology, variables and sources
We first focus on the relation between share prices and the level of employee ownership. Our multivariate analysis consists of a series of regressions to show the robustness of our results. We follow Dyl and Elliott (2006) empirical methodology. The regression equation we employ for our multivariate analysis takes the form:
(Model A) SharePrice = δ0 + δ1EmpOwn + δ2InstOwn + δ3SmallTrades + δ4LargeTrades
+ δ5BVEquity + δ6EPS + δ2000-2006(Year Dummy Variables) + δ1-7(Industry Dummy Variables) + ε
SharePrice is the average price per share of firm’s common stock during the year, where the average annual share price is the average of the daily closing prices. We both use the nominal value and the logarithm of the average share price. Our estimate of the effect of employee ownership defined as the fraction of shares held by all non-management employee-shareholders at the end of the fiscal year (EmpOwn) is δ1 which should be according to our first hypothesis negatively correlated to share price. One of our other independent variables is the level of institutional ownership (InstOwn). Several empirical studies show that institutional holdings are positively correlated to stock prices (Weld, et al. (2009) or De Ridder (2010), for instance). Transaction costs are a function of the number of shares traded, so institutional investors prefer high share prices due to lower brokerage commissions.
One could argue that employee ownership is in our regressions a proxy for the presence in the firm of small investors. In order to distinguish the effect between small investors and employee ownership on stock prices, we include two dummy variables similar to those employed in Shanthikumar (2004): a dummy variable that takes the value of one if the average daily euro trade size over the year is less than €3,000 and zero otherwise (SmallTrades) and a dummy variable that takes the value of one if the average daily euro trade size is at least €30,000 over the year and zero otherwise (LargeTrades). As mentioned before, there is a holding period in France for employee stocks of usually five years. During this period, employees are contractually bound to keep these shares in the plan, so employee stocks are not a motive for transaction. The daily euro trade size (DailyEuroTradeSize) is computed as follows for stock i at day j. We use the same variables as Helfin and Shaw (2005) and divide the daily trading volume (TradingVolume computed as the daily share volume times transaction price) by the total number of trades that the stock experienced (NumberTrades).
∑
= ij n j i j i j i TradingVolume es NumberTrad radeSize DailyEuroT , 1 , , , 1Furthermore, larger and well-known firms should have higher share prices (Weld, et al., 2009). BV Equity is the logarithm of the book value of firm’s equity at the end of the year. We also expect that stock prices of firms whose earnings per share increase may appreciate vis-à-vis the prices of firms whose earnings per share do not increase and thus introduce in the
regressions the firm’s earnings per share during the year (EPS). We then include year dummies to control for the evolution of share prices over time and industry dummies as it could be argued that industry impacts share price (even though, to our knowledge, this has not been documented).
Accounting data are extracted from Worldscope while market data come from Datastream. As there is no electronic database on employee ownership, we manually collect this information from firm’s annual reports which are available on the Autorité des Marchés Financiers (AMF, the French stock exchange regulator) website9, on the Thomson One Banker database or on the Internet websites of individual companies. Institutional ownership comes from Thomson One Banker while we construct the SmallTrades and LargeTrades dummy variables with data from Euronext.
We also examine the link between employee ownership and the likelihood that a firm splits its stock. We also follow the Dyl and Elliott (2006) methodology.
(Model B) StockSplit = ß0 + ß1EmpOwn + ß2InstOwn + ß3SmallTrades + ß4LargeTrades
+ ß5BVEquity + ß6StockApprec + ß2000-2006(Year Dummy Variables) + ß1-7(Industry Dummy Variables) + ε
StockSplit is a dummy variable that takes the value of one if a firm splits its stock during the year and zero otherwise. The estimation of the effect of employee ownership (EmpOwn) on the likelihood that a firm splits its stock is ß1 which should be according to our second hypothesis positively correlated. Based on prior literature, we introduce in our regressions several firm characteristics which have been proven to influence the stock split decision. These variables are the level of institutional ownership (InstOwn), two dummy variables to control for the presence of small and large investors – a first one that takes the value of one if the average trade size is less than €3,000 and zero otherwise (SmallTrades) and a second one that takes the value of one if the average trade size is at least €30,000 and zero otherwise (LargeTrades) – the logarithm of the book value of firm’s equity at the end of the year (BVEquity), year and industry dummy variables and the increase in the firm’s stock price over the two years preceding the year when the firm splits its stock (StockApprec) computed as follows for firm j at year t:
9
1 2 , , , = − − t j t j t j Shareprice Shareprice c StockAppre
We expect institutional ownership to have a negative relationship to the likelihood that firms enact a stock split. About firm size, smaller companies may have more incentives to use stock splits to attract the attention of analysts and shareholders, as argued by Baker and Powell (1993). About stock appreciation, Dyl and Elliott (2006) suggest that stock prices preceding stock splits increase. Industry dummies are included as Asquish, et al. (1989) mention that firms which split their stocks are in industries that perform well. Year dummies control for the evolution of stock split behavior over the time.
As in Dyl and Elliott (2006) and Baker, et al. (2009), we focus on all stock splits of 1.25 to 1 or greater during the period test. Stock split announcements are obtained from Thomson One Banker, Datastream and Factiva while split factors are collected from Datastream, Factiva or annual reports. As noted in Baker, et al. (2009), it is rare for a firm to split more than once in a year. In our sample, we do not have the case of a firm which splits its stock more than once in a year.
In the two models, the δ’s and ß’s are the parameters to be estimated and ε is an error term. As our dependent variable is censored in model A, we use Tobit regressions. In model B, we employ Probit regressions as our dependent variable is a dummy. For each regression, we report the number of observations, the R-squared and the adjusted R-squared in the case of Tobit regressions or the Pseudo R-squared in the case of Probit regressions. Our tables present the coefficients and t-statistics and indicate coefficient significance at the 1%, 5% and 10% levels. All results are corrected for Heteroscedasticity using the White (1980) test.
4. Sample selection and descriptive statistics
Our sample of firms is drawn from the Société des Bourses Françaises (SBF) 120 Index and includes 165 unique firms covering 968 firm-years with available data over the period 2000-2007. The test period includes the stock market expansion period of 2000 and 2001 and the stock market downturn of 2002. The SBF 120 Index regroups the 120 largest companies by market capitalization and by trading volumes on Euronext Paris.
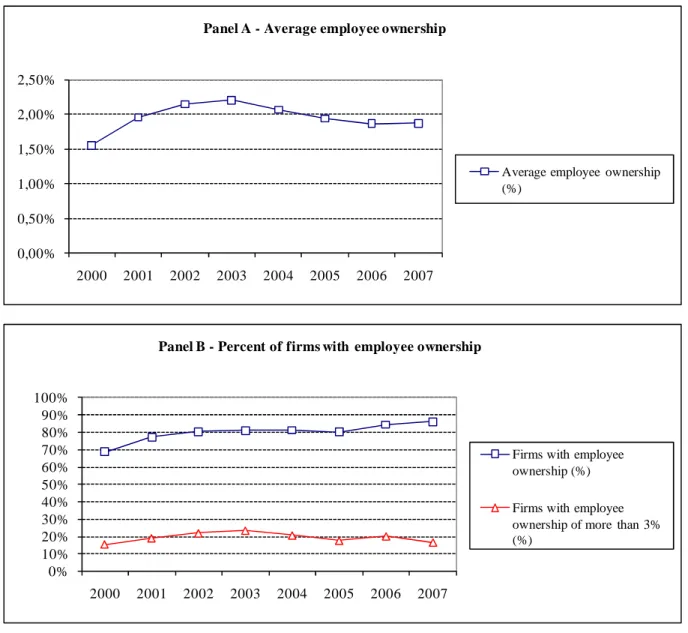
Panel A of Figure 1 shows the time trend of the average percent of employee ownership in SBF 120 firms from 2000 to 2007. The average level of employee ownership is 2.08% over the study period and remains quite stable after 2001. Panel B shows the fraction
of firms with employee ownership and with employee ownership higher than 3%. While there is a continuous increase in the fraction of firms with employee ownership thanks to a general promotion of this ownership in France (from 68.83% in 2000 to 86.11% of sample firms in 2007), the fraction of firms with an employee ownership of more than 3% is quite stable over the time (19.49% over the period).
*** Insert Figure 1 about here ***
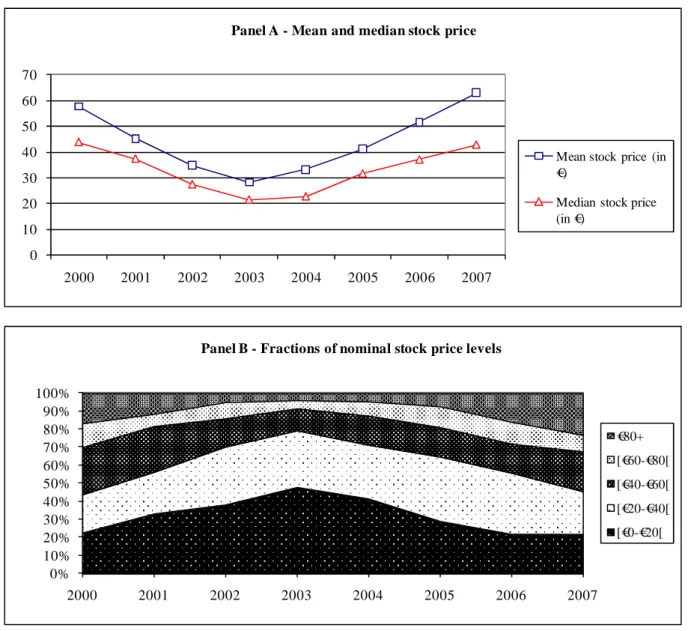
Panel A of Figure 2 reports the time trend of mean and median stock prices in Euros computed as the average or median of daily closing prices from 2000 to 2007. The mean (median) stock price for the sample firms is €45.55 (€35.38) respectively. The minimum average (median) stock price is €28.23 (€21.54) in 2003 while the maximum average (median) stock price is €62.98 (€42.77) in 2007. Panel B reports the fractions of firms with mean stock price levels in five different price ranges from 2000 to 2007: [€0-€20[, [€20-€40[, [€40-€60[, [€60-€80[ and above €80. We find that around 70% of the firms have an average stock price lower than €60 over the sample period. It confirms that firms manage their stock prices (Weld, et al. (2009) and De Ridder (2010)).
*** Insert Figure 2 about here ***
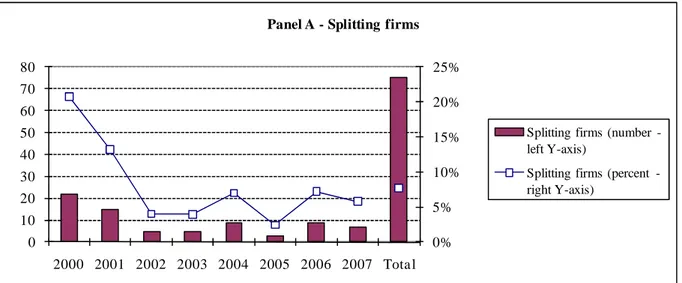
Our final sample includes 75 stock splits of 1.25 to 1 or greater from 2000 to 2007. On average, 7.75% of the firms split their stocks over the period. Figure 3 reports the time trend of the number and the fraction of splitting firms. We observe that there are more splits during the stock market expansion in 2000 and 2001 (respectively 20.75% and 13.16% of the SBF 120 firms) which means that firms use stock splits to adjust price level of their stocks after a high appreciation. Stock splits are fewer after 2001: on average, 5.07% of the SBF 120 firms split their stocks after 2001.
*** Insert Figure 3 about here ***
Panel A of Table 1 provides descriptive statistics (number of observations, mean, median, minimum, maximum and standard deviation) on ownership and firm-level variables for our whole sample (968 firm-years of 165 unique firms). As noted before, the average (median) price per share over the sample period is €45.55 (€35.38), while around 8% (exactly 7.75%) of the firms split their stocks between 2000 and 2007. The average (median) employee ownership level in the firm is 2.08% (0.86%) while the mean (median) level of institutional ownership is 17.59% (16.07%). 10% of our sample firms are characterized by an average trade size of less than €3,000 and in 11% of the firms, the average trade size is at least €30,000. The average (median) firm in the sample has a book value of equity of €4.28 billion
(€1.17 billion). Then, the mean earnings per share and stock appreciation between years t-2 and t are, respectively, €2.10 and 32% (medians of €1.78 and 19%, respectively).
In Panel B of Table 1, we report tests of differences in means (Student tests) between firms having an employee ownership higher than 3% and firms with an employee ownership strictly lower than 3%10 and between splitting firms and no splitting firms. We first observe that firms with high levels of employee ownership (representing 21.28% of the sample) have lower stock prices (€36.80 versus €45.58). One possible explanation is that employees are wealth constrained and cannot afford to buy a firm’s stock if the price is too high. These firms also have higher stock split activity even though the difference is not statistically significant and higher levels of institutional ownership (20.53% versus 16.80%). Then, employee ownership appears to be more prevalent in large firms (average €8.91 billion compared to €3.02 billion) and in firms with large trades. We do not observe significant differences between firms having an active employee ownership policy and firms with small levels of employee ownership for earnings per share and stock appreciation. In the second part of the panel, we note that splitting firms (7.75% of the sample) have a significantly higher level of employee ownership than no splitting firms (2.82% compared to 2.02%) which suggests that employee ownership encourages stock split behavior. Splitting firms also have significant higher levels of institutional ownership (22.65% versus 17.17%) and larger trade size. Stock appreciation between year t-2 and year t is non-surprisingly significantly higher in splitting firms (116% compared to 25%) which confirms that firms use stock splits to lower the stock price or to keep the firm’s stock price in an optimal price range. We do not obtain significant differences between splitting firms and no splitting firms for the other variables namely average share price, presence in the firm of small trades, firm size and earnings per share.
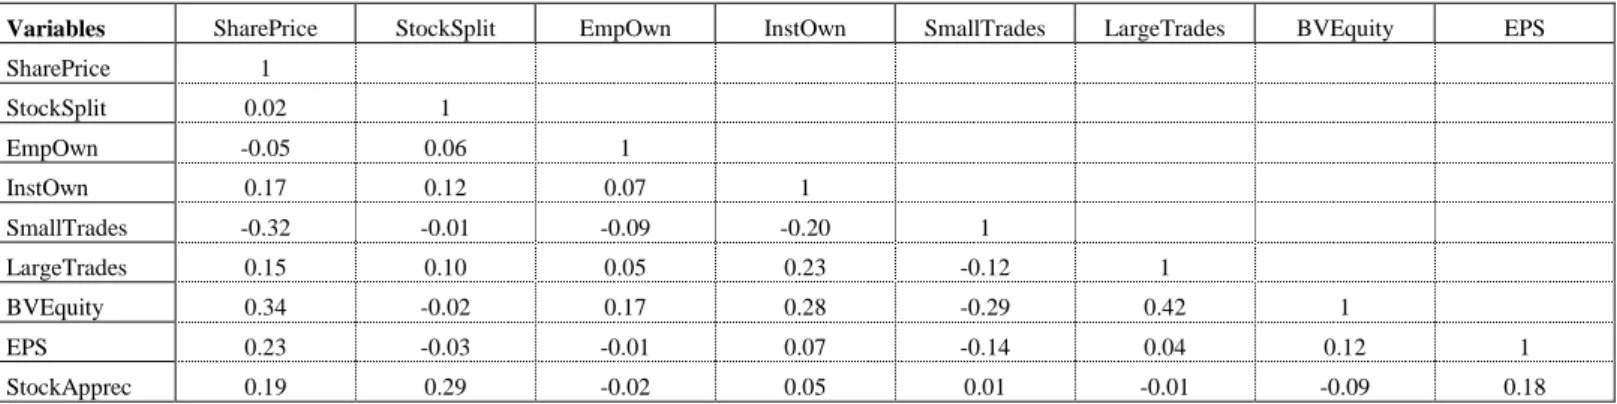
Panel C of Table 1 reports a correlation matrix with Pearson correlation coefficients for the main variables used in this paper. Institutional ownership is unsurprisingly found to be negatively correlated with the presence of small trades in the firm (-0.20) and positively correlated with large trades (0.23) and firm size (0.28). Large trades are a characteristic of large firms (Pearson correlation coefficient of 0.42) while smaller firms have smaller investors (correlation between firm size and SmallTrades of -0.29).
Panel D of Table 1 describes the composition of the sample by industry. Manufacturing industries account for the largest fraction (37.71%) of all observations while agriculture, mining and construction industries account for the smallest (6.92%). Business and
10 We choose the 3% threshold as French law mandates that employee shareholders in any publicly listed firm have the legal right to elect a director whenever they hold at least 3% of outstanding shares.
personal services represent 18.70% of all observations, transportation, communication and utilities represent 11.36% of the sample. Then, finance, insurance and real estate and wholesale and retail trades account for 14.46% and 10.85% of all observations, respectively.
As in De Ridder (2010), we report frequency distributions of employee ownership in firms sorted by stock price levels. More accurately, we divide our sample of firms between firms with low-priced stocks and firms with high-priced stocks. Panel E of Table 1 reports the results. Until an employee ownership of 4%, the fraction of firms with high-priced stocks is higher than the fraction of those with low-priced stocks. From a level of employee ownership of 4%, we observe that the number of firms with low-priced stocks is higher than the number of firms with high-priced stocks. This provides support for the conjecture that firms having a large employee ownership have lower stock prices.
*** Insert Table 1 about here ***
5. Regression results
5.1. The relation between employee ownership and stock prices
In Table 2, we present regression results for share price level on employee ownership and a set of firm specific control variables. We report several regressions to show that the impact of employee ownership on our dependent variable is robust to the inclusion of firm-level variables but we first focus our comments on column 6 where we use the logarithm of the average share price. Consistent with our expectations and first hypothesis, results show that employee-shareholders are less likely to buy high-priced stocks: employee ownership is significantly negatively related at the 1% level to the average share price. They also indicate that employee ownership is more prevalent in firms with low-priced stocks. The importance of employee ownership in a firm is inversely related to its share price.
In terms of the firm specific factors, the sign of the coefficients are consistent with prior studies. Institutional owners have higher holdings in firms with high stock prices. This result is in line with several studies such as De Ridder (2010). To distinguish the effect between employee ownership and the presence of small and large shareholders in the firm, we have introduced in our regressions two dummy variables to take into account the average trade size. We find that small trades which control for the presence of small shareholders are significantly negatively correlated to share price while large trades do not significantly impact our dependent variable. Consistent with Dyl and Elliott (2006) or Weld, et al. (2009) who
suggest that large and well-known firms have higher share prices, we have a positive and significant coefficient for the firm size variable. They also show that stock prices of firms whose earnings per share increase may appreciate vis-à-vis the prices of firms whose earnings per share do not increase. The coefficient on the earnings per share (EPS) is non-surprisingly significantly positive in the regression. Year dummies from 2002 to 2006 are negative and significant. Industry dummies (not reported) are not significantly correlated to share price. Then, the adjusted R-squared is 0.32 which means that our model explains a substantial fraction of the cross-sectional variation in our dependent variable.
In Column 7, we present regression results of our model using the nominal value of the average share price. Results are robust and coefficients and signs of control variables similar to those of the previous model, except institutional ownership which becomes negative but insignificant.
*** Insert Table 2 about here ***
While previous table presents the results for the overall sample period, we show in Table 3 the regression results for each calendar year. Employee ownership is also significantly negatively related to share price in all the regressions. The estimated coefficient on employee ownership is -1.2668 in the overall sample regression. In the calendar year analysis, it varies from -0.7805 in 2003 to -2.3621 in 2007. The t-statistics indicate that the significance levels of employee ownership vary from 1% in 2000 and 2002 to 5% in 2003, 2004 and 2005 and 10% in 2001, 2006 and 2007. Institutional ownership is significantly negatively related to the dependent variable in 2000 and 2001 and becomes insignificant the other years. For most of the years, the SmallTrades binary variable is negative and significant. The LargeTrades dummy variable is negative and significant at the 5% level only in 2000. The coefficient on firm size is always positive but insignificant from 2003. Earnings per share are either significantly or insignificantly positively correlated to share price except in 2001 when they are surprisingly negative and significant. Then, the adjusted R-squared varies from 0.09 in 2002 to 0.53 in 2006.
*** Insert Table 3 about here ***
5.2. Employee ownership and stock splits
Table 4 presents the Probit regression results for the likelihood that a firm splits its stock. We also focus our comments on the last column of the table. Employee ownership is positively related to the likelihood and the coefficient is significant at the 5% level. This
finding is consistent with our second testable hypothesis: employee ownership encourages stock split behavior. Employees, who are wealth constrained investors, prefer to buy attractive shares (i.e., shares at a more affordable price) and invest in companies which manage their stock prices.
Most of control variables introduced in our multivariate analysis have the expected signs. Surprisingly, the coefficient on the percentage of shares held by institutional holders is positive and statistically significant. Mason and Shelor (1998) explain this result by the fact that institutional investors may encourage firms to approve stock splits to earn return increases. Large trades are also significantly positively related to the likelihood that firms will enact a stock split. While some studies show that firm size impacts the probability of a stock split (Baker and Powell (1993), for instance), we do not find a significant relation between these two variables. Unsurprisingly, the increase in the firm’s stock price over the two years preceding the year when the firm splits its stock (StockApprec) is positively and significantly associated with the dependent variable. Year dummies show that stock splits were more frequent in 2000 and 2001 at the time of the stock market expansion but were less many in 2005. Industry dummies (not reported) are non instructive. Then, the Pseudo R-squared of the model is 0.19. As for some years the number of splitting firms is very low, we do not conduct an empirical analysis for each calendar year.
*** Insert Table 4 about here ***
6. Robustness tests
6.1. Alternative definitions of employee ownership
We perform several robustness checks to establish the stability of our results. First, when we use alternative definitions of employee ownership, we obtain similar results to those presented in Tables 2 and 4. In columns 1 and 2 of Table 5, EmpOwn is defined as the fraction of shares of all classes held by the employees with at least a 3% equity stake. When we use the 5% threshold in columns 3 and 4, we obtain both the same signs and statistical significances to those previously presented. We also introduce in our two models a continuous variable (IASIndex) equals to the fraction of shares of all classes held by the employees when the stock is included in the Euronext FAS IAS employee ownership index and zero otherwise. This index comprises all stocks having a large employee ownership scheme defined as at least 3% of the company’s shares being owned by more than one-fourth of the employees.
Unfortunately, the data on the percent of distribution of employee ownership within the firm are not available for 2000 and 2001. Columns 5 and 6 present the results (the sample contains 5.08% of splitting firms). We observe that average share prices are significantly lower when firms have large employee stock ownership and broad-based employee stock ownership positively and significantly impacts stock split behavior. Other coefficients remain stable except in the share price model where institutional ownership becomes positive and significant (in line with most empirical studies) and in the stock split model where the LargeTrades dummy variable is insignificant. Firm size becomes negatively and significantly associated to the dependent variable. This last finding is consistent with Baker and Powell (1993) who predict that smaller firms with low institutional ownership have more incentives to use stock splits to attract the attention of analysts and shareholders.
As mentioned before, our sample period includes the stock market expansion period of 2000/01 and the stock market downturn of 2002. When we re-estimate the regression models in Tables 2 and 4 after excluding 2000, 2001 and 2002 (the fraction of splitting firms is 5.29%), results are qualitatively the same (columns 7 and 8). The coefficient on institutional ownership is positive and statistically significant in the stock price level model but becomes insignificant in the stock split regression. The LargeTrades dummy variable also becomes non-significantly related to the likelihood that a firm will enact a stock split and firm size now negatively significantly influences the dependent variable.
Columns 9 and 10 show the findings when the StockSplit variable equals one when the firm had a stock split of 3-to-1 or greater (reducing the fraction of splitting firms to 5.58%) or 5-to-1 or greater (3.10% of splitting firms) during the period test, respectively, and zero otherwise. Employee ownership still positively and significantly impacts stock split behavior. Institutional ownership which was positively and significantly correlated to stock split becomes insignificant in these two regressions.
Then, when we exclude firms without any employee ownership schemes (7.91% of splitting firms), results remain unchanged (columns 11 and 12). In the stock split model, firm size is once again negative and significant.
*** Insert Table 5 about here ***
6.2. Alternative control variables and tests
We also check the sensitivity of our results using alternative control variables. In order to keep a maximum number of observations, we estimate share price appreciation
(StockApprec) as the increase in the firm’s stock price over the two years preceding the stock split but when we use a higher number of years, we obtain similar results. Furthermore, firm size in our paper is measured by the logarithm of the book value of firm’s equity at the end of the year. When firm size is alternatively measured by the logarithm of net sales, market capitalization (even though for this latter measure, a spurious correlation may appear with share price as suggested in Dyl and Elliott (2006)), total employees or total assets, results are identical. Then, when we censor the average share price dependent variable at the 1st and 99th percentiles or when we exclude firms with extreme split factor to reduce the weight of extreme values, we obtain same results (results available upon request).
Some studies suggest a non-linear relation between ownership structure and corporate outcomes. Anderson and Reeb (2003) as well as Miller, et al. (2007) show that the relationship between firm performance and founding-family ownership is non-linear. McConnel and Servaes (1990) or Himmelberg, et al. (1999) also document non-linearity of managerial holdings. We thus modify our regressions by including employee ownership and the square of employee ownership as continuous variables but, unfortunately, we do not obtain a significant nonlinear relationship. When we replace employee ownership by the fraction of votes held by the employees (the fractions of cash-flow and voting rights held by the employees are very close), results do not differ (results available upon request).
6.3. Endogeneity issues
As in most corporate governance studies, our analysis may suffer from a potential endogeneity problem which may affect the sign and/or the statistical significance of our results. Models explaining stock prices and splits are estimated on the implicit assumption that employee ownership is exogenous. However, several authors provide evidence of the endogeneity of a firm’s ownership structure (Demsetz and Lehn (1985) or Demsetz and Villalonga (2001), for instance). So far, we have shown that employee ownership is more prevalent in firms with low stock prices and encourages stock split behavior (causal relation from employee ownership to share prices and splits). However, it could be argued that employee ownership is the result of firms having low share prices and splitting their stocks (causal relation from stock prices and splits to employee ownership).
We address this concern in three ways. First, as in Cheng (2008) and Faleye, et al. (2010), we replace the employee ownership variable with its historical value (the first year for which the data item is available) in the two models explaining share prices and splits. Results
presented in Table 6 are similar to those in Table 2 and 4 and thus mitigate concerns about reverse causation.
*** Insert Table 6 about here ***
We also check our results using two-stage least-squares regressions. As suggested in Gompers, et al. (2010), the choice of good instruments for ownership structure is difficult. To solve this problem, we follow this procedure: the instrument variable must be significantly correlated with the endogenous ownership variable and be uncorrelated with the second-stage error term (Wooldridge, 2001). We use as an instrumental variable for employee ownership the fraction of shares of all classes held by founding-families (FamOwn). This variable was manually collected from firm’s annual reports. Family ownership impacts the level of employee ownership in the firm. For instance, Trébucq (2002) shows that French family-controlled firms create more shareholder value but open their capital to non-management employees less often than non-family businesses do. We do not see any arguments that could lead to the conclusion that family ownership impacts stock price and split. We could have used other instrument variables such as firm risk. Demsetz and Lehn (1985) and Demsetz and Villalonga (2001) suggest that ownership is a function of firm size and risk. Thornton and Wu (2010) examine the relation between the percentage of shares controlled by ESOPs and firm risk measured by stock return volatility and find a negative relation between employee ownership and firm risk. However, firm risk doesn’t meet in our study the first requirement of the validity of instrument variables.
In a first-stage regression, we compute a predicted level of employee ownership. We model employee ownership using firm size, institutional ownership, the presence in the firm of small or large trades, industry and year dummies and family ownership as instrumental variable. We observe in Panel A of Table 7 that family and employee ownerships have a statistically significant positive correlation. This confirms that the choice of this instrument meets the first condition that instruments have to be correlated with the endogenous regressor. Furthermore, regression results show that employee ownership is significantly positively impacted by firm size. Institutional ownership does not significantly influence employee ownership. Employee ownership is more prevalent in firms with small-sized trades. Industry and year dummies are not informative.
In a second-stage regression, we use the predicted value from the first stage to instrument the endogenous choice variable in tests of stock price and split. Panel B of Table 7 presents the results of estimating the impact of employee ownership on stock price and split respectively controlling for endogeneity. Overall, our estimates from the 2SLS regressions are
consistent with our prior regression results. We find that employee ownership encourages firms to have lower share prices and to split their stocks. In terms of the control variables, most of them keep approximately the same significance with the two-stage least-squares regressions. In the share price model, the 2006 year dummy is now insignificant while institutional ownership becomes significantly positively related to share price as in, for instance, De Ridder (2010). In the stock split model, firm size becomes significantly negatively related to the likelihood that a firm splits its stock. Then, we keep similar adjusted R-squared and Pseudo R-squared to those of our previous regressions.
*** Insert Table 7 about here ***
Our data set has both a cross-sectional and a time series dimension (165 unique firms over eight years; among these unique firms, 45.45% split their stocks over the sample period). Panel data method may thus be used and allows us to control for certain unobserved characteristics of firms (Wooldridge, 2001). However, as mentioned in Faleye, et al. (2010) and Thornton and Wu (2010), the time variability of employee ownership is low – as well as most of corporate governance variables – so firm fixed-effects can produce artificially low levels of statistical significance. We thus follow Thornton and Wu (2010) methodology and calculate the time series average of the ownership and financial data over the period to produce one observation for each firm. Results presented in Table 8 confirm our two hypotheses: firms having a large employee ownership have low-priced stocks and are more likely to split stocks. Other control variables keep approximately the same sign and significance. In the stock split model, the SmallTrades variable becomes statistically significant while we lose significance for the LargeTrades dummy variable.
*** Insert Table 8 about here ***
7. Conclusion
In this paper, we study the link between employee ownership and the level of stock prices as well as the decision to split. We hypothesize that employee-shareholders may prefer to invest in low-priced stocks and therefore in firms which manage their stock prices as they tend to be wealth constrained and cannot afford to buy a firm’s stock if the price is too high.
We use a comprehensive sample of firms in the Société des Bourses Françaises (SBF) 120 Index from 2000 to 2007. Consistent with our hypotheses, our results show that employee-shareholders have more holdings in firms with low stock prices and that an active employee ownership policy encourages stock split behavior. The effects hold after we control
for the presence of small investors in the firm, alternative definitions of employee ownership, different econometric specifications and endogeneity. Overall, our results show that employee ownership is more prevalent in firms which manage their nominal stock prices and thus have attractive shares.
Be as it may, this paper highlights the importance for employees of the characteristics of the shares they buy. Future research could identify other factors which encourage the acquisition of shares by employees.
References
Anderson, Ronald C. and David M. Reeb, 2003. Founding-Family Ownership and Firm Performance: Evidence from the S&P 500. Journal of Finance 58(3), 1301-1327.
Asquith, Paul, Paul Healy and Krishna Palepu, 1989. Earnings and Stock Splits. Accounting Review 64(3), 387-403.
Aubert, Nicolas and Thomas Rapp, 2010. Employee’s Investment Behaviors in a Company Based Savings Plan. Finance 31(1), 5-32.
Baker, H. Kent and Patricia L. Gallagher, 1980. Management’s View of Stock Splits. Financial Management 9(2), 73-77.
Baker, H. Kent and Gary E. Powell, 1993. Further Evidence on Managerial Motives for Stock Splits. Quarterly Journal of Business and Economics 32, 20-31.
Baker, Malcolm, Robin Greenwood and Jeffrey Wurgler, 2009. Catering through Nominal Share Prices. Journal of Finance 64(6), 2559-2590.
Beatty, Anne, 1995. The Cash Flow and Informational Effects of Employee Stock Ownership Plans. Journal of Financial Economics 38, 211-240.
Brennan, Michael J. and Thomas E. Copeland, 1988. Beta Changes Around Stock Splits: A Note. Journal of Finance 43(4), 1009-1013.
Brennan, Michael J. and Patricia J. Hughes, 1991. Stock Prices and the Supply of Information. Journal of Finance 46(5), 1665-1691.
Chaplinsky, Susan and Greg Niehaus, 1994. The Role of ESOPs in Takeover Contests. Journal of Finance 49(4), 1451-1470.
Cheng, Shijun, 2008. Board Size and the Variability of Corporate Governance. Journal of Financial Economics 87, 157-176.
Copeland, Thomas E., 1979. Liquidity Changes Following Stock Splits. Journal of Finance 34(1), 115-141.
De Ridder, Adri, 2010. Stock Prices, Institutional Holdings and Breadth of Ownership. Working paper.
Degeorge, François, Dirk Jenter, Alberto Moel and Peter Tufano, 2004. Selling Company Shares to Reluctant Employees: France Telecom’s Experience. Journal of Financial Economics 71, 169-202.
Demsetz, Harold and Kenneth Lehn, 1985. The Structure of Corporate Ownership: Causes and Consequences. Journal of Political Economy 93(6), 1155-1177.
Demsetz, Harold and Belén Villalonga, 2001. Ownership Structure and Corporate Performance. Journal of Corporate Finance 7, 209-233.
Dhillon, Upinder S. and Gabriel G. Ramirez, 1994. Employee Stock Ownership and Corporate Control: An Empirical Study. Journal of Banking and Finance 18(1), 9-25.
Dyl, Edward A. and William B. Elliott, 2006. The Share Price Puzzle. Journal of Business 79(4), 2045-2066.
Easley, David, Maureen O’Hara and Gideon Saar, 2001. How Stock Splits Affect Trading: A Microstructure Approach. Journal of Financial and Quantitative Analysis 36(1), 25-51. Faleye, Olubunmi, Vikas Mehrotra and Randall Morck, 2006. When Labor Has a Voice in Corporate Governance. Journal of Financial and Quantitative Analysis 41(3), 489-510.
Faleye, Olubunmi, Rani Hoitash and Udi Hoitash, 2010. Intensive Board Monitoring and Corporate Strategic Innovation. Working paper.
Ginglinger, Edith, William Megginson and Timothée Waxin, 2011. Employee Ownership, Board Representation, and Corporate Financial Policies. Journal of Corporate Finance, forthcoming.
Gompers, Paul A., Joy Ishii and Andrew Metrick, 2010. Extreme Governance: An Analysis of Dual-Class Firms in the United States. Review of Financial Studies 23, 1051-1088.
Gordon, Lilli A. and John Pound, 1990. ESOPs and Corporate Control. Journal of Financial Economics 27, 525-555.
Grinblatt, Mark S., Ronald W. Masulis and Sheridan Titman, 1984. The Valuation Effects of Stock Splits and Stock Dividends. Journal of Financial Economics 13(4), 461-490.
Helfin, Frank and Kenneth W. Shaw, 2005. Trade Size and Informed Trading: Which Trades are “Big”? Journal of Financial Research 28(1), 133-163.
Himmelberg, Charles P., R. Glenn Hubbard and Darius Palia, 1999. Understanding the Determinants of Managerial Ownership and the Link between Ownership and Performance. Journal of Financial Economics 53, 353-384.
Ikenberry, David L., Graeme Rankine and Earl K. Stice, 1996. What do Stock Splits Really Signal? Journal of Financial and Quantitative Analysis 31(3), 357-375.
Kim, E. Han and Paige Ouimet, 2009. Employee Capitalism or Corporate Socialism? Broad-Based Employee Stock Ownership. Working paper.
La Bruslerie (de), Hubert, 2009. The Setting of a Coalition Contract Between Controlling Shareholder, Managers and Executives: How to Mix Incentive and Political Logics? Working paper.
Lakonishok, Joseph and Baruch Lev, 1987. Stock Splits and Stock Dividends: Why, Who, and When. Journal of Finance 42(4), 913-932.
Maloney, Michael T. and J. Harold Mulherin, 1992. The Effects of Splitting on the Ex: A Microstructure Reconciliation. Financial Management 21(4), 44-59.
Mason, Helen B. and Roger M. Shelor, 1998. Stocks Splits: An Institutional Investor Preference. Financial Review 33, 33-46.
McConnell, John J. and Henri Servaes, 1990. Additional Evidence on Equity Ownership and Corporate Value. Journal of Financial Economics 27, 595-612.
Miller, Danny, Isabelle Le Breton-Miller, Richard H. Lester and Albert A. Cannella Jr., 2007. Are Family Firms Really Superior Performers? Journal of Corporate Finance 13, 829-858. Mukherji, Sandip, Yong H. Kim and Michael C. Walker, 1997. The Effect of Stock Splits on the Ownership Structure of Firms. Journal of Corporate Finance 3, 167-188.
Oyer, Paul and Scott Schaefer, 2005. Why do Some Firms Give Stock Options to All Employees?: An Empirical Examination of Alternative Theories. Journal of Financial Economics 76, 99-133.
Pagano, Marco and Paolo F. Volpin, 2005. Managers, Workers, and Corporate Control. Journal of Finance 60(2), 841-868.
Schultz, Paul, 2000. Stock Splits, Tick Size, and Sponsorship. Journal of Finance 55(1), 429-450.
Shanthikumar, Devin, 2004. Small and Large Trades around Earnings Announcements: Does Trading Behavior Explain Post-Earnings-Announcement Drift? Working paper.
Thornton Jr., John H. and Shengxiong Wu, 2010. ESOPs and Firm Risk. Working paper. Trébucq, Stéphane, 2002. L’actionnariat Salarié dans les Entreprises Familiales du SBF250 : Un Outil de Création de Valeur ? Finance Contrôle Stratégie 5(4), 107-135.
Weld, William C., Roni Michaely, Richard H. Thaler and Shlomo Benartzi, 2009. The Nominal Share Price Puzzle. Journal of Economic Perspectives 23(2), 121-142.
Wooldridge, Jeffrey M., 2001. Econometric Analysis of Cross Section and Panel Data. The MIT Press.
Figure 1 - Employee ownership in French listed companies, 2000 to 2007
The sample consists of all the SBF 120 Index firms with available data over the period 2000-2007. Panel A reports the average employee ownership in firms. Panel B reports the fraction of firms with employee ownership and with employee ownership of more than 3%.
0,00% 0,50% 1,00% 1,50% 2,00% 2,50% 2000 2001 2002 2003 2004 2005 2006 2007 Panel A - Average employee ownership
Average employee ownership (%) 0% 10% 20% 30% 40% 50% 60% 70% 80% 90% 100% 2000 2001 2002 2003 2004 2005 2006 2007
Panel B - Percent of firms with employee ownership
Firms with employee ownership (%) Firms with employee ownership of more than 3% (%)
Figure 2 - Stock prices of French listed companies, 2000 to 2007
The sample consists of all the SBF 120 Index firms with available data over the period 2000-2007. Panel A reports mean and median stock prices in Euros computed as the average or median of daily closing prices. Panel B reports the fractions of firms with mean stock price levels in Euros in different price ranges.
0 10 20 30 40 50 60 70 2000 2001 2002 2003 2004 2005 2006 2007
Panel A - Mean and median stock price
Mean stock price (in €)
Median stock price (in €) 0% 10% 20% 30% 40% 50% 60% 70% 80% 90% 100% 2000 2001 2002 2003 2004 2005 2006 2007
Panel B - Fractions of nominal stock price levels
€80+ [€60-€80[ [€40-€60[ [€20-€40[ [€0-€20[
Figure 3 - Stock splits in French listed companies, 2000 to 2007
The sample consists of all the SBF 120 Index firms with available data over the period 2000-2007. The figure reports the number (left Y-axis) and the percent (right Y-axis) of splitting firms.
0% 5% 10% 15% 20% 25% 0 10 20 30 40 50 60 70 80 2000 2001 2002 2003 2004 2005 2006 2007 Tota l Panel A - Splitting firms
Splitting firms (number -left Y-axis)
Splitting firms (percent -right Y-axis)
Table 1 - Descriptive statistics for sample firms
The sample consists of all the SBF 120 Index firms with available data over the period 2000-2007. Panel A reports summary statistics of main variables. Panel B reports tests of differences in means (Student tests) between firms with employee ownership higher than 3% and firms with employee ownership strictly lower than 3% and between splitting firms and no splitting firms. Panel C reports Pearson correlation coefficients. Panel D reports the composition of the sample by industry (one-digit SIC code). Panel E reports frequency distribution of employee ownership and frequency distribution among low and high-priced stocks. SharePrice is the average price per share of firm’s common stock during the year, where the average annual share price is the average of the daily closing prices. StockSplit is a dummy variable that takes the value of one if a firm splits its stock during the year, and zero otherwise. EmpOwn is the level of employee ownership. InstOwn is the level of institutional ownership. SmallTrades is a dummy variable that takes the value of one when the average trade size is less than €3,000, and zero otherwise. LargeTrades is a dummy variable that takes the value of one when the average trade size is at least €30,000, and zero otherwise. BVEquity is the book value of firm’s equity at the end of the year (in this table, in euro thousands). EPS is the firm’s earnings per share during the year. StockApprec is the increase in the firm’s stock price over the two years preceding the year when the firm splits its stock.
Panel A: Summary statistics of main variables
Variables Observations Mean Median Minimum Maximum Standard deviation SharePrice 968 45.55 35.38 0.05 723.28 49.29 StockSplit 968 0.08 0.00 0.00 1.00 0.27 EmpOwn 968 2.08 0.86 0.00 32.83 3.81 InstOwn 968 17.59 16.07 0.00 95.51 12.04 SmallTrades 968 0.10 0.00 0.00 1.00 0.30 LargeTrades 968 0.11 0.00 0.00 1.00 0.31 BVEquity 968 4,276,632.00 1,166,632.00 827.00 56,675,100.00 7,720,193.00 EPS 968 2.10 1.78 -72.45 46.62 6.19 StockApprec 968 0.32 0.19 -0.98 9.68 0.85
Panel B: Tests of differences
Variables EmpOwn≥3% (N = 206) EmpOwn<3% (N = 762) Student test Splitting firms (N = 75) No splitting firms (N = 893) Student test SharePrice 36.80 45.58 -2.260** 41.32 45.91 -0.774 StockSplit 0.09 0.07 0.598 EmpOwn 2.82 2.02 1.764* InstOwn 20.53 16.80 3.980*** 22.65 17.17 3.813*** SmallTrades 0.03 0.12 -3.588*** 0.09 0.10 -0.206 LargeTrades 0.21 0.08 5.469*** 0.21 0.10 3.009*** BVEquity 8,911,535.00 3,023,627.00 10.218*** 3,913,687.00 4,307,114.00 -0.424 EPS 1.99 2.13 -0.277 1.41 2.16 -1.005 StockApprec 0.26 0.34 -1.184 1.16 0.25 9.274***
Table 1 - Continued
Panel C: Pearson correlation coefficients
Variables SharePrice StockSplit EmpOwn InstOwn SmallTrades LargeTrades BVEquity EPS
SharePrice 1 StockSplit 0.02 1 EmpOwn -0.05 0.06 1 InstOwn 0.17 0.12 0.07 1 SmallTrades -0.32 -0.01 -0.09 -0.20 1 LargeTrades 0.15 0.10 0.05 0.23 -0.12 1 BVEquity 0.34 -0.02 0.17 0.28 -0.29 0.42 1 EPS 0.23 -0.03 -0.01 0.07 -0.14 0.04 0.12 1 StockApprec 0.19 0.29 -0.02 0.05 0.01 -0.01 -0.09 0.18
Panel D: Composition of the sample by industry (one-digit SIC code)
Industry 2000 2001 2002 2003 2004 2005 2006 2007 Total Agriculture, mining, construction 10 8 8 8 8 8 8 9 67
9.43% 7.02% 6.45% 6.30% 6.20% 6.56% 6.40% 7.44% 6.92%
Manufacturing 43 41 47 48 47 46 48 45 365
40.57% 35.96% 37.90% 37.80% 36.43% 37.70% 38.40% 37.19% 37.71%
Transport, communications, utilities 9 11 15 15 17 14 15 14 110
8.49% 9.65% 12.10% 11.81% 13.18% 11.48% 12.00% 11.57% 11.36%
Wholesale and retail trades 12 15 15 15 13 12 12 11 105
11.32% 13.16% 12.10% 11.81% 10.08% 9.84% 9.60% 9.09% 10.85%
Finance, insurance and real estate 17 18 18 18 18 17 16 18 140
16.04% 15.79% 14.52% 14.17% 13.95% 13.93% 12.80% 14.88% 14.46%
Business and personal services 15 21 21 23 26 25 26 24 181
14.15% 18.42% 16.94% 18.11% 20.16% 20.49% 20.80% 19.83% 18.70%
Total 106 114 124 127 129 122 125 121 968
% of total 10.95% 11.78% 12.81% 13.12% 13.33% 12.60% 12.91% 12.50% 100.00%
Panel E: Employee ownership distribution, low and high-priced stocks
Employee ownership
Total sample Low-priced stocks High-priced stocks Number Fraction Number Fraction Number Fraction
=0% 197 20.35% 115 11.88% 82 8.47% ]0%;0.5%[ 207 21.38% 89 9.19% 118 12.19% [0.5%;1%[ 102 10.54% 49 5.06% 53 5.48% [1%;1.5%[ 101 10.43% 39 4.03% 62 6.40% [1.5%;2%[ 67 6.92% 32 3.31% 35 3.62% [2%;2.5%[ 45 4.65% 21 2.17% 24 2.48% [2.5%;3%[ 43 4.44% 21 2.17% 22 2.27% [3%;3.5%[ 45 4.65% 23 2.38% 22 2.27% [3.5%;4%[ 25 2.58% 10 1.03% 15 1.55% [4%;4.5%[ 26 2.69% 18 1.86% 8 0.83% [4.5%;5%[ 18 1.86% 13 1.34% 5 0.52% ≥5% 92 9.50% 54 5.58% 38 3.93% Total 968 100.00% 484 50.00% 484 50.00%
Table 2 - Employee ownership and share price levels, empirical analysis for the overall sample period This table reports the results of the following model:
SharePrice = δ0 + δ1EmpOwn + δ2InstOwn + δ3SmallTrades + δ4LargeTrades + δ5BVEquity + δ6EPS + δ 2000-2006(Year Dummy Variables) + δ1-7(Industry Dummy Variables) + ε
SharePrice is the average price per share of firm’s common stock during the year, where the average annual share price is the average of the daily closing prices. EmpOwn is the level of employee ownership. InstOwn is the level of institutional ownership. SmallTrades is a dummy variable that takes the value of one when the average trade size is less than €3,000, and zero otherwise. LargeTrades is a dummy variable that takes the value of one when the average trade size is at least €30,000, and zero otherwise. BVEquity is the logarithm of the book value of firm’s equity at the end of the year. EPS is the firm’s earnings per share during the year. Year and industry dummies are included. We estimate the model via Tobit regressions. The table presents the coefficients and Heteroskedasticity-consistent (White, 1980) t-values in parentheses and then the R² and adjusted R². ***, **, * * indicate coefficients significance level: 1%, 5% and 10% respectively.
Variables Log(SharePrice) SharePrice
(1) (2) (3) (4) (5) (6) (7) EmpOwn -0.0168*** -0.0172*** -0.0199*** -0.0273*** -0.0237*** -0.0201*** -1.2668*** (-3.508) (-3.691) (-4.333) (-5.920) (-5.297) (-4.436) (-5.481) InstOwn 0.0047** 0.0037* 0.0023 0.0029 -0.1577 (2.046) (1.743) (1.085) (1.331) (-1.361) SmallTrades -0.6009*** -0.6380*** -0.6038*** -0.5856*** -13.0441*** (-5.896) (-5.802) (-5.594) (-5.710) (-2.652) LargeTrades -0.0303 0.0120 -0.0258 -0.0452 -2.7034 (-0.400) (0.152) (-0.329) (-0.579) (-0.480) BVEquity 0.1777*** 0.1673*** 0.1489*** 0.1409*** 0.1402*** 0.1444*** 4.8652*** (11.112) (10.224) (8.202) (7.410) (7.425) (7.951) (4.530) EPS 0.0256** 0.0251** 0.0218** 0.0225** 0.0246** 0.0216** 1.4845* (2.375) (2.335) (2.124) (2.168) (2.319) (2.106) (1.724) Y2000 0.0214 0.0104 0.0110 0.0364 0.0065 -5.7611 (0.202) (0.098) (0.105) (0.345) (0.062) (-0.747) Y2001 -0.0395 -0.0465 -0.0504 -0.0282 -0.0526 -9.1722 (-0.393) (-0.462) (-0.495) (-0.270) (-0.517) (-1.216) Y2002 -0.3039*** -0.2902*** -0.3205*** -0.2971*** -0.3098*** -21.4412*** (-3.074) (-2.915) (-3.317) (-2.902) (-3.175) (-3.164) Y2003 -0.5636*** -0.5595*** -0.5433*** -0.5265*** -0.5409*** -30.0741*** (-5.832) (-5.793) (-5.810) (-5.355) (-5.782) (-4.381) Y2004 -0.4334*** -0.4248*** -0.3938*** -0.3932*** -0.3890*** -26.3639*** (-4.604) (-4.516) (-4.237) (-3.991) (-4.181) (-3.658) Y2005 -0.3015*** -0.2919*** -0.2956*** -0.2935*** -0.2888*** -23.9537*** (-3.373) (-3.277) (-3.329) (-3.109) (-3.249) (-3.159) Y2006 -0.1875** -0.1845* -0.1612* -0.1623* -0.1591* -13.9279* (-1.967) (-1.950) (-1.702) (-1.655) (-1.688) (-1.732)
Industry Dummies Yes Yes Yes Yes Yes Yes Yes
Constant 1.0277*** 1.0811*** 1.4121*** 1.5115*** 1.7514*** 1.4185*** -14.7767 (4.494) (4.776) (5.512) (5.728) (6.190) (5.561) (-1.021)
R² 0.28 0.29 0.32 0.21 0.26 0.32 0.18
Adjusted R² 0.27 0.27 0.31 0.21 0.25 0.31 0.16