Any correspondence concerning this service should be sent to the repository administrator:
[email protected]
To link to this article:
DOI:10.1016/j.powtec.2008.04.053
http://dx.doi.org/10.1016/j.powtec.2008.04.053
This is an author-deposited version published in:
http://oatao.univ-toulouse.fr/
Eprints ID: 6313
To cite this version:
Ansart, Renaud and de Ryck, Alain and Dodds, John A. and Roudet, Matthieu
and Fabre, David and Charru, François Dust emission by powder handling:
Comparison between numerical analysis and experimental results. Powder
Technology, vol. 190 (n° 1-2). pp. 274-281. ISSN 0032-5910
O
pen
A
rchive
T
oulouse
A
rchive
O
uverte (
OATAO
)
OATAO is an open access repository that collects the work of Toulouse researchers and
makes it freely available over the web where possible.
Dust emission by powder handling: Comparison between numerical analysis and
experimental results
Renaud Ansart
a,⁎
, Alain de Ryck
a, John A. Dodds
a, Matthieu Roudet
b,c, David Fabre
b, François Charru
baCentre RAPSODEE, UMR CNRS 2392, Ecole des Mines d'Albi, 81013 Albi, France
bUniversité de Toulouse; INPT, UPS; IMFT; CNRS (Institut de Mécanique des Fluides de Toulouse); Allée Camille Soula, F-31400 Toulouse, France cLGC, UMR 5503, 5 rue Paulin Talabot 31106 Toulouse, France
A B S T R A C T Keywords: Dust emission Theoretical model Plume Entrainment constant PIV Experimental methods
The dust generation occurring during the handling of bulk materials in free falls or at the impact on a stockpile can be a source of danger for the operators health. Proper design of control systems of fugitive dust requires knowledge of the behavior of the free falling powder, the air it entrains, and the concentration of dust liberated. This paper presents first a simple model for a free falling column of bulk solids and compares it with relevant previous research. This two phase model predicts the particle and air velocities, and especially the volumetric flow of induced air in the column without dependence on any empirical constant like the entrainment constant used in the plume model. For small drop heights, the predictions of the theory appear to be in qualitative agreement with the available data for the quantity of air entrained, but the theory needs to be extended in the case of large drop heights, when the expansion of the jet of particles is large. In a second part, the description of an expanded jet of particles is experimentally studied with PIV measurements. The data obtained are well fitted by the model by Liu, when the entrainment constant is taken as the angle of expansion of the jet obtained from the velocity field.
1. Introduction
Bulk material handling operations involving a falling stream of particles are very common in industry. In such cases, fine particles of the bulk material break away from the main flow and contaminate the ambient air. Such dust emissions lead to a number of problems in the industry such as the danger of explosions and the risks for operators health.
When considering dust generation, there are two principal physical mechanisms whereby dust leaves the bulk material and is carried away from the stockpile by air currents: a) dust liberation during the free-fall of the parent material, b) the falling stream impact on the stockpile releasing the entrained air that causes pulvation of fugitive dust from the stockpile[1]. This study investigates the first phenomenon.
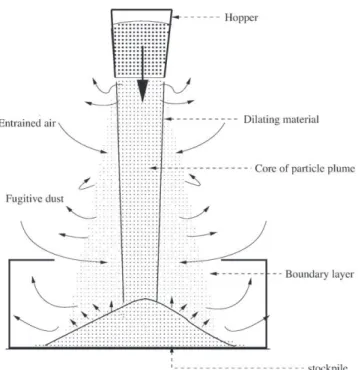
When powders are in free fall, the surrounding air is induced into the particle stream as the bulk solid expands (Fig. 1), and the voidage of the stream increases. The aim of this study is to understand this mechanism and quantify the air entrainment. Due to the turbulent air flow around the stream of material, some particles, particularly the finer particles, mix with the entrained air to form a “boundary layer” of dust around the falling core of bulk material. The thickness of this dusty boundary layer increases as the distance of fall increases[2].
After a review of previous modelling (section 2), this paper describes in a first part a new model the dynamics of the column of particle during its fall, with the estimation of the quantity of air entrained (section 3). These predictions are compared with previous researches. Then, in a second part, experimental results on the particle velocity field in the expanded zone are presented and compared with the Liu's plume model (section 4).
2. Previous researches
There has been little research on air entrainment during the pro-cessing of bulk solids. The first serious attempt to theoretically predict the quantity of air entrained by a falling stream is by Hemeon[3]. He has developed a model based on a theory related to a single particle falling through quiescent air under the influence of gravity. His method is based on the following assumption: the work done by drag forces on a falling particle accelerated from rest to terminal velocity in quiescent air equals the work needed to accelerate the entrained air from rest to entrained velocity. He deduced that the induced air flow is given by:
Qind¼ 0:66gQmðhAÞ 2 dpρp
!1=3
; ð1Þ
where g is the gravitational acceleration, Qmthe mass flow rate of
solids, h the drop height, A the cross-sectional area of material stream,
dpthe particle diameter and ρpthe particle density. ⁎ Corresponding author. Centre RAPSODEE, UMR CNRS 2392, Ecole des Mines d'Albi,
81013 Albi, France.
E-mail address:[email protected](R. Ansart).
However, Hemeon's theory generally grossly over predicts the rate of air entrainment unless empirical correction factors are applied[4]. This is a result of the inherent assumption that the flow in the stream is made up of particles that act independently, whereas the reality is that particles within the stream interact with the quiescent ambient air, to a much smaller extent than if they were falling independently through the fluid.
More recently, Cooper and Arnold[1]have proposed two analytical models for two possible extremes of free falling particle column behavior. The first extreme situation corresponds to a bulk material of massive particles falling from a hopper where all particles in the stream accelerate at a rate equal to the gravitational constant, g. The velocity profile is a “top hat”. The momentum of the entrained air flow is assumed to be negligible compared with that of the falling particles. According to the principle of conservation, Cooper and Arnold deduced the entrained air volumetric flow rate:
Qind¼ u2p0þ 2gh
" #1=2
$up0
$ %
A0; ð2Þ
where up0and A0are respectively the bulk material velocity and cross
sectional area at the start of free fall.
An another model for the falling stream of large particles (about 500µm), Uchiyama[5,6]employed a vortex method for free turbulent gas flow laden with solid particles. This method simultaneously calculates the behavior of the vortex elements, discretizing the gas vorticity field and the particle motion by Lagrangian approach.
The second extreme situation, most relevant for the study of dust emission during free fall, is the case of a stream of very fine powder falling from the outlet of a hopper. The flow should develop as a miscible plume with a Gaussian velocity profile. According to the plume flow equation of Morton[7], Cooper and Arnold estimated the volumetric flow rate at a distance h from the point source by the relation:
Qind¼ C gQm ρp
!13
h53; ð3Þ
where B is the buoyancy flux and C a constant related to the en-trainment constant α.
In the case of a “bousinesq” plume, where the density difference between the mean plume and the ambient air is small, Batchelor[8]
and Morton[7]assumed that the entrainment velocity at the edge of the plume υeis proportional to the characteristic vertical velocity
υplumewithin the plume at the same height: α = υe/υplume.
Glutz [9]carried out an experimental study to compare the re-levant theoretical models proposed by Hemeon, and Cooper describes above. He found that the plume theory which was developed by Cooper gives the best fit to the air entrainment data.
Following this work, Liu[10]developed a two-phase flow model to present the characteristics of a free falling particle plume in quies-cent air. The following equations system proposed by Liu, describes the characteristics of a stream of free falling particles with respect to continuity, particle momentum flux and air momentum flux, respectively: d dz πr 2 au & ' ¼ 2πraαu; Qm dup dz ¼ 1 up B $ K up$ u & '43 Cs " # ; d dz ρaπra2u2 & ' ¼ K up$ u & '43 Cs 1 up; 8 > > > > > > < > > > > > > : ð4Þ
where u is the entrained air velocity and rais the radius of the air
entrainment and B, K are parameters defined. The stream coefficient
Cswas used to modify the drag forces of the particles in free falling
multi-particle system as a function of the local void fraction in the core of the stream.
Liu has provided the good comparison between his theoretical predictions of volumetric air entrainment and experimental data. But the weakness of this model is the strong dependence on the empirical entrainment constant α. Liu determines α by fitting the experimental data to the theoretical model.
To avoid this dependency on the entrainment constant, we have developed a two-phase model to predict free falling particle in qui-escent air, presented in the next section.
3. Modelisation
3.1. Assumptions and definitions
The gas phase is supposed incompressible of specific mass ρa. The
particles are assumed to be spherical with radius a, and to have a uniform specific mass ρpand mass m, and to be large enough for the
Brownian motion of the particles to be negligible. The free fall regime is assumed to be stationary in time. Cohesive effects such as that due to humidity are not taken into account in the model.
The control volume τ (Fig. 2) is assumed to be statistically ho-mogeneous in the horizontal plane. The mean particle velocity is vertical and not necessarily steady. The mean number density is
n yð Þ ¼ϕρp
m ; where ϕ yð Þ is the local concentration of the particles
called the particle volume fraction. The vertical velocity is divided into a mean particle velocity ūp(y) and a fluctuation u′p. Two kinds of
average are used: the mean particle velocity is an ensemble average and the mean air velocity is a spatial average. In view of the horizontal homogeneity an ensemble mean is equivalent to a spatial average over a horizontal plane.
3.2. Momentum flux of the particles
Considering one particle, the Lagrangian acceleration satisfies:
md
dt up
&
' ¼ mg þ FD; ð5Þ
where FD¼ CDπa
2
2 ρajju $P uPpjj&Pu $Pup' is the friction force on the grain.
According to Schiller and Nauman's experimental data[11], the Stokes law may be extended to a Reynolds number of 800, where the drag force is written: CD¼Re24p 1 þ 0:15Re
γ
p
&
'; Repb 800; γ ¼ 0:687: The drag
force acting on a multiparticle system is larger than the one acting on a single particle. Hence, Maude[12]presented the relative velocity ū − ūpas:
P
u$P
up
1$ϕ
ð Þðβ$1ÞÞ;with β = 5.5. The particle concentration is
expres-sed in the factor 1 $ ϕð Þð1$βÞ: This factor decreases with the particle drop height and tends to 1, and the voidage increases with the drop height as air is induced into the plume. All put together, the drag force for this multiparticle system may be written as: FD¼
6πμa P u$Pu p ð Þ 1$ϕ ð Þðβ$1Þ 1 þ 0:15Re γ p & ':
Batchelor[13] investigated the velocity fluctuations in a homo-geneous fluidized bed and reported that they is a function of the particle volume fraction ϕ, which we write as: ūp′2 = H (ϕ)(ūp2).
Batchelor made the simple assumption that the dimensionless func-tion H (ϕ) varies quadratically. He considered that there are no velocity fluctuations in the absence of hydrodynamic interactions between particles, so H tends to 0 as ϕ tends to 0. At the other extreme, when ϕ approaches the close-packing limit, ūp′2must again
approach zero, whereas although ūp2becomes small it remains
non-zero in the limit (ϕcp = 0.6). It seems therefore that H (ϕ) has a
maximum at some intermediate value of ϕ. The maximum value of H might be as high as 0.25 at which value the r.m.s. velocity fluctuations is 50% of the mean. Thus, Batchelor proposed: H ϕð Þ≈ϕ
ϕcp 1 $
ϕ ϕcp " #
:
3.3. Momentum flux of entrained air
The increase in the vertical momentum of entrained air is driven by the drag force exerted by the falling particles, and the rate of change of momentum flux of entrained air with respect to drop height is given by:
d
dy ρaS 1 $ ϕð ÞPu2
h i
δy¼ $FDnπR2δyþ σp2πRδy: ð6Þ
where R is the radius of the core.
The friction between the column and the quiescent air is in-troduced and simulated by a Blasius boundary layer developing over a flat plate. The Blasius solution shows that the wall shear stress σpmay
be written as: σp¼ $0:332ρam 1 2 ay$ 1 2Pu 3 2; where ν
arepresents the air
kinematic viscosity.
3.4. Equations system governing the two-phase flow
The equation expressing the conservation of number of particles may be written as:d
dy n
P up
&
' ¼ 0.
The conservation of the volumetric flow of air (Fig. 3) satisfies:
Qa(y + δy) − Qa(y) = Q˜a. The difference between the volume of air
coming out of and that going in the volume control is equal to the volume of air entrainment.
To sum up, the following system describes the characteristics of a stream of free falling particles with respect to continuity, particle momentum flux and air momentum flux:
P up dP up dy¼ g þ 6πμa m P u $P up & ' 1 $ ϕ ð Þðβ$1Þ 1 þ 0:15Re γ p & ' $ 1 ϕρp d dy ϕρp ϕ ϕcp 1 $ ϕ ϕcp ! P u2 p ! ; d dy ð1 $ ϕÞ P u2 h i ¼ $6πμa m P u $P up & ' 1 $ ϕ ð Þðβ$1Þ ρp ρa
ϕ& 1 þ 0:15Re& γp'
$0; 664π R m 1 2y$ 1 2Pu 3 2 : 8 > > > > > > > > > > > > > > < > > > > > > > > > > > > > > : ð7Þ
Choosing a velocity scale τg and a length scale τ2g, where τ ¼ m
6πμa corresponds to a relaxation time, the dimensionless equations may be written as: Q ¼ ϕPu⁎ p; dPu⁎ p dy⁎¼ ϕ2cpPup⁎2 ϕ2 cpPup⁎2þ Q 1 P u⁎ p þPu⁎β$2 p P u⁎$Pu⁎ p " # Pu⁎ p$ Q " #β$1α 0 B @ 1 C A; dPu⁎ dy⁎¼ $Q 2Pu⁎ Pu⁎ p$ Q " # ϕ2cpPup⁎2 ϕ2cpPup⁎2þ Q 1 þPu⁎β$1 Pu⁎$Pu⁎ p " # Pu⁎ p$ Q " #β$1α 0 B @ 1 C A þ P u⁎β$1 p Pu⁎$Pu⁎ p " # Pu⁎ p$ Q " #β$1 ρp ρa α 2 6 4 3 7 5 $P0:49λ u⁎ p$ Q ρp ρa : ;12 Pu⁎ y⁎ !12 Pu⁎ p: 8 > > > > > > > > > > > > > > > > > < > > > > > > > > > > > > > > > > > : ð8Þ with α = 1+0.15 ρa μa2aτg jjPu4$Pu4 pjjPup4β$1 P u4 p$Q ð Þβ$1 : ;γ ; γ¼ 0:687 and λ ¼a R: Moreover, Q ¼q0 τgis a dimensionless number; q0¼ Qm ρbπr02 is the superficial particle velocity at the outlet of the hopper; r0 is the
radius outlet and ρbis the bulk density in loose poured condition. Fig. 2.Control Volume.
Fig. 3.Conservation of the volume flow rate.
3.5. Numerical results
To investigate the effect of the dimensionless parameter Q on this numerical method, the particle and air velocities have been represented for two extreme values of Q ¼ ϕPu4
p(Fig. 4). At the outlet,
for the same particle velocity, is a function of the particle volume fraction ϕ0.
When ϕ tends to ϕcp, the close packing fraction, there is no
freedom for the air motion. The air is imprisoned by the particles at the outlet. It is what is observed inFig. 4for Q = 0.5. The air velocity closely matches the particles velocity and the particles can not be slowed down by the air flow. The granular column is only slowed down by the quiescent air around it. Hence, the predicted velocity of particles near the outlet of the hopper is close to the velocity of particles falling in a vacuum.
On the other hand, when ϕOtends to 0, there are no interactions
between particles and the air is able to circulate freely in the column. Thus, the air velocity is very low and the particle velocity tends to that of a single particle falling through quiescent air reaching the Stokes terminal velocity.
The comparison of the air quantity entrainment model developed by Hemeon, Cooper and Arnold, Liu, and the two-phase flow model are presented inFig. 5. It is noteworthy, that the comparisons have
been established for the case where Liu had determined the value of the parameter a empirically. As already mentioned, Hemeon gives a higher estimation of the volume of air entrained air. The predicted result from Cooper is slightly lower than Liu's prediction. Finally, we observe a good agreement between the model presented and the two models described by Liu, and Cooper and Arnold.
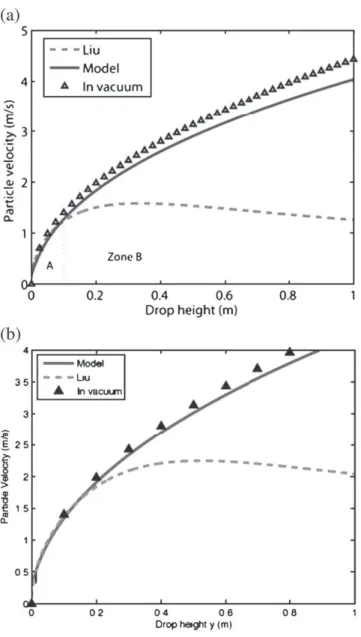
However, the air prediction model seems not to be suitable for a more diluted flow (Fig. 6). There is a good accordance until at the beginning of the chute but after that the model seems to give a lower estimation. We may understand the origin of this trouble by examining the particles velocities inFig. 7. In the process of free fall, the particle velocity crosses three different regions. In the first, near the outlet, the particle velocity is nearly equal to the velocity in vacuum. This region is longer as the mass flow rate of particles is higher. In the first comparison (Fig. 5), we were almost only in this first region. In the second region, the particle velocity still increases with increasing drop height but becomes smaller than the free fall velocity in vacuum. However, in the third region, the particle velocity decreases with increase of drop height and tends to an asymp-totic terminal velocity. The evolution of particle velocity is due to the decreasing of the particle volume fraction with increasing drop height. As explained above when particle volume fraction decreases, air friction on each particle increases.
Fig. 5.Volume flow rate. Q = 0.78, Qm= 138 g s− 1, α = 0.0196.
The two phase flow model does not reach a terminal velocity because of the assumption that the radius of the core of the particle stream is constant, and is locally homogeneous. As long as the particle velocity is nearly equal to the velocity in vacuum, the core radius is constant. It is the case at the beginning of the fall.
When the particle velocity deviates from the velocity vacuum, the radius of the core of the theoretical model should reduce, the plume radius increases and the shear stress simulated by a Blasius boundary layer developed over a flat plate would induce a decrease in the particle and air velocities.
4. Experimental measurements
4.1. Introduction
The jet of particles may be qualitatively described by three successive zones. The core of the powder jet contracts immediately after the exit from the hopper outlet and thereafter maintains an approximately constant radius for some distance, in the region of zone A. The core contraction just after the outlet, is due to the lowering of pressure created by the particle velocity increasing.
The dilation of the spray is not homogeneous, and the core of the stream appears to break up into a series of individual particle clusters,
in the region of zone B. The dilation behavior is strongly dependent on the hopper outlet diameter and hence the bulk mass flow.
Finally, the cluster size of the core of the particle stream appears to reduce with the extension of the particle drop height. Zone C is defined as the region where the particle clusters have disappeared. These observations have already been made by Liu[10]and our first observations have confirmed this phenomenon.
Previous relevant researches have been carried out to investigate the particle velocity of a free falling powder jet. Ogata[14]measured the axial velocity profiles of glass beads whose diameter was about 450µm using a laser-Doppler velocimeter. It was noteworthy, that the free falling velocity of the powder is larger than the local free falling velocity of a single particle and increases with increasing mass flow rate. Moreover, a uniform velocity profile exits near the orifice. But, in this case the particle size is too large to generate a significant plume and diffusion of powder.
Liu carried out experimental investigation on the particle velocity at the center of the plume by using a high speed camera. The prediction of the velocity in vacuum agreed with experimental data near the outlet of the hopper in the first zone. However, the experimental apparatus was not able to make relevant measurement of the particle velocity much further than the outlet of the hopper.
In this part, we have compared the experimental measurements of the particle velocity obtained by a PIV system with a numerical model. However, the two-phase flow model that we have described in the first part can only be applied in the concentrated zones of the plume close to the outlet and the PIV technique, as for it, must be used in the diluted zone. That is why, the PIV measurements have been compared with the plume model of Liu. To predict the particle velocity with Liu's model, we need to determine the constant air entrainment which is required initial parameter of this model. Unfortunately, we are not able to calculate the ratio #e
#plumebut the entrainment constant may be
correlated to the spread angle of the plume. This spread angle can be estimated by the PIV measurement according to the width of the gaussian velocity profile.
4.2. Experimental setup
The experimental set up is divided into two parts as in Liu[10]
(Fig. 8). The first comprises a pneumatic conveyor to transfer the solids materials into a hopper. The hopper can be fitted with various outlet
Fig. 7.Particle velocity, Q = 0.18, Qm= 2.2 g s− 1, α = 0.0326.
configurations to produce different mass flow rates of powder. The entire arrangement is mounted on three mass flow sensors.
The solid material flows out of the hopper and then undergoes free fall into the second part which is the test enclosure. This box is divided into two parts by an orifice plate to split the dust contribution due to free fall and to impact on the stockpile. Two vents have been put on the top part of the box to allow the plume to expand freely as in quiescent ambient air. It was necessary to ensure that these vents be large enough to avoid the lowering of pressure created by the induced air, which could contract the falling column of powder. To achieve this, a pressure sensor is used to measure the air pressure between the top of the test box and the ambient environment. Two vents have been put on to the bottom part of the box, so as to avoid over-pressure generated by the particles impact on the stockpile. This box is mounted on a frame that can be raised or lowered to change drop height.
A PIV system is located in the top part of the equipment to measure particle velocity by determining particle displacement (Δx, Δy) in the flow over a known time Δt = 100µs. A pulsed laser sheet, generated by a laser Nd:YAG (wavelength: 532nm, energy/pulse: 30mJ, pulse duration: 4ns and frequency: 15Hz), illuminates a plane in the flow (Fig. 9) and the position of the particles are recorded. A second laser pulse Δt later illuminates the same plane, creating the second set of particle images. If the particles in the flow field move by an amount Δx in the x-direction and Δy in the y-direction in time Δt, the velocities of the particles in the x and y directions are u ¼ Δx
Δt;#¼Δy Δt:
These particle movements are captured by the image capture system and recorded as image displacements. The CCD camera has an asynchronous double exposure mode and is able to acquire images up to 30Hz pulse repetition rate.
Typically, the particle images obtained from the two laser pulses are recorded on separate camera frames. The images in each of these frames are subdivided into a large number of interrogation regions, each small enough that the velocity within the region is uniform. Spatial cross-correlation of the image intensities in one interrogation region in the first frame with the image intensities in the correspond-ing interrogation region in the second frame provides a statistical estimate of Δx and Δy for that region-given by the peak of the correlation function. Since particle images are in separate frames, cross-correlation analysis based on FFT also gives the direction of image displacement, and hence the velocity vector. This process of obtaining the velocity for each interrogation region, by correlating the
images, is repeated for all the regions to cover the entire frame to get the instantaneous velocity field.
Due to small fluctuations of the velocities, it is impossible to determine the stationary field of the particles within one image. An average vector field is created by averaging a sequence of 500 vector fields at each measurement location. In the end, the average of 500 images converges to the data by ± 0.5% tolerance to the exact point. The average field is the mean of the valid vectors at each point.
The powder used is a silica gel, monodisperse, with a mean size of
D50= 60µm, as determined by diffraction with a Mastersizer2000 with
0.5bar of dispersion (this pressure is close to our experimental conditions as the spray is only driven by gravity). The particle density is ρp= 1000kg m− 3and loose poured bulk density, ρb= 550kg m− 3.
5. Results and discussion
5.1. Velocity profile
Fig. 10 shows a typical average field of the particle velocity. As expected, the spray has a plume shape with a maximum of the particle velocities of about 1m s− 1at the center . The core region has higher
velocity than the dust “boundary layer” region with the smallest particles. It's noteworthy, that the radius of the plume increases with increasing drop height. The diffusion of the jet is proportional to the distance from the orifice.
Fig. 12shows the vertical velocity profiles for various drop heights at a long distance from the orifice. The profile is gaussian in shape and as the distance from the orifice grows, the maximum velocity at the center decreases, while the width of the gaussian is increasing. These measurements have been made in the third region of the evolution of the vertical velocity where the velocity tends to an asymptotic value. The profile of vertical particle velocity may be described by the gaussian distribution as shown inFig. 11. The gaussian distribution
Fig. 9.PIV system.
Fig. 10.Average particle velocity map Qm= 1.52 g s− 1, drop height 50 cm.
may be expressed as: V ¼ Vmax' exp $ln2:2rbg " #2
: ;
;where, V is the local vertical particle velocity within the stream flow, r is the radius of the plume, Vmaxis the maximum velocity of the particle at the centre-line,
and bgis the full width of the gaussian distribution defined at half
maximum.
Fig. 12illustrates that the vertical profile of particle velocity is described adequately by the gaussian model described above. This information is very relevant because it is very difficult with PIV measurements to access the velocity at the center of the spray and at the edge at the same. The differences between the curve and the experimental data at the edge of the plume may be attributed to the pulse delay which is adapted to the velocities at the center and not at the edge. At the center of the plume the particle velocity is about 1– 2m s− 1and a relevant time between two pulses for the laser is about
100–200µs. On the contrary, the velocities at the edge of the plume are about ten times lower than at the center and a good time between pulses should be equal to 1–2ms.
5.2. Center-line velocity of powder jet
To use Liu's model to predict the particle velocity, we need to know the constant air entrainment a. One way is to correlate a with the spread angle. Thus, it is important to know how the powder jet spreads downstream. One estimate for the diffusion is given by the mean outer radius of powder jet. One definition of this is by the half radius where the axial particle velocity becomes half of the center-line particle velocity, as described above (Fig. 11). By calculating the radius of powder jet for several drop heights, we are able to estimate the spread angle by the method of the least squares. The air entrainment constant a obtained from spread angle at each experimental data is shown in Table 1. It can be seen that, the differences in particle diameter is likely to be the major causes of variation in a. The spread angle decreases with increasing particle diameter; the diffusion becomes smaller.
The theoretical model developed by Liu is further compared with experimental PIV data inFig. 13by using a equal to the spread angle definedTable 1. One limitation of a PIV system is that, it does not allow us to make a relevant measurement over the whole stream. If the
plume zone is too concentrated the algorithm of cross correlation can not calculate the motion of each particle meaning that the particle velocity will be underestimated.Fig. 13shows that the curve of the particle velocity becomes flatter as drop height increases as expected as the velocity of the particles in the plume decreases as it approaches the terminal velocity. It is worthwhile to note that the predicted velocity agrees very well with the experimental data using a as the half-width angle.
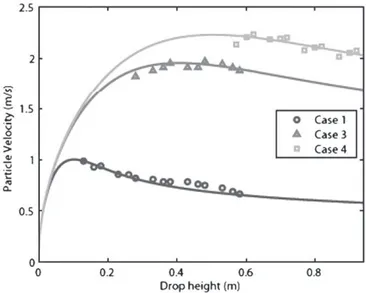
Further prediction of the theoretical model for various mass flow rates are depicted inFig. 14for different particle size distributions. This graph shows a good accordance between the model and the PIV measurements for different particle sizes and mass flow rates. More-over, we may note that the particle velocity under free fall conditions increases with increasing mass flow rate and particle diameter but not at the immediate vicinity of the outlet. The region where Vmax is
nearly equal to the velocity in a vacuum increases with increasing mass flow rate and particle size. The velocities observed are higher than the Stokes terminal velocity for a single particle, respectively 0.1 and 0.49m s− 1for a particle diameter of 60 and 130µm.
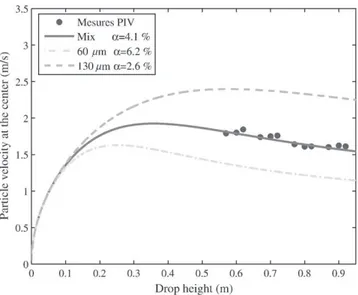
An another comparison with the Liu's model with the experi-mental results obtained with a 50/50 mixture in volume of these two particle size distributions (60µm and 130µm). This mixture
Fig. 12.Vertical particle velocity, D5O= 60 µm, DO= 10 mm, Qm= 1.44 g s− 1.
Table 1
Process parameters and spread angle for different cases
D0= 6 mm D0= 10 mm
60 µm 1: Qm= 0.18 g · s− 1, α = 6.2% 2: Qm= 1.44 g · s− 1, α = 6% 130 µm 3: Qm= 0.52 g · s− 1, α = 2.6% 4: Qm= 1.95 g · s− 1, α = 3%
Fig. 13.Vertical particle velocity at the center of the jet. Case 2.
Fig. 14.Vertical particle velocity at the center of the jet. (–): predicted velocity; (□), (Δ), (o): experiments.
corresponds to a larger particle size distribution with D50equals to
83µm. TheFig. 15shows that we still have a good agreement between the experiments and Liu's model even for a mixture of two particle size distributions. It's noteworthy that the entrainment constant a is strongly dependent of the particle size. Actually, the entrainment constant for the particle with a mean diameter of 60 µm is about 6%, on the other hand, a equals 2.6% the larger particles with a mean diameter of 130 µm. The particle mixture which corresponds to an average diameter gives an averaged value of a about 4.1% between 6% and 2.6%.
6. Conclusion
Bulk material handling operations involving powders are very common in industry. In such processes, there is always a risk of dust emission as particles of the bulk material can break away from the main flow and become suspended in the ambient air as dust. Such dust emissions can cause a number of problems including health risks for process operators.
This paper has established the bases of a new two phase flow model is presented to describe the dynamics of a free falling column of particles. This model is not dependent on the empirical factor called the entrainment constant. The two phase model described here well describes the influence of particle volume fraction at the outlet of the hopper on the flow. Moreover, at small drop heights, the entrained air flow rate predicted compares favorably with the validated values obtained with the Liu, and Cooper and Arnold's models. As a con-clusion, our two-phase flow model may be considered as a first attempt to describe the jet of particles in air without any empirical parameter.
However, the model requires improvement to give a better agreement with the stream flow at high drop heights. The assumption of constant core radius should be changed to describe the dilatation behavior of the jet which is strongly dependent on the bulk material mass flow rate and able the particle velocity to reach a terminal velocity.
In the second part, a study has been carried out to experimentally obtain the particle velocity at the center of the jet and compared it with the Liu's model. By means of the PIV, it is possible to access the flow vector velocities and to obtain a measure of the spread angle of the plume which is related to the entrainment constant. This spread angle is defined by calculating a half radius where the axial particle velocity becomes half of the center-line particle velocity along the axe. The predicted maximum velocity at the center-line is then in good agreement with the PIV data for various drop heights and particle sizes, and we experimentally obtain a relation between the size distribution of the particles and the entrainment constant.
Acknowledgment
The authors would like to thank Jean-Raymond Fontaine, Fabien Gerardin and Michel Pourquet of the INRS for the discussions on this subject. This research is financed by INRS, CNRS and FNS as part of an ACI project.
References
[1] P. Cooper, P.C. Arnold, Air entrainment and dust generation from a falling stream of bulk material, Kona, 13, (1995), pp. 125–134.
[2] Z. Liu, P. Wypych, P. Cooper, Dust generation and air entrainment in bulk materials handling, Powder Handling and Processing 4 (4) (1999) 421–425.
[3] W. Hemeon, Hemeon's plant and process ventilation: new edition of the classic industrial ventilation text, Lewis Publishers, 1998.
[4] P. Wypych, D. Cook, P. Cooper, Controlling dust emissions and explosion hazards in powder handling plants, Chemical Engineering Processing 44 (2005) 323–326. [5] T. Uchiyama, Numerical analysis of particulate jet generated by free falling
particles, Powder Technology, 145, 2004, pp. 123–130.
[6] T. Uchiyama, M. Naruse, A numerical method for gas–solid two phase free turbulent flow using a vortex method, Powder Technology, 119, p. 206–214. [7] B. Morton, G. Taylor, J. Turner, Turbulent gravitational convection from maintained
and instantaneous sources, Proceedings of the Royal Society of London, Series A, 234A, 1956, pp. 1–22.
[8] G.K. Batchelor, The theory of Homogenous Turbulence, Cambridge University Press, London, 1953.
[9] A. Glutz, Air entrainement in falling streams of material, BE honours thesis, Dept. Mechanical engineering, University of Wollongong.
[10] Z.Q. Liu, Air entrainement in free falling bulk materials, Ph.D. thesis, University of Wollongong (2001).
[11] R. Clift, J. Grace, M. Webber, Bubbles, drops and particles, Academic Press, New York, 1978.
[12] A. Maude, A generalized theory of sedimentation, Br. J. Appl. Phys. 9 (1958) 477–482.
[13] G.K. Batchelor, A new theory of the instability of a uniform fluidized bed, Journal of Fluid Mechanics, vol. 193, p.75–110.
[14] K. Ogata, K. Funatsu, Y. Tomita, Experimental investigation of a free falling powder jet and the air entrainment, Powder Technology, 115, p.90–95.