Pépite | Étude cinétique de réactions d’intérêt atmosphérique par détection simultanée des radicaux OH et RO2 couplée à la photolyse laser
253
0
0
Texte intégral
(2) Thèse de Emmanuel Assaf, Lille 1, 2017. © 2017 Tous droits réservés.. lilliad.univ-lille.fr.
(3) Thèse de Emmanuel Assaf, Lille 1, 2017. Résumé Les radicaux hydroxyle OH et hydroperoxyle HO2 jouent un rôle essentiel dans de nombreux processus d’oxydation dans l’atmosphère. La dégradation des composés organiques volatils dans les conditions troposphériques est généralement initiée par la réaction avec les radicaux OH, suivie par la réaction des produits d’oxydation avec l’oxygène. Dans le cadre de cette thèse, des études on été menées afin de mieux comprendre les mécanismes d’oxydation d’espèces d’intérêt atmosphérique. Pour cela, un dispositif expérimental composé d’une photolyse laser couplée à des techniques spectroscopiques de détection résolues dans le temps: Laser Induced Fluorescence Induite par Laser (LIF, pour la détection des radicaux OH) et continuous-wave Cavity Ring-Down Spectroscopy (cw-CRDS, pour la détection des radicaux OH, HO2 et RO2) a été utilisé. Après avoir mesuré le spectre ainsi que les sections efficaces d’absorption de quelques raies sélectionnées de OH, HO2 et RO2 dans la région du proche infrarouge, quatre systèmes ont été étudiés avec les techniques mentionnées ci-dessus: CH3O2 + OH, C2H5O2 + OH, C3H7O2 + OH et C4H9O2 + OH. La constante de vitesse ainsi que le rendement de HO2 ont été déterminés pour ces quatre réactions. En outre, les constantes de vitesse de réactions secondaires telles que CH3O + HO2, CH3O + CH3O ou OH + HO2 ont été déterminées.. Mots-clés: Chimie atmosphérique, radical, photolyse laser, fluorescence induite par laser,. continuous–wave. cavity. ring-down. spectroscopy,. hydroxyle,. peroxy,. hydroperoxyle. i © 2017 Tous droits réservés.. lilliad.univ-lille.fr.
(4) Thèse de Emmanuel Assaf, Lille 1, 2017. Abstract The hydroxyl radical OH and hydroperoxy radical HO2 are key species in many oxidation processes in the atmosphere. The degradation of volatile organic compounds under tropospheric conditions is induced by reactions with hydroxyl radicals followed by the subsequent chemistry of the initial OH oxidation products with O2. This thesis was focused on the kinetic study of some of these atmospherically relevant reactions to better understand their oxidation mechanisms using an experimental system of laser photolysis coupled to Laser Induced Fluorescence (LIF, for OH radical) and continuous-wave Cavity Ring-Down Spectroscopy (cw-CRDS, for OH, HO2 and RO2 radicals) detection techniques. After determining the infrared spectrum of OH, HO2 and CH3O2 radicals in the near infrared region and the absorption cross-sections of few selected lines, four systems were studied with the above mentioned techniques: CH3O2 + OH, C2H5O2 + OH, C3H7O2 + OH and C4H9O2 + OH. The rate constant and the HO2 yield of the four reactions were determined. In addition, the rate constants of few secondary reactions such as CH3O + HO2, CH3O + CH3O or OH + HO2 have been determined.. Keywords: Atmospheric chemistry, radicals, laser photolysis, laser induced fluorescence, continuous–wave cavity ring-down spectroscopy, hydroxyl, peroxy, hydroperoxyl. ii © 2017 Tous droits réservés.. lilliad.univ-lille.fr.
(5) Thèse de Emmanuel Assaf, Lille 1, 2017. © 2017 Tous droits réservés.. lilliad.univ-lille.fr.
(6) Thèse de Emmanuel Assaf, Lille 1, 2017. List of Publications (i) E. Assaf and C. Fittschen, “Cross Section of OH Radical Overtone Transition near 7028 cm-1 and Measurement of the Rate Constant of the Reaction of OH with HO2 Radicals,” J. Phys. Chem. A, vol. 120, no. 36, pp. 7051–7059, Sep. 2016. (Impact Factor 2.847) (ii) E. Assaf, B. Song, A. Tomas, C. Schoemaecker, and C. Fittschen, “Rate Constant of the Reaction between CH3O2 Radicals and OH Radicals Revisited,” J. Phys. Chem. A, vol. 120, no. 45, pp. 8923–8932, Nov. 2016. (IF 2.847) (iii) E. Assaf, L. Sheps, L. Whalley, D. Heard, A. Tomas, C. Schoemaeker, C. Fittschen, “The Reaction between CH3O2 and OH Radicals: Product Yields and Atmospheric Implications,” Environmental Science & Technology, vol. 51, no. 4, pp. 2170–2177, Feb. 2017. (IF 6.198) (iv) D. Liu, F. Khaled, B. R. Giri, E. Assaf, C. Fittschen, and A. Farooq, “HAbstraction by OH from Large Branched Alkanes: Overall Rate Measurements and Site-Specific Tertiary Rate Calculations,” J. Phys. Chem. A, vol. 121, no. 5, pp. 927– 937, Feb. 2017. (IF 2.847) (v) C. Fittschen, E. Assaf, and L. Vereecken, “Experimental and Theoretical Investigation of the Reaction NO + OH + O2 → HO2 + NO2,” J. Phys. Chem. A, vol. 121, no. 24, pp. 4652–4657, Jun. 2017. (IF 2.847) (vi) E. Assaf, S. Tanaka, Y. Kajii, C. Schoemaecker, and C. Fittschen, “Rate Constants of the Reaction of C2–C4 Peroxy Radicals with OH Radicals,” Chemical Physics Letters, vol. 684, pp. 245–249, Sep. 2017. (IF 1.815) (vii) E. Assaf, O. Asvany, O. Votava, S. Batut, C. Schoemaecker, and C. Fittschen, “Measurement of line strengths in the à 2A’ ← 2A” transition of HO2 and DO2,” Journal of Quantitative Spectroscopy and Radiative Transfer, vol. 201, pp. 161–170, Nov. 2017. (IF 2.419). iv © 2017 Tous droits réservés.. lilliad.univ-lille.fr.
(7) Thèse de Emmanuel Assaf, Lille 1, 2017. © 2017 Tous droits réservés.. lilliad.univ-lille.fr.
(8) Thèse de Emmanuel Assaf, Lille 1, 2017. Contents Résumé ............................................................................................................................. i Abstract ............................................................................................................................ ii List of Publications ......................................................................................................... iv Contents .......................................................................................................................... vi Acknowledgement/Remerciements ............................................................................... xi Introduction......................................................................................................................1 Chapter 1. HOX and RO2 radicals: chemistry and detection techniques ...................... 5. 1.1 Radical photochemistry in the troposphere ....................................................... 5 1.2. Techniques for HOX and RO2 radical measurements ........................................ 8. 1.2.1. Chemical amplifier and mass spectroscopy systems ................................ 10. 1.2.2. Spectroscopic methods...............................................................................12. 1.2.3 Techniques for rate constant measurements in complex systems ............ 15 Chapter 2 2.1. Experimental Technique ............................................................................21. General principles of the experimental techniques ..........................................21. 2.1.1. Laser Induced Fluorescence technique (LIF) ............................................21. 2.1.2. Cavity Ring-Down Spectroscopy techniques (CRDS)............................... 24. 2.2. Instrumentation and development .................................................................. 32. 2.2.1. Reactor and photolysis system .................................................................. 33. 2.2.2. The LIF system ......................................................................................... 40. 2.2.3. The CRDS system ...................................................................................... 46. Chapter 3. Kinetic and spectroscopic study of OH radicals .........................................61. 3.1 Introduction .......................................................................................................61 3.2 H2O2 spectrum and absorption cross-section determination ......................... 63 3.2.1 Measurement of the H2O2 spectrum ......................................................... 65 3.2.2. Determination of the H2O2 absorption cross-section .............................. 66. 3.2.3 Direct measurement of the rate constant of the OH+HO2 reaction ........ 69 3.3. OH spectrum and absorption cross-section determination ............................. 71. vi © 2017 Tous droits réservés.. lilliad.univ-lille.fr.
(9) Thèse de Emmanuel Assaf, Lille 1, 2017. 3.3.1. Measurement of the OH spectrum............................................................. 71. 3.3.2. Determination of the OH absorption cross-section ................................. 73. 3.3.3. Pressure broadening of the OH absorption cross-sections with different. gas buffer ............................................................................................................ 79 3.4. Conclusion ........................................................................................................ 83. Chapter 4. Study of the DO2 and HO2 radicals and CH3OH and CD3OD molecules:. measurement of the spectra and absorption cross-sections of selected peaks ............ 86 4.1. Introduction ...................................................................................................... 86. 4.2. Experimental conditions and measurement of CH3OH and CD3OD spectra . 88. 4.3. HO2 spectrum and absorption cross-section determination ...........................91. 4.3.1. Measurement of the HO2 spectrum ...........................................................91. 4.3.2 Calibration of the HO2 spectrum .............................................................. 93 4.3.3 4.4. Pressure broadening of the HO2 absorption cross-sections .................. 105. DO2 spectrum and absorption cross-section determination ......................... 107. 4.4.1. Measurement of the DO2 spectrum ........................................................ 107. 4.4.2. Calibration of the DO2 spectrum ............................................................. 110. 4.4.3. Pressure broadening of the DO2 absorption cross-sections ................... 114. 4.5. Determination of the rate constants of DO2+DO2 and HO2+DO2 reactions. 120. 4.6. Conclusion ...................................................................................................... 124. Chapter 5. On the CH3OH+F reactions: rate constants and product yields ............ 128. 5.1. The present understanding of the CH3OH+F reactions ................................ 128. 5.2. Experimental characterization of the CH3OH+F reaction ............................ 130. 5.2.1. Radical generation ................................................................................... 130. 5.2.2. Determination of the CH3O/CH2OH yield ..............................................132. 5.2.3 Determination of the CH3O self-reaction and CH3O+HO2 reaction rate constants ............................................................................................................135 5.3 Theoretical investigation of the reaction for CH3O+HO2 .............................. 140 5.4. Conclusion ...................................................................................................... 142. Chapter 6. The reactions between CxH2x+1O2 + OH. (x=1 to 4):. rate constants, product. yields, and atmospheric implications ..........................................................................145 6.1. The present understanding of the CxH2x+1O2 + OH (x=1 to 4) reactions .............145. vii © 2017 Tous droits réservés.. lilliad.univ-lille.fr.
(10) Thèse de Emmanuel Assaf, Lille 1, 2017. 6.2. Experimental characterization of the CH3O2+OH reaction .......................... 148. 6.2.1 Absorption Cross-section of CH3O2 ........................................................ 150 6.2.2 New determination of the rate constant..................................................156 6.2.3. The yield of HO2 as a product of the reaction ........................................ 162. 6.2.4 Determination of an upper limit for the yield of Criegee intermediates CH2OO .............................................................................................................. 168 6.2.5 Modeling and atmospheric implications ................................................ 169 6.3 Experimental characterization of the reactions of C2-C4 peroxy radicals with OH radicals ............................................................................................................... 171 6.3.1 Determination of the rate constant using different precursors .............. 171 6.3.2. The yield of HO2 as a product of the reaction ......................................... 179. 6.4 Conclusion .......................................................................................................195 Conclusion and further work ...................................................................................... 198 Bibliography ..................................................................................................................... i Nomenclature ............................................................................................................... xix List of Reactions ............................................................................................................ xx List of Tables............................................................................................................... xxiii List of Figures ...............................................................................................................xxv. viii © 2017 Tous droits réservés.. lilliad.univ-lille.fr.
(11) Thèse de Emmanuel Assaf, Lille 1, 2017. © 2017 Tous droits réservés.. lilliad.univ-lille.fr.
(12) Thèse de Emmanuel Assaf, Lille 1, 2017. À mes parents et à Michel À Marion. x © 2017 Tous droits réservés.. lilliad.univ-lille.fr.
(13) Thèse de Emmanuel Assaf, Lille 1, 2017. Acknowledgement/Remerciements Mes plus sincères remerciements sont tout d’abord adressés à ma directrice de thèse Christa Fittschen pour avoir dirigé ces travaux. Merci pour sa confiance, ainsi que sa présence et sa bienveillance accordées tout au long de ma thèse. Je vous suis extrêmement reconnaissant pour tout ce que vous m’avez appris, ce fut un plaisir de travailler avec vous. Je m’excuse pour les quelques comptes rendus que je n’ai pas rédigés mais j’essaierai de m’améliorer pendant cette année de post-doc. Je voudrais également remercier Coralie de m’avoir encadré ainsi que Laure pour sa grande sympathie, tous ses conseils et enseignements. Je tiens à remercier les différents membres du jury d’avoir accepté d’évaluer ce travail de thèse. Merci à Thérèse Huet de m’avoir fait l’honneur de présider ce jury. Merci Geoffrey Tyndall et David Rowley d’avoir rapporté mes travaux de thèse. Leurs remarques et commentaires ont ajouté une valeur à mon manuscrit. Merci aux examinateurs Dwayne Heard, Yoshizumi Kajii, Elena Jimenez et Ondrej Votava pour les échanges que nous avons eus lors de nos rencontres et lors de la soutenance. Je remercie Laurent Gasnot, directeur de laboratoire PC2A, pour son accueil ainsi que tout le personnel administratif et technique qui m’ont permis de travailler dans de très bonnes conditions. Je voudrais en particulier remercier Sébastien et Pascal pour leurs disponibilité, conseils et nombreuses interventions, et sans qui la manip n’aurait pas aussi bien fonctionné. Je voudrais ensuite remercier toutes les personnes qui ont fait que cette thèse a été fructueuse et ont fait que j’ai pu évoluer dans une ambiance de travail très saine et amicale. À tous ceux que j’oublie, la page blanche suivante vous est dédiée. Mes pensées vont tout d’abord à Michael, Marion, Patrice, Ahmad, Damien, Florent, Christopher. Merci pour trois années faites de discussions aussi bien philosophiques que scientifiques, sorties resto/ciné/bar/foot, karting, bowling, futsal. Je continuerais. xi © 2017 Tous droits réservés.. lilliad.univ-lille.fr.
(14) Thèse de Emmanuel Assaf, Lille 1, 2017. avec toutes les autres personnes du laboratoire, Nicolas, Mohamad, Lucia, Sympho, Momo, Junteng, et quelques personnes du LASIR Lucie, Samantha, Cécilia. Merci pour tous nos bons moments passés ensemble. Sur un plan plus personnel, je dois évidemment cette réussite à mes parents qui ont consacrés toute leur vie à l’éducation et au bien-être de leurs deux fils. Je leur adresse ma plus tendre gratitude. Je remercie également mon frère qui m’a aidé à devenir l’homme que je suis aujourd’hui. Merci également à toute ma famille et belle-famille qui m’ont soutenu toutes ces années. Enfin, mes pensées se tournent vers Marion dont j’ai le bonheur de partager la vie depuis plusieurs années et à qui je dois cette réussite dans mon travail. Je n’aurai jamais assez de mots pour lui témoigner toute l’admiration et la reconnaissance de m’avoir supporté pendant ces trois années ainsi que pour les sacrifices que nous avons dû faire. Nous pouvons maintenant suivre nos désirs d’évasions et de découvertes. Encore merci à tous, Emmanuel. xii © 2017 Tous droits réservés.. lilliad.univ-lille.fr.
(15) Thèse de Emmanuel Assaf, Lille 1, 2017. © 2017 Tous droits réservés.. lilliad.univ-lille.fr.
(16) Thèse de Emmanuel Assaf, Lille 1, 2017. Introduction The worldwide interest to investigate atmospheric chemistry has been increased during the last decades. Chemical compounds are released permanently by biogenic sources and anthropogenic activities and the extent to which environmental pollution is irreversibly affecting the quality of life because of its contribution to smog conditions, acid rain, stratospheric ozone depletion and global warming are rapidly becoming more apparent. The pressure being put to act and restrain the rise in greenhouse gases and pollutants with policy change is directed by complex climate model that aim to predict the future of the climate. These models rely on various physical and chemical processes at work in the atmosphere. A detailed understanding of the oxidative species and reactions in the atmosphere is important to improve to models and to develop optimum strategies to deal with these worldwide challenges. Hydroxyl radicals OH play a key role in the atmosphere as they act as the primary daytime oxidant, initiating the degradation of most trace gases, greenhouse gases and anthropogenic pollutants emitted into the atmosphere, which can then form an array of secondary species, thereby controlling the concentrations and lifetimes of many volatile organic compounds (VOCs). Hydroxyl radicals OH are linked to hydroperoxy HO2 and peroxy RO2 radicals through a series of oxidation steps that depend on the local environment. These highly reactive radicals, known as HOx = OH + HO2, have short tropospheric lifetimes (~ 1 s and ~ 100 s for OH and HO2 respectively) and their low ambient steady state concentrations (~ 106 and ~ 108 cm-3 for OH and HO2 respectively) are therefore uninfluenced by transport processes. While the influence of RO2 in polluted environment is well known and numerous experimental results are available, the reaction scheme in clean environment is much less known. Under low NOx conditions the RO2 self- and cross-reactions become predominant and RO2 can also react with OH radicals. However, until recently no experimental or theoretical data were found in the literature about RO2 + OH reactions and these reactions were. © 2017 Tous droits réservés.. lilliad.univ-lille.fr.
(17) Thèse de Emmanuel Assaf, Lille 1, 2017. Introduction. not included in atmospheric chemistry models. Their impact on atmospheric chemistry is however critically dependent on the nature and yields of the products. This thesis concentrates on kinetic studies of relevant reactions including OH, HO2 and RO2 radicals to better understand their oxidation mechanisms in low NOx environment. Two well-known techniques, namely Laser Induced Fluorescence (LIF, for OH radical) and continuous-wave Cavity Ring-Down Spectroscopy (cw-CRDS, for OH, HO2 and RO2 radicals) coupled to a laser photolysis reactor have been used as the measurement tools for the kinetic measurements of OH, HO2 and RO2 radicals. The Chapter 1 is a short overview of the role of peroxy radicals in the photochemistry of the troposphere highlighting the role of HO2 radicals as intermediates of reactions and their interconversion with OH radicals. Existing techniques used for the detection of these three radicals are described briefly, taking into account the strengths and weaknesses of each technique. The Chapter 2 is dedicated to the theoretical and experimental description of the two detection systems: continuous-wave Cavity Ring Down Spectroscopy (cw-CRDS) and high repetition rate Laser Induced Fluorescence (LIF). In the frame of this thesis, two such detection techniques were coupled to a photolysis cell. The results of the characterization of each technique are also developed. In Chapter 3, the first determination of the absolute cross-section of an overtone transition of OH radicals in the near-infrared region at 7028.830 cm-1 was performed and the impact of broadening gas on this line was determined. The absorption spectrum and the absorption cross-section of H2O2, used as precursors for OH radicals, have been measured. Then the two cw-CRDS absorption paths have been used to simultaneously measure OH and HO2 profiles and deduce the absolute concentrations of OH and H2O2 from subsequent modeling of the concentration time profiles, and the rate constant of the very fast reaction between OH and HO 2 radicals has been determined. In Chapter 4, the absorption cross-sections of HO2 and DO2 radicals in the near infrared region between 6940 and 7080 cm-1 were determined. In this range it is. 2 © 2017 Tous droits réservés.. lilliad.univ-lille.fr.
(18) Thèse de Emmanuel Assaf, Lille 1, 2017. Introduction. possible to detect the three radicals HO2, DO2 and OH with the same DFB laser diode and mirror set. The absorption spectra of DO2 and HO2 radical and CH3OH, CD3OD molecules, used as precursors were studied. Absolute absorption cross-sections of HO2 and DO2 will allow selective quantification of both radicals while tuning the laser source within a small wavelength range. In the Chapter 5 it will be shown that measuring time-resolved HO2 profiles at different O2 concentrations will allow retrieving the yield of CH3O and CH2OH in the reaction of F atoms with methanol following the photolysis of XeF2. The rate constants of both CH3O self-reaction and CH3O + HO2 cross-reaction will then be experimentally determined using low O2 concentrations. While the agreement with literature data for the CH3O self-reaction was found satisfying, the rate constant for the reaction of CH3O + HO2 differed by several orders of magnitude with the two only literature values. In order to better understand this strong disagreement, this reaction was again investigated by theoretical methods in collaboration with L. Vereecken. Finally, in Chapter 6 new experiments for determining the reactivity of CH3O2, C2H5O2 and the next larger peroxy radicals, C3H7O2 and C4H9O2, with OH radicals are presented. Experiments have been carried out using different precursors than in the previous studies. Experiments for the determination of the yields of the possible products have also been carried out. The results of the experiments on the reaction CH3O2 + OH have been implemented in a collaboration with D. Heard and L. Whalley into a box model utilizing the MCM, and the impact on the composition of the remote atmosphere has been determined. In addition, the absorption cross-section of CH3O2, a parameter on which the rate constant CH3O2 + OH directly depends during the experiment, has also been remeasured because available literature data were not in agreement.. 3 © 2017 Tous droits réservés.. lilliad.univ-lille.fr.
(19) Thèse de Emmanuel Assaf, Lille 1, 2017. © 2017 Tous droits réservés.. lilliad.univ-lille.fr.
(20) Thèse de Emmanuel Assaf, Lille 1, 2017. Chapter 1. HOX and RO2 radicals: chemistry and. detection techniques 1.1 Radical photochemistry in the troposphere. A layer called the atmosphere, composed of solid, liquid and mainly gas constituents, surrounds the Planet Earth. The atmosphere consists of different layers namely troposphere, stratosphere, mesosphere and thermosphere divided by temperature inversion profiles. The Earth atmosphere is composed of 78% N2, 20.9% O2, 1% Ar and 0.036% CO2 [1]. The water vapor concentration, which is the next most ambient constituent, is variable and can be up to 3%. The remaining gas constituents called trace gases are composed of volatile components with concentrations below 1 %. These trace gases are either of biogenic origin and emitted from sources such as forests and oceans or of anthropogenic origin released due to human activities. After being emitted in the atmosphere, these trace gases can be transformed or removed through different processes: wet or dry deposition, transport or chemical transformation. For example, the atmospheric lifetimes of certain greenhouse gases, in particular methane, are controlled by chemical oxidation, while anthropogenic emissions of some particulate matter and gaseous species in densely populated areas have adverse effects on human health. The chemical ageing of particulates and gases through oxidation and photolysis can enhance the production of aerosols and toxic products, and thus it is important to understand the oxidative species and reactions in the atmosphere in furthering the ability to model the chemistry in order to better predict the evolution of the oxidizing capacity of the atmosphere. Peroxy radicals RO2 (with R = H, CH3, C2H5, etc.) are key species in the chemistry of Earth atmosphere. They are formed as intermediate species of the oxidation process of VOCs in the atmosphere. The VOCs can be removed in the atmosphere by photolysis, by solar radiation and by reaction with other species such as OH radical or to a minor extend to Cl atoms, NO3 or O3 for example. One of the simplest oxidation. © 2017 Tous droits réservés.. lilliad.univ-lille.fr.
(21) Thèse de Emmanuel Assaf, Lille 1, 2017. Chapter 1 HOX and RO2 radicals: chemistry and detection techniques. mechanisms leading to the formation of the smallest peroxy radical, i.e. the hydroperoxy radical HO2, is the reaction of OH radicals with CO in presence of O2. A general and simplified scheme of the closely linked chemistry between OH and HO 2 radicals and involving peroxy radicals RO2 is shown in Figure 1.. Figure 1: Reactions and key species involved in the chemistry of OH, HO2 and RO2 radicals. The tropospheric chemistry of OH, HO2 and RO2 radicals has been described in recent reviews [2]–[4] in the literature and a full description is beyond the scope of this introduction. Thus, only key reactions will be shown here. The main source of daytime OH is through the photochemical production from the photolysis of ozone O3 (λ < 310 nm) to form an electronically excited oxygen atom O(1D) that reacts with water vapor to form OH. O3 + hυ<310nm → O(1D) + O2(1Δg). (R 1). O(1D) is metastable with a radiative lifetime of about 148 s because the transition between the excited singlet state to the triplet ground state is spin-forbidden. Most O(1D) atoms however are quenched by collisions with other molecules M, which are mostly N2 and O2 in the atmosphere: O(1D) + M → O(3P) + M. (R 2). 6 © 2017 Tous droits réservés.. lilliad.univ-lille.fr.
(22) Thèse de Emmanuel Assaf, Lille 1, 2017. Chapter 1 HOX and RO2 radicals: chemistry and detection techniques. This deactivation channel is in direct competition with the chemical reaction. In the lower troposphere for water mixing ratio equal to 1.5%, about 10% of the produced O(1D) reacts with H2O to form two OH radicals [5], while O(3P) can react with O2 to recycle O3: O(1D) + H2O → 2 OH. (R 3). O(3P) + O2 (+ M) → O3. (R 4). As mentioned above, various reaction pathways exist for OH including the reactions with CO to form HO2 and the reactions with VOCs to form RO2 radicals: OH + CO +O2 → HO2 + CO2. (R 5). OH + RH + O2 → RO2 + H2O. (R 6). The thus formed RO2 radicals have two main destruction pathways, either the reaction with NO or the reaction with HO2 or other RO2 radicals depending on the NOX conditions. In areas with high NOX concentrations, typically when [NO] > 2×1010 cm-3, RO2 radicals react predominantly with NO forming NO2 finally leading to the formation of O3 through the photolysis of NO2: RO2 + NO → RO + NO2. (R 7). HO2 + NO → OH + NO2. (R 8). OH radicals are recycled at the same time through the production and destruction of HO2. However, in absence of NOX, loss of RO2 is dominated by reaction with other RO2 and HO2 radicals and both HO2 and RO2 radicals can undergo chain termination reactions forming stable products ROOH and H2O2 or RO radicals: RO2 + RO2 → 2 RO + O2. (R 9). HO2 + RO2 → ROOH + O2. (R 10). 7 © 2017 Tous droits réservés.. lilliad.univ-lille.fr.
(23) Thèse de Emmanuel Assaf, Lille 1, 2017. Chapter 1 HOX and RO2 radicals: chemistry and detection techniques. HO2 + HO2 → H2O2 + O2. (R 11). HO2 + OH → H2O + O2. (R 12). The most important sink process for OH in polluted environments is the reaction of OH with NO2, resulting in the production of nitric acid HNO3: NO2 + OH (+ M) → HNO3. (R 13). The high reactivity of OH and HO2 radicals leads to short atmospheric lifetime with respectively ~ 1 s and ~ 100 s. Their chemistry does not involve transport and their steady state concentrations depend on the chemical composition and on the balance between the sources and sinks of the local environment. Thus, OH and HO2 concentrations in the troposphere vary depending on the location as well as meteorological conditions. The range of OH concentrations are from 105 up to 107 cm3,. while for HO2 the range of concentrations are from 107 to 108 cm-3. The ratio of. [HO2]/[OH] is an important parameter to quantify the oxidizing capacity of the atmosphere, i.e. the quantity of OH effectively available to initiate the destructive reactions of many hydrocarbons.. 1.2 Techniques for HOX and RO2 radical measurements. As mentioned above, the atmosphere is a very complex system and understanding all its processes is very difficult from only one type of study. Therefore, atmospheric studies. are. subdivided. into. several. areas. such. as. field. measurement,. emission/deposition/transport studies or model studies. Field measurements and models are intertwined as they contribute to improve the knowledge of tropospheric chemistry. Measurements have demonstrated a lack of understanding in tropospheric chemistry models, while models pointed out measurement errors. In recent field campaigns in biogenic environments, an overestimation of the measurements over the models indicate that the chemistry of peroxy radicals in low NOX environments is not. 8 © 2017 Tous droits réservés.. lilliad.univ-lille.fr.
(24) Thèse de Emmanuel Assaf, Lille 1, 2017. Chapter 1 HOX and RO2 radicals: chemistry and detection techniques. well understood [6]. In order to understand these discrepancies, laboratory kinetic measurements have to be carried out. Different measurement techniques for the quantification of OH and HO2 were reviewed in details [4]. The measurement of radicals is difficult because of their high reactivity with gases and surfaces. Highly sensitive detection techniques are needed in field measurements to determine the low concentrations of peroxy radicals, which are typically on the order of 108 cm-3 during the day. Few measurement techniques allows the quantification of OH in the atmosphere and are based either on spectroscopic techniques with Fluorescence Assay by Gas Expansion (FAGE) and Differential Optical Absorption Spectroscpy (DOAS), or on chemical techniques with Chemical Ionizaton Mass Spectrometry (CIMS, temporal resolution 30 s to 1 min), 14CO oxydation (temporal resolution 5 min), scrubbing using salicylic acid (temporal resolution 30 min to 90 min) or spin trapping (20 to 30 min [4]). It should be noted that for the chemical techniques, only the CIMS allows measuring with a high temporal resolution necessary to identify phenomena involving OH radicals because they have a short lifetime (on the order of a second) and a regenerated rapidly. Thus, only the FAGE, DOAS and CIMS techniques, which have similar performances in terms of limit of detection and temporal resolution, will be described below. Several measurement techniques exist for HOX measurements such as continuous-wave Cavity Ring-Down spectroscopy (cw-CRDS) or the chemical amplification methods with Peroxy Radical Chemical Amplification (PERCA). Most also allows the measurement of RO2 radicals according to the conditions of use. The Matrix Isolation Electron Spin Resonance Spectroscopy (MIESR) technique makes it possible to measure simultaneously and selectively different types of radicals such as HO2 or the sum of RO2 after the collection of the radicals on a cold matrix and, even if it is a sensitive method, this method is ex situ and will not be developed here. From all above techniques, only the three FAGE, PerCIMS and PERCA techniques have yet been deployed for measurement campaigns.. 9 © 2017 Tous droits réservés.. lilliad.univ-lille.fr.
(25) Thèse de Emmanuel Assaf, Lille 1, 2017. Chapter 1 HOX and RO2 radicals: chemistry and detection techniques. The above experimental techniques allowing the quantification of HOX and RO2 radicals are presented in the following section with their advantages, disadvantages and limits of detection and are summarized in Table 1.. 1.2.1 Chemical amplifier and mass spectroscopy systems 1.2.1.1. Peroxy Radical Chemical Amplifier (PERCA). The PERCA technique allows measuring the sum of HO2 and RO2 radicals and is used by various groups for field measurements. However, the discrimination between different species is not done. The ambient air is sucked into a chamber where a reaction cycle between OH and HO2 is initiated by the reaction of HO2 with NO followed by the addition of CO to convert OH back to HO2: RO2 + NO → RO + NO2. (R 14). RO + O2 → R’O + HO2. (R 15). HO2 + NO → OH + NO2. (R 16). OH + CO → H + CO2. (R 17). H + O2 (+M) → HO2. (R 18). NO2 is formed in the reaction (R 16) and amplified by the reaction cycle up to 50 to 150 times compared to the initial concentration of RO2 + HO2. NO2 concentration is usually measured by a chemiluminescence detector with luminol, by CRDS or by LIF. The signal caused by NO2 present in ambient air has to be subtracted from the signal due to NO2 concentration produced in the amplification process. The cycling between OH and HO2 radicals is fast because of the high CO mixing ratio around 10% in the reaction cell. The most problematic issue concerning PERCA instruments is the sensitivity to the relative water vapor content in sampled air [7], [8]. The interference. 10 © 2017 Tous droits réservés.. lilliad.univ-lille.fr.
(26) Thèse de Emmanuel Assaf, Lille 1, 2017. Chapter 1 HOX and RO2 radicals: chemistry and detection techniques. of water in the response of the PERCA can be up to 50% of the signal if the relative humidity changes about 50%. A new method [9] was developed in order to selectively measure HO2 and RO2 radicals based on a PERCA/LIF instrument. This method is based on the fact that losses through heterogeneous reactions are more important for HO2 compared to other peroxy radicals. The air is pumped through a pre-inlet filled with spherical glass beads where 90% of HO2 radicals are removed whereas the RO2 loss is only around 15%. The alternating measurement through the pre-inlet or not allows measuring either RO2 or the sum of RO2 + HO2. The detection limit for the concentration of RO2 for this instrument is around 0.25 to 1×107 cm-3 for 1 min of acquisition.. 1.2.1.2. Peroxy Radical Chemical Ionization Mass Spectroscopy (PerCIMS, ROxMas). In contrast to the PERCA instrument, the CIMS technique is based on the chemical conversion of OH into H2SO4 and HO2 by adding isotopically labeled SO2 instead of CO in presence of O2 through the reaction mechanism: OH + SO2 (+M) → HSO3. (R 19). HSO3 + O2 → SO3 + HO2. (R 20). SO3 + 2 H2O → H2SO4 + H2O. (R 21). During each cycle, one H2SO4 molecule is formed and converted into HSO4- by chemical ionization by NO3-, which are generated separately from the sample air and drawn through the sample by an electric field. The HSO4- and NO3- concentrations are then measured by MS, establishing an indirect method for OH radical concentration measurement. OH measurement time resolution with this system is typically 30 s with detection limit about 1×105 cm-3 [10] based on 5 min signal integration. With the FAGE technique, the CIMS is the only other technique deployed during field. 11 © 2017 Tous droits réservés.. lilliad.univ-lille.fr.
(27) Thèse de Emmanuel Assaf, Lille 1, 2017. Chapter 1 HOX and RO2 radicals: chemistry and detection techniques. campaigns for the measurement of OH. This technique is very sensitive to variation of NO concentration that converts HO2 into OH, and thus may overestimate the OH concentration, but this phenomenon is negligible at low NO concentration < 10 ppb. However, the PerCIMS instrument could also be used to measure the sum of HO2 + RO2 radical concentration using the same amplification conversion process of HO 2 and RO2 into H2SO4 by combining above reactions with NO (R 14)-(R 16) and SO2 (R 19) to (R 21). Here also, H2SO4 concentration is measured by CIMS. It is possible to differentiate HO2 and RO2 radicals using the dependence of the conversion efficiency of RO2 as a function of O2 and NO concentrations, allowing to measure the sum of HO2 + RO2 or only HO2. The detection sensitivity is independent of the water vapor concentration and a detection limit around 1×107 cm-3 [11] is reached at a temporal resolution of 10 s to 120 s. This method was used during a field campaign [12] in a forest and allowed to identify missing RO2 sources.. 1.2.2 Spectroscopic methods 1.2.2.1. Differential Optical Absorption Spectroscopy (DOAS). The quantification of OH radicals by DOAS technique is based on the extinction of UV light passing through a gas mixture. The concentration of OH is obtained via the BeerLambert law:. Equation 1. With I0 and I are the light intensity before and after transmission through the gas mixture, σOH,λ is the absorption cross-section of OH at the wavelength and spectral resolution used and L is the path length. 12 © 2017 Tous droits réservés.. lilliad.univ-lille.fr.
(28) Thèse de Emmanuel Assaf, Lille 1, 2017. Chapter 1 HOX and RO2 radicals: chemistry and detection techniques. The DOAS technique is composed of four elements: a light source whose luminance should be high enough due to the length of the absorption path and should have a homogeneous spectral profile in order to be selective, a multiple-reflection cell to improve the spatial resolution with a distance of several meters between the different mirrors allowing an absorption path length of several km in order to obtain a low limit of detection, a high resolution spectrograph to discriminate the different OH absorption lines, and a photodiode for the light detection. This technique is selfcalibrating, the absorption cross-sections of OH are known and thus the concentration of OH is obtained by the difference of light intensity before and after transmission. The absolute accuracy of this method is limited only by the accuracy of σOH,λ and L. The absorption cross-section σOH,λ is a function of the pressure, temperature and instrumental resolution and the value is known for OH with an accuracy of at minimum 8% [13], giving the accuracy of the DOAS technique. This technique needs a very long absorption path length to reach detection limits around 106 cm-3, resulting in a less spatially resolved technique than the FAGE. Only one DOAS instrument, installed in the SAPHIR chamber in Jülich, is currently operational in the world with a limit of detection of 7×106 cm-3 using a 20 m long optical multiplereflection cell [14].. 1.2.2.2 Laser Induced Fluorescence (LIF) and Fluorescence Assay by Gas Expansion (FAGE). The LIF technique has been used for indirect detection of HO2 and RO2. This technique is the basis of the FAGE technique where OH radicals are detected by LIF. In order to freeze all reactions of OH radicals and to have a sufficiently long fluorescence lifetime that depends strongly on quenching, the measurements are carried out at low pressure and low laser pulse energy, but high repetition rate. The FAGE technique uses 308 nm radiation to excite OH radicals, and the resulting fluorescence is detected also at 308 nm and applied to measure OH radicals. 13 © 2017 Tous droits réservés.. lilliad.univ-lille.fr.
(29) Thèse de Emmanuel Assaf, Lille 1, 2017. Chapter 1 HOX and RO2 radicals: chemistry and detection techniques. concentration as described in more details in Chapter 2. HO2 radicals cannot be detected directly by LIF and have to be converted into OH, which is detected with a high sensitivity by LIF. Thus, HO2 is measured simultaneously in a second detection cell where excess NO is added to the sampled gas leading to the conversion of HO 2 into OH. The organic peroxy radicals have also the potential to be chemically converted to OH via the reaction with NO producing HO2, which will further be converted to OH. The detection limit is typically around as 105 cm-3 for ambient OH radicals and 106 cm-3 for HO2 radicals [15], which makes the FAGE a well-adapted technique for field measurements due to its high sensitivity.. 1.2.2.3 Cavity Ring-Down Spectroscopy (CRDS). In the past, laboratory experiments have mostly used UV absorption for the detection of RO2 radicals. For example, the absorption spectrum of CH3O2 has been measured several times [16], [17] and a maximal absorption coefficient of 4.6×10⁻¹⁸ cm2 at 240 nm has been obtained. However, the absorption spectra of RO2 radicals in the UV region are broad and unstructured and do not offer a selective detection in the presence of other species. Another technique used for the detection of specific organic peroxy radicals is CRDS. This technique has only been applied in laboratory kinetics studies so far. CRDS is a specific kind of long path absorption spectroscopy where the transient absorption in a resonator is observed following the Beer-Lambert’s law. The long path improves the sensitivity of this technique, which is higher than that of conventional absorption spectroscopy. Peroxy radicals have a more structured and characteristic absorption features in the near-infrared region due to an A ← X transition [18]. The CH3O2 spectrum has already been measured in the wavelength range 7470 - 7500 cm-1 corresponding to the ν12 transition with a maximum absorption cross-section of 4.38×10⁻²⁰ cm2 at 7488.18 cm-1 [19]. Since then, the weak absorption spectra and cross-sections of many stables [20]–[23] and unstable species [24], [25] have been measured in the near-infrared region. The absorption spectrum. 14 © 2017 Tous droits réservés.. lilliad.univ-lille.fr.
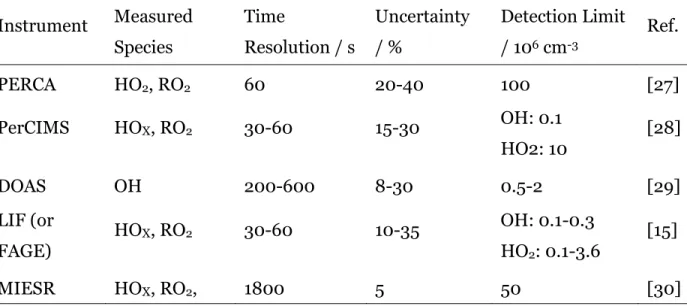
(30) Thèse de Emmanuel Assaf, Lille 1, 2017. Chapter 1 HOX and RO2 radicals: chemistry and detection techniques. of the 2ν1 band of HO2 radicals have been measured in the wavelength range 6604 – 6696 cm-1 and the strongest line observed in this region at 6638.20 cm-1 has an absorption cross-section of 2.72×10⁻¹⁹ cm2 at 50 Torr Helium. However, the absorption cross-sections of OH radicals in this wavelength range have not yet been determined and only theoretically obtained values are tabulated in the HITRAN database [26]. Neither a possible application of the CRDS in field measurement nor expected detection limits are discussed in the literature for RO2, HO2 or OH radicals. However, it is assumed that an identification of different organic peroxy radicals in a mixture can be achieved because of the specific structures of their absorption spectra in the near-infrared region. This is the main technique used during this work and its functioning principle will be described in details in Chapter 2.. Table 1: Non-exhaustive list of field measurement techniques for detection of HOX (HO2 + OH) and RO2 [4] Measured. Time. Uncertainty. Detection Limit. Species. Resolution / s. /%. / 106 cm-3. PERCA. HO2, RO2. 60. 20-40. 100. PerCIMS. HOX, RO2. 30-60. 15-30. Instrument. OH: 0.1. Ref. [27] [28]. HO2: 10 DOAS LIF (or. OH. 200-600. 8-30. HOX, RO2. 30-60. 10-35. FAGE) MIESR. 0.5-2 OH: 0.1-0.3. [29] [15]. HO2: 0.1-3.6 HOX, RO2,. 1800. 5. 50. [30]. NO2, NO3 1.2.3 Techniques for rate constant measurements in complex systems 1.2.3.1 Discharge Flow technique. The radical species are produced continuously with electric or microwave discharge within a fast flow system. The radicals are generated within a moveable injector and. 15 © 2017 Tous droits réservés.. lilliad.univ-lille.fr.
(31) Thèse de Emmanuel Assaf, Lille 1, 2017. Chapter 1 HOX and RO2 radicals: chemistry and detection techniques. then mixed with the reaction partner in the reactor. Both are highly diluted with the gas bath and are pumped at a high-speed through the injector and reactor. If the flow velocity along the tube is known, then changing the position of the movable injector into the flow tube controls the reaction time between the radical and the reactant. The radical concentration is detected at the end of the reactor, enabling the measurement the time-resolved concentration profiles. The reaction conditions are generally set such that the reaction occurs under pseudo first-order conditions: one of the reactant is in large excess over the second reactant and thus it can be considered that its concentration will be constant during the reaction. A major advantage of this technique is that the detection method does not need to be time resolved. However a drawback of this method is to well define the time zero of the reaction because of the undefined mixing time between the injector and reactor flows, and thus only slow reactions can be measured in order to keep this mixing time short compared to the time scale of the reaction. Also, this technique is limited to low-pressure experiments to obtain a laminar, well-mixed flow. Contributions from heterogeneous reactions on the wall can complicate the experiment and have to be taken into account, but can be minimized by coating the inner surface with an unreactive substance or by varying the diameter of the flow tube.. 1.2.3.2 Flash photolysis technique. The reactant and the precursors are mixed and introduced into the photolysis cell at an appropriate pressure depending on the detection techniques. The radicals are formed in the cell from the precursors through a photolysis pulse, either by a pulsed laser or a pulsed flash lamp. The evolution of their concentration can subsequently be followed by time-resolved detection techniques. The time scale of the reaction to be studied is determined by the duration of the photolysis pulse which must be short compared to the reaction time. It can be in a nanosecond time scale in the case of laser pulse or millisecond time scale for UV lamps. For studying extremely fast. 16 © 2017 Tous droits réservés.. lilliad.univ-lille.fr.
(32) Thèse de Emmanuel Assaf, Lille 1, 2017. Chapter 1 HOX and RO2 radicals: chemistry and detection techniques. reaction such as electron transfer processes, laser pulses as short as few femtoseconds may be also used. The advantage of this method is that the reactants are produced from well-mixed precursors and thus there is no mixing time reducing the time resolution. The time zero is easier to determine and correspond to the photolysis pulse. Also, because the reactants are generated and monitored at the center of the cell, the wall reactions are generally minimized. However, a suitable precursor is not always easily available and co-photolysis products may lead to complications. This is the technique employed during this work and will be described in details in Chapter 2.. 1.2.3.3 Relative rate technique. This method is based on the simultaneous monitoring of two or more reactant species relative to each other. The ratio of the decay rate of the investigated reactant with a given radical, for example ROX or HOX, is compared to the decay rate with a reference compound: HOX or ROX + Reactant → Products 1. (R 22). HOX or ROX + Reference → Products 2. (R 23). [HOX] or [ROX] is considered as constant between the reactions (R 22) and (R 23) and the rates can be written as: Equation 2. Equation 3 The integration and the combination of Equation 2 and Equation 3 lead to. 17 © 2017 Tous droits réservés.. lilliad.univ-lille.fr.
(33) Thèse de Emmanuel Assaf, Lille 1, 2017. Chapter 1 HOX and RO2 radicals: chemistry and detection techniques. Equation 4 During the measurements, the concentration of the reactant and the reference species are followed as a function of the time. A plot of should give a straight line with the slope being. as a function of . Thus, if the rate. constant of the reference reaction k(R 23) is known, then it is possible to determine k(R 22). The disadvantage of this method is that heterogeneous or unknown secondary reactions could occur leading to systematic errors in the rate constant. Also, the uncertainty in the rate constant of the reference reaction has to be taken into account. This experimental technique is often used in simulation chambers for kinetic measurements. In this thesis, a time-resolved experimental device has been set up for the measurement of RO2, HO2 and OH radicals in order to study the kinetics of elementary reactions involving them. A laser photolysis cell, which initiates the reaction by pulsed photolysis of a suitable precursor (e.g. H2O2 to form the OH radical), is coupled to two detection techniques: (i) OH radicals are detected by high repetition (10 kHz) LIF technique: this technique makes it possible to follow the evolution of the OH radicals concentration after the pulse of the photolysis laser with a temporal resolution of 100 μs. The use of such a high repetition laser for timeresolved measurements is still rare in the world. (ii) RO2, HO2 and OH radicals are detected by the cw-CRDS (continous-wave Cavity Ring-Down Spectroscopy) technique. This technique is a very sensitive absorption technique, based on the measurement of the rate decay of a light pulse trapped in an optical cavity. This ringdown time depends on the reflectivity of the mirrors (generally higher than 99.99%: the higher the reflectivity, the longer is the ring-down time because the photons make more round trip before escaping from the cavity), and on the concentration of absorbing species being present between the mirrors. The measurement of these ringdown times occurring at different delays with respect to the photolysis laser pulse makes it possible to determine the temporal profile of absorbing species, in out case. 18 © 2017 Tous droits réservés.. lilliad.univ-lille.fr.
(34) Thèse de Emmanuel Assaf, Lille 1, 2017. Chapter 1 HOX and RO2 radicals: chemistry and detection techniques. radicals. The coupling of these two techniques with an initiation of the reaction by laser pulse photolysis is unique in the world.. 19 © 2017 Tous droits réservés.. lilliad.univ-lille.fr.
(35) Thèse de Emmanuel Assaf, Lille 1, 2017. © 2017 Tous droits réservés.. lilliad.univ-lille.fr.
(36) Thèse de Emmanuel Assaf, Lille 1, 2017. Chapter 2. Experimental Technique. 2.1 General principles of the experimental techniques. Absorption spectroscopy is a well-adapted technique for the quantification of radicals inside a gaseous mixture. In order to carry out selective and sensitive measurements, it is judicious to operate in the near IR domain with a device including a multi-pass cell. This type of cell increases the distance traveled by the light through a gaseous mixture and amplifies the sensitivity of the absorbance measurement. The absorption path length is then a few tens of meters. Another approach is to employ high finesse optical cavities in order to increase the absorbance path length of the spectrometer to few kilometers. This chapter is dedicated to the description of one of such techniques: the continuous-wave Cavity Ring Down Spectroscopy (cw-CRDS). In the frame of this thesis, two such spectrometers were coupled to a photolysis cell, and a third detection system based on high repetition rate Laser Induced Fluorescence (LIF) was installed in the same photolysis reactor. The main approach developed for the measurements of radicals or molecular species will be described with notions of the absorption spectroscopy, optical cavity and cavity modes.. 2.1.1 Laser Induced Fluorescence technique (LIF). Laser Induced Fluorescence is one of the most sensitive and selective analytical technique and is applied widely for the measurements of atmospheric trace gases such as Cl, OH, NOX, HCHO or SO2. In this chapter, the fundamental principles of the LIF technique for the time resolved measurement of OH radicals is described. Most atoms and small molecules absorb strongly in the ultraviolet region resulting from their excitation from the ground electronic state S0 to excited electronic states Sn. The phenomenon of photoluminescence during the relaxation can be divided in. © 2017 Tous droits réservés.. lilliad.univ-lille.fr.
(37) Thèse de Emmanuel Assaf, Lille 1, 2017. Chapter 2 Experimental Technique. two categories, phosphorescence and fluorescence depending on the electronic configuration of the excited states. Fluorescence is the spontaneous emission of a photon between states with the same spin Sn S0. The lifetime of fluorescence is in general very short, 10-9 to 10-7 s. If the excited species undergoes first relaxation to a state of different spin, called intersystem crossing (ISC), then the photon emission occurs. between. two. states. with. different. spin.. This. emission. is. called. phosphorescence and lasts longer, 10-3 to 102 s. Non-radiative deactivation processes including internal conversion (IC), vibrational relaxation or quenching can also occur in the time range, 10-14 to 102 s. Absorption and fluorescence spectra are unique and are used to characterize selectively individual compounds. However, fluorescence techniques are in general less efficient for large molecules because quenching, IC and ISC relaxations are competitive with spontaneous emission. A Jablonski diagram given in Figure 2 can summarize these different excitation and relaxation processes.. Excited Simplet states. S2. 5 4 3 2. Vibrational energy states. 1. S1. 5 4 3 2. Excited Triplet state. T1. 1. Absorption (excitation) 10. -15. s. Internal conversion and vibrational -14. 5 4 3 2. relaxation 10 -10. -10. -9. s -7. Fluorescence 10 -10 s. 1. -3. 2. Phosphorescence 10 -10 s -10. S0. -8. Intersystem crossing 10 -10 s. 5 4 3 2. -7. 2. Quenching 10 -10 s. 1. Ground state Figure 2: Jablonski energy diagram [31]. 22 © 2017 Tous droits réservés.. lilliad.univ-lille.fr.
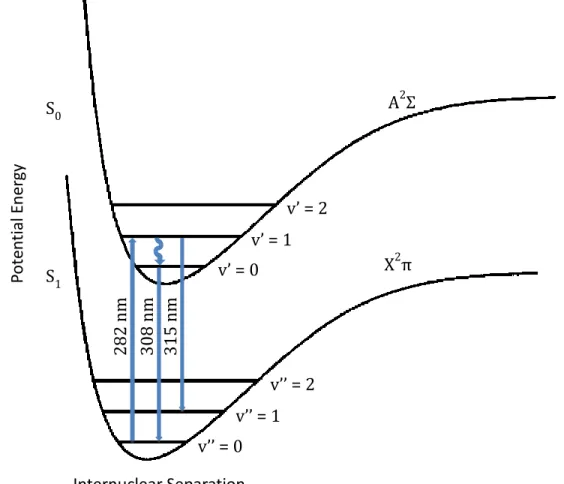
(38) Thèse de Emmanuel Assaf, Lille 1, 2017. Chapter 2 Experimental Technique. In the present work, LIF technique has been used to detect OH radicals. OH is excited from the v” = 0 vibrational bands of the ground electronic state X2π to the excited vibrational bands v’ = 1 of the first electronically excited state A2Σ near 282 nm. Two red shifted fluorescence bands can be detected near 308 nm and 315 nm (0-0 and 1-1 A-X transitions respectively). A schematic diagram of the OH detection by LIF is shown in Figure 3.. 2. AΣ. v’ = 2 v’ = 1 S1. 2. Xπ. v’ = 0 282 nm 308 nm 315 nm. Potential Energy. S0. v’’ = 2 v’’ = 1 v’’ = 0 Internuclear Separation Figure 3: Schematic diagram of the potential energy curves of the OH radical. Excitation and fluorescence (0-0 and 1-1) are represented at 282 nm, 308 nm and 315 nm respectively (adapted from [32]) The observed intensity of the fluorescence signal ILIF following the fluorescence excitation laser pulse depends on various parameters and can be linked to the concentration with the Equation 5 described by [33]:. 23 © 2017 Tous droits réservés.. lilliad.univ-lille.fr.
(39) Thèse de Emmanuel Assaf, Lille 1, 2017. Chapter 2 Experimental Technique. Equation 5 with θ the fluorescence quantum yield; σ the absorption cross-section of the absorbing species; [OH] concentration; G the light collection efficiency; ILaser the laser intensity The fluorescence quantum yield θ is the fraction of molecules in an excited electronic state that decay to ground state by fluorescence. θ depends on the spontaneous emission of fluorescence A, the quenching Q and other relaxation processes and can be defined with the Equation 6: Equation 6. Most of the time, LIF technique is used as a relative technique because performing quantitative fluorescence measurements of a given species requires detailed knowledge about the quenching of all the species present in the gas mixture. However, LIF is a very sensitive technique with a limit of detection around 106-107 molecules cm-3. It requires a basic setup: a laser source for excitation, optics to align the laser beam in the absorption medium, collection optics and a detector.. 2.1.2 Cavity Ring-Down Spectroscopy techniques (CRDS) 2.1.2.1 Introduction to optical cavity and cavity modes. An optical cavity (or resonator) is the arrangement of different optical components (e.g. mirrors, optical fibers or lens, filters, etc.) making the light circulating within a closed path. The simplest optical cavity is the linear cavity. It consists of two mirrors with a reflectivity R, a radius of curvature Rc, separated by a distance L and facing each other along the z-axis. The confinement of the light in this system imposes three conditions because the light must be identical during each return trip: (1) the. 24 © 2017 Tous droits réservés.. lilliad.univ-lille.fr.
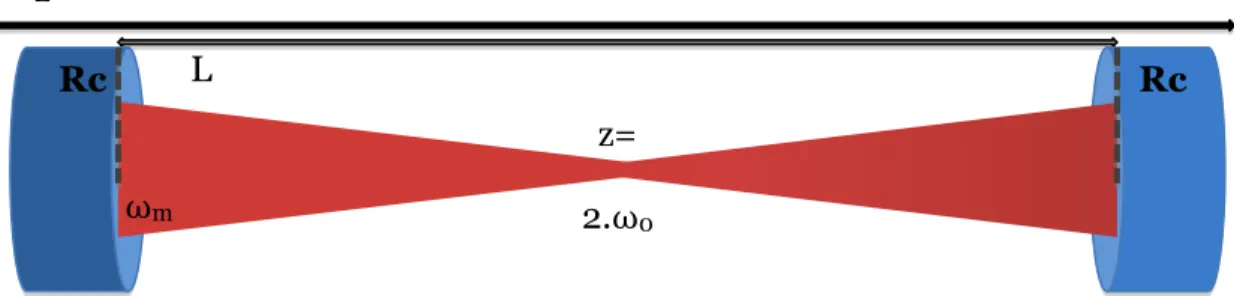
(40) Thèse de Emmanuel Assaf, Lille 1, 2017. Chapter 2 Experimental Technique. wavefront of the beam should spread along the z-axis, (2) the maximum of energy should be at the center of the mirror to neglect the losses by diffraction due to the finite size of the mirrors and (3) the covering of the light should be constructive for each path at certain wavelengths. As part of the paraxial approximation and from the Maxwell equations, the beam shape can be described as Gaussian beams and remains Gaussian during its propagation. Depending on the coordinate systems, higher-order transverse modes can be either Hermite-Gauss modes (for rectangular symmetry) or Laguerre-Gauss modes (for circular symmetry). The intensity distribution of the modes is described in the Figure 4. The cavity modes of the resonator TEM with qmn orders (m nodes in the x-direction, n nodes in the y-direction and q the fundamental mode number) are obtained by the approximation solutions. The mode with the lowest order in the transverse direction (m = n = 0) is called fundamental transverse mode or TEMq00.. Figure 4: Spatial repartition of the energy of high-order modes with rectangular symmetry (left) and circular symmetry (right) [34] The solutions obtained from Maxwell’s equations answered to the two first conditions of the modes of the cavity: the maximum of energy would spreads around the z-axis and at the center of the mirrors. The TEM00 is the mode with the lowest spatial shift limiting the losses by absorption, diffraction and diffusion. It can be considered that it has the highest lifespan, allowing the best spatial resolution and the maximum of sensitivity. Few parameters are necessary to describe the geometry of a fundamental mode TEM00 inside a linear optical cavity and to realize the mode matching: the beam waist dimension ω0, the radius of the beam on the mirrors surface ωm and the Rayleigh range z0 indicating the length of collimation of the beam.. 25 © 2017 Tous droits réservés.. lilliad.univ-lille.fr.
(41) Thèse de Emmanuel Assaf, Lille 1, 2017. Chapter 2 Experimental Technique. z L. Rc. Rc z=. ωm. 0 2.ω0. Figure 5: Schematic shape of the fundamental mode TEM00 inside a linear optical cavity For a confocal cavity composed of two identical mirrors illustrated in Figure 5, these three parameters are given in Equation 7 to Equation 9: Equation 7. Equation 8. Equation 9. When a laser beam with the energy Einc is injected into the cavity, it is decomposed in different transverse modes at the energy Em,n weighted by the spatial coupling coefficient εm,n though the Equation 10: Equation 10. The perfect mode matching of the TEM00 is for a spatial coupling ε(0,0) = 1. The third condition is that the covering of the light interferes constructively at each round trip inside the cavity. Thus, the phase difference at each crossing of the resonator should be an integer multiple of π. This frequency of resonance νq,lm. 26 © 2017 Tous droits réservés.. lilliad.univ-lille.fr.
(42) Thèse de Emmanuel Assaf, Lille 1, 2017. Chapter 2 Experimental Technique. depends on the m and n orders of the transverse mode and can be calculated from the Equation 11: Equation 11 With c the velocity of light For each transverse mode (m,n) exists an infinity of longitudinal modes q. The difference of frequency between two successive fundamental modes of the cavity (TEMq,mn and TEMq+1,mn) is called Free Spectral Range (FSR).. The FSR can be. determined as shown in Equation 12: Equation 12 With ng the group index If the cavity length L is a multiple of half the wavelength λ, then the light trapped inside the cavity follows constructive interferences, meaning that at least one mode of the cavity will be in resonance with the wavelength of the beam. Equation 13. A simple schematic of the mode structure inside the cavity is shown in Figure 6.. TEMq,mn. TEMq+1,mn. TEMq+2,mn. TEMq+3,mn FSR. Highorder. ν. modes. Figure 6: Mode structure inside a cavity.. 27 © 2017 Tous droits réservés.. lilliad.univ-lille.fr.
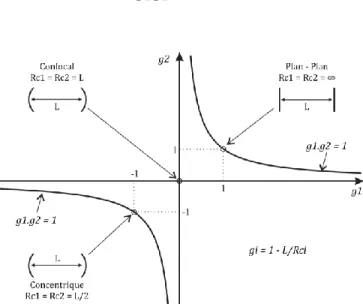
(43) Thèse de Emmanuel Assaf, Lille 1, 2017. Chapter 2 Experimental Technique. For the light to be confined at the center of the cavity, its geometry should respect some stability criterions. The cavity parameters g1 and g2 are defined as a function of the cavity length L and the radius of curvature of the mirrors Rc1 and Rc2 through the Equation 14: and. Equation 14. It can be noted that Rc1 and Rc2 are positive for concave mirrors and negative for convex mirrors. The condition of stability of an optical linear cavity with two mirrors can be obtained from transfer matrices (or ABCD law) in Equation 15: Equation 15. Figure 7: Conditions of stability of a linear optical cavity. g1 and g2 represents the geometrical parameters of the cavity. The different stable configurations can be visualized for different types of cavities in Figure 7. The zone of stability is between the curves g1.g2 = 1 and g1 and g2 axes. Three configurations can be distinguished at the limit of stability: plan-plan with Rc1 = Rc2 = ∞, confocal with Rc1 = Rc2 = L and concentric with Rc1 = Rc2 = L/2. Thus, for a linear cavity made with two mirrors with the same radius of curvature Rc1 = Rc2, the cavity stays stable if its length is lower than twice the radius of curvature L≤2Rc.. 28 © 2017 Tous droits réservés.. lilliad.univ-lille.fr.
(44) Thèse de Emmanuel Assaf, Lille 1, 2017. Chapter 2 Experimental Technique. 2.1.2.2 Principles of Cavity Ring-Down Spectroscopy. The Cavity Ring-Down Spectroscopy (CRDS) is a highly sensitive technique developed with the emergence of high reflectivity dielectric mirrors. The first studies using this type of mirrors in an enhanced cavity configuration were designed to accurately measure their reflectivity. In 1984, Anderson et al. [35] observed for the first time the exponential decrease of the light intensity transmitted by a resonant cavity. They established the connection between the light decay of the cavity and the losses through the mirrors allowing determining their reflectivity. This work was followed by the first study on cavity ring-down spectroscopy in 1988 by O’Keefe and Deacon [36] who experimentally verified that the light decay is not only due to the losses through the mirrors but also to absorption of species inside the cavity. Using a pulsed laser they showed that this technique could be used to measure precisely and directly the absorption coefficient of a given species. Thus, compared to the majority of absorption spectroscopic techniques where the molecular absorption is deduced from the variation of light intensity between the entrance and the exit of an absorbing cell, in the case of CRDS it is the decay rate of light inside an enhanced absorption cavity that is measured. In 1996, Lehmann [37] proposed the possibility to use continuous light sources such as diode lasers. Compared to pulse lasers, diode lasers are spectrally finer which allow the mono-mode excitation in an optical cavity. This technique also presents the advantages to increase the selectivity of detection and make more compact systems. In the present thesis, cw-CRDS coupled to laser photolysis is used to detect different peroxy radicals (RO2 with R = H, D, CH3, C2H5, etc.), hydroxyl radical OH, or stable molecules. The basic theory of CRDS technique is explained here.. 29 © 2017 Tous droits réservés.. lilliad.univ-lille.fr.
(45) Thèse de Emmanuel Assaf, Lille 1, 2017. Chapter 2 Experimental Technique. 2.1.2.2.1 CRDS in an empty cavity. The principle of the cavity ring-down spectroscopy is based on the measurement of the lifetime of photons from a pulsed or a continuous laser trapped into an enhanced optical cavity composed of two mirrors M (with a reflectivity Rc) separated by a distance L. This principle is illustrated in Figure 8.. Figure 8: Schematic of principle of the CRDS technique. The incoming laser beam with an intensity Iini is injected thought the front mirror and only a small fraction of the photons enter inside the cavity. The other part is reflected at the entrance. Then, the beam is reflected on both mirrors and at each round trip a part of the light is transmitted through both mirrors. In the ideal case where the beam loss is only due to the transmission through the mirrors, the intensity exiting at the cavity through the rear mirror Iout can be characterized by a succession of n impulsions decreasing exponentially. It can be defined as the Equation 16:. Equation 16 With Rc = 1-T and n the number of round trips Because the coefficient of reflectivity Rc is close to 1 it is possible to use the approximation ln(Rc) ≈ -(1-Rc). The Equation 16 can then be written as:. 30 © 2017 Tous droits réservés.. lilliad.univ-lille.fr.
(46) Thèse de Emmanuel Assaf, Lille 1, 2017. Chapter 2 Experimental Technique. Equation 17. The number of round trips n can be defined as a function of the time t: Equation 18 With the round trip time. Thus, substituting n into Equation 17 gives:. Equation 19. The residence time or ring-down time τ corresponds to the time when the intensity Iout is divided by e. This ring-down time statistically represents the average residence time of a photon inside the cavity. In an empty cavity, the ring-down time τ0 (in s) is equal to: Equation 20. This parameter τ0 is directly measured during the CRDS experiments.. 2.1.2.2.2 CRDS in a cavity containing an absorbent. If absorbing species are present inside the cavity, additional losses due to absorption result in a faster exponential decay. Considering species with a concentration N (in. 31 © 2017 Tous droits réservés.. lilliad.univ-lille.fr.
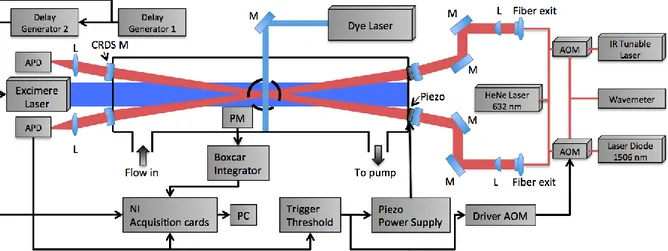
(47) Thèse de Emmanuel Assaf, Lille 1, 2017. Chapter 2 Experimental Technique. molecules.cm-3) and an absorption cross-section σ (in cm2), the ring-down time τabs (in s) can be written as: Equation 21 With l the absorption path length in cm Using the Equation 20 and Equation 21, the absorption coefficient α can be obtained as: Equation 22 With Rl the ratio between the cavity length L and the absorption path length l The absorption spectrum can be obtained by measuring the absorption coefficient α as a function of the wavelength for tunable lasers. Knowing the absorption crosssection of a given compound at a particular wavelength, its absolute concentration can be calculated by measuring τabs and τ0.. 2.2 Instrumentation and development. The experimental technique has been improved in the frame of this thesis and is based on a version of a setup that has been described in previous publications [38]– [40]. The experiment consists of a photolysis cell coupled to high repetition laser induced fluorescence (LIF) and the continuous wave cavity ring-down spectroscopy (cw-CRDS) measurement techniques. The reaction cell is a stainless steel cross, coated internally with Teflon, with on the vertical plan four short arms (two used for passing the LIF excitation laser and one for detection of fluorescence) and on the horizontal plan two long arms (total length of 70 cm) where the photolysis beam propagates and where the cw-CRDS techniques are installed. The radicals are generated inside the reactor by laser photolysis and three species can be detected. 32 © 2017 Tous droits réservés.. lilliad.univ-lille.fr.
(48) Thèse de Emmanuel Assaf, Lille 1, 2017. Chapter 2 Experimental Technique. simultaneously by LIF and cw-CRDS. A detailed schematic view of the set-up is represented in Figure 9. The aim of this chapter is to provide a detailed description of the three main parts of the instruments and experimental techniques: (i) the photolysis system materialized by the excimer laser and the reactor, (ii) the LIF system and (iii) the two cw-CRDS systems.. Figure 9: Schematic view of the experimental set-up: APD: Avalanche Photo Diode; AOM: Acousto-Optic Modulator; M: Mirror; L: Lens; PM: PhotoMultiplier. Separate but identical trigger circuits and data acquisition systems are used for both cw-CRDS systems but are shown for only one path in the figure for clarity. 2.2.1 Reactor and photolysis system 2.2.1.1 Photolysis cell. The photolysis cell is built with six stainless steel tubes assembled according to three perpendicular axes XYZ, one long (X = 71.8 cm) and two short (Y and Z = 27 cm), forming a three dimensional cross. The tubes are connected through a cubic central structure. The internal diameter of each tube is 6 cm and they are internally coated with Teflon to reduce deterioration of the surface due to aggressive chemicals. The conception of the extremities of the tubes seals the reactor and fulfills more specific. 33 © 2017 Tous droits réservés.. lilliad.univ-lille.fr.
(49) Thèse de Emmanuel Assaf, Lille 1, 2017. Chapter 2 Experimental Technique. functions detailed below. The schematic representation of the photolysis cell is shown in Figure 10.. Figure 10: Schematic representation of the photolysis cell The X-axis is used for the CRDS detection and the photolysis laser and the Y and Zaxis are used for the LIF excitation and detection, respectively. The flanges at the end of the X-axis were redesigned as shown in Figure 11. Besides sealing the cell, they allow the entrance of the photolysis beam though a 3 cm diameter quartz window, transparent for UV. The junction between the CRDS mirror and the flange has an angle of 4°. The flange was conceived to maximize the overlap distance between the volume where the radicals are generated by laser photolysis and the inner-cavity CRDS laser beam. The geometrical calculated overlap distance is 36 cm. A constant flow of helium passes though an additional tube of 2 mm inner diameter soldered to the part 1 to protect the mirrors from dust or corrosive gases. Two CRDS mirror holders (part 2) can now be fixed directly on the flange and not to the optical table as in the earlier version, which improves the stability of the CRDS. The connection between parts 1 and 2 uses an O-ring to seal the cell. Four screws are pushing on the O-ring, allowing enough movement to align the CRDS mirrors. The alignment procedure of the CRDS cavity is described below. The piezo (described below) links the mirror holder (part 2) and the mirror box (part 3). The mirror box can be removed for cleaning purposes without changing the alignment of the CRDS cavity.. 34 © 2017 Tous droits réservés.. lilliad.univ-lille.fr.
Figure
+7
![Figure 19: Schematic of the working principle of the Fabry-Pérot interferometer [45]](https://thumb-eu.123doks.com/thumbv2/123doknet/3684566.109226/59.918.256.718.647.849/figure-schematic-working-principle-fabry-pérot-interferometer.webp)
Documents relatifs
The ignition delay times of stoichiometric 1,3‐dioxolane/O 2 /inert mixtures were measured in a
L’archive ouverte pluridisciplinaire HAL, est destinée au dépôt et à la diffusion de documents scientifiques de niveau recherche, publiés ou non, émanant des
STUDY OF X-RAY LASER SCHEMES USING NEW EXPERIMENTAL FACILITIES AT THE RUTHERFORD APPLETON LABORATORY
L’archive ouverte pluridisciplinaire HAL, est destinée au dépôt et à la diffusion de documents scientifiques de niveau recherche, publiés ou non, émanant des
X ray spectra in the range 5 - 8 A and 15 - 300 A recorded respectively by means of flat TlaP and grazing incidence spectrographs gave some experi- mental evidence
La vision de Michel Houellebecq telle qu’il la déplie dans ce roman semble suivre les diffé- rentes étapes de la philosophie du XX e siècle dans son exploration de la
In this section, the evolution of vacancy defects distribution after annealing in Y and (including during the RT storage) O implanted samples is discussed. The effect of
To test the effect of increasing the VT contribu- tion, the product rotational state, Jminl predicted by the minimum energy defect as- sumption was decreased by 50% for all VR,
Wich the technique of tmnsilluxnination microscopy in vivo (Knisely) we could conclude that the lymphatic system within the wound regenerated muchquicker with
