HAL Id: hal-02191373
https://hal-lara.archives-ouvertes.fr/hal-02191373
Submitted on 23 Jul 2019HAL is a multi-disciplinary open access
archive for the deposit and dissemination of sci-entific research documents, whether they are pub-lished or not. The documents may come from teaching and research institutions in France or abroad, or from public or private research centers.
L’archive ouverte pluridisciplinaire HAL, est destinée au dépôt et à la diffusion de documents scientifiques de niveau recherche, publiés ou non, émanant des établissements d’enseignement et de recherche français ou étrangers, des laboratoires publics ou privés.
B. Nutten, P. Amayenc, M. Chong, D. Hauser, F. Roux, J. Testud
To cite this version:
B. Nutten, P. Amayenc, M. Chong, D. Hauser, F. Roux, et al.. The RONSARD radars : a versatile C band dual Doppler facility. [Research Report] Note technique CRPE n° 69, Centre de recherches en physique de l’environnement terrestre et planétaire (CRPE). 1979, 36 p. �hal-02191373�
NT/CRPE/69
THE RONSARD RADARS : A VERSATILE C BAND DUAL DOPPLER FACILITY
par
B. NUTTEN, P. AMAYENC, M. CHONG D. HAUSER, F. ROUX, J. TESTUD
CRPE/ETE
38-40 rue du Général Leclerc 92131 - ISSY-les-MOULINEAUX
Le directeur adjoint duXRPE
I. REVAH
L'Ingénieur en Chef chargé du département ETE
In this paper the authors describe a System of two Doppler radars (the RONSARD System) operated for the study of precipitating clouds (fronts and convective storms).
In a first part, emphasis is placed on the System requirements concerning both transportability and flexibility, due to the wide range of atmosphère phenomena to be observed. Thèse requirements lead to an original
implementation of the aerial, to a spécial design of the receiving chain (dual polarization capability, wide dynamic range, absolute self calibration capability) and to the implementation of real time digital subsystems (Amplitude and Phase Memory, Ground clutter cancellor, Fourier Transform processor,
Ambiguous Velocity corrector and a Spectrum Moment Computer).
The second part is devoted to a brief review of the scientific programs involving the RONSARD System and to the présentation of some prelimi- nary results.
I - INTRODUCTION
RONSARD* is a versatile C band dual Doppler radar System operated by the Centre de Recherches en Physique de l'Environnement (CRPE), a common laboratory of Centre National de la Recherche Scientifique and Centre National d'Etudes des Télécommunications, for atmospheric studies**. Many puise cohérent radars hâve been described in the literature and, in some ways the RONSARD radars, whose main characteristics are given in table 1, are comparable to other equipments.
However, some unique characteristics of this System are worth being emphasized, particularly those concerning the installation and operating procé- dures, the receiver and the real time data processing unit.
It will be shown in section 1 that spécial care has been exercised to achieve transportability and reliability, the conséquences of which hâve been a spécial aerial design and a fully digital signal processor. For instance, RONSARD uses magnetron transmitter and a digital phase memory instead of the conventional STALO-COHO method for obtaining cohérence. In addition, high data compression requirement led to implementation of hardware real time digital susbsystems.
Section 2 is devoted to a brief review of the CRPE scientific programs based on the RONSARD System and to the présentation of a few prelimi- nary results.
*Ronsard is an acronym for Recherche sur les Orages et les Nuages par un Système Associé de Radar Doppler.
**The RONSARD System, funded by the Délégation Générale à la Recherche Scientifique et Technique, the Centre National d'Etudes des Télécommunications and the Institut National d'Astronomie et de Géophysique, has been built by the Laboratoire Central de Télécommunications.
SECTION 1
A - RADAR CONFIGURATION
Each of the two tdentical radars consists of two transportable subsystems. One is a trailer (figure 1) supporting the fully steerable antenna as well as the transmitter and receiver boxes attached behind the antenna. The full azimuthal motion is limited to a 720° scan. This design éliminâtes all Radio Frequency (RF) and Intermediate Frequency (IF) rotary joints thus improving the reliability of the equipment.
The two V-shaped wings fixed behind the antenna are designed to dynamically balance the aerial against differential wind forces, thus reducing the necessary power and the weight of the servo-motors. The second part of each radar is a transportable shelter (figure 2) containing the control desk, the processor, and the on-line mini-computer.
The time needed to install the equipments on site, assuming that hard horizontal platforms are available, is of the order of three days for each radar ; it consists of assembling the antenna and wings, positioning the trailers,
connecting cables, and testing the System.
B - PRINCIPAL CHARACTERISTICS OF THE RECEIVER
1. Dual polarization capability
A 450° K overall effective noise température measured at the antenna port is achieved by use of a two stage-120° K parametric amplifier. The addi- tional noise is due to various wave guide losses between the feed horn and receiver caused by the dual polarization circuitry. Figure 3a shows the RF stages of the radar with an orthomode coupler and a polarization switch,
by dismounting and reassembling RF circuitry (time needed for this opération : about 30').
2.
Automatic gain control
A large dynamic range is obtained by the action of a fast Automatic Gain Control (AGC) achieving a "floating point" architecture whose exponent is the AGC factor. A 1 ps response time allows full gain control between two successive range gâtes. Thus AGC maintainsthe received echoe intensity within an interval approximately 9 dB wide. This is an important feature for dealing with the calibration problems. The AGC circuitry sets a 6 dB quantized PIN-diode attenuator, allowing 48 dB gain control. Moreover, when the echoe intensity approaches the saturation level, the parametric amplifiers are automatically switched-off, and their 30 dB gain is replaced by a 2 dB insertion loss. The total AGC dynamic range is increased to 80 dB, and the total linear receiver dynamic range is increased to more than 110 dB.
The timing of the AGC can be described as follows. The signal in each range gâte is processed independently according to an elementary cycle of 64 transmitted puises (22,44 or 88 ms depending upon the PRF). This cycle is divided into two phases :
Fast loop
During each of the first eight soundings of the cycle, the receiver gain is decreased of one (or two) 6 dB steps depending upon the signal inten- sity compared to two thresholds set equal to 6 dB and OdBunder the saturation level of the coders. After this, the gain has been decreased of up to 80 dB.
Slow loop
From the 9 to the 64 sounding of the cycle, the gain is held in the range gâte thus allowing a valid measurement of the intensity.. Simul- taneously, an estimate of the mean signal intensity is computed in a digital video integrator.
Assuming that the 64 range gâtes are kept identical
during the following cycle, the gain tn the choosen gâte is then kept constant or increased of one 6 dB step for the next cycle if the mean signal intensity is respectively over or under a threshold set 12 dB under the saturation level. So, taking advantage of signal stationnarity, the gain in each range gâte is estimated from cycle to cycle according to the mean signal intensity, but is rapidly adjusted in cases of increasing reflectivities.
On the contrary, if the ranges of the observed gâtes differ duringthe following cycle, the AGC values are reset to zéro (i.e. the gains in all range gâtes are initialized to thetr maximum value).
The RONSARD receiver extended dynamic range is illustrated in figure 5 showing power measurements obtained with an echo-box.
3- §§lf-Ç_ll_!T_îiQ9__-_,E_._liliîI
Another interesting feature, which is important for reflectivity measurements, is the self-calibrating capability. Every 40 seconds, a known signal from a température stabilized source oscillating at the transmitter frequency ("t 50kFG) is fed to the input of the parametric amplifiers with a fixed AGC value. The power measurement at the output of the receiver is sent to the computer which controls a 6 dB PIN diode RF attenuator. This feed-back is designed to conterbalance the drift of various RF or IF amplifiers and keeps the overall gain constant (within .5 dB) when the external température varies between -20 to 50°C.
C - PRINCIPAL CHARACTERISTICS Of THE PROCESSOR
1. Çomp_]_ex_video_p_rocessor
The RONSARD processor is designed for handling complex video signais. After mixing with an RF local oscillator (fig 3a) the returned signal is mixed with the output of a free running 60 MHz osctllator (fig 3b),the frequency of which equals that of the receiver IF. This standard super-heterodyne design is modified since the IF signal is mixed with two IF oscillator outputs with 90° phase
shift. Thus the two zéro frequency signais delivered by the IF mixers can be considered as quadrature components (I and Q) of the complex video signal.
This design doubles the Nyquist frequency (f hère instead of fr/2 for classical pulsed Doppler radars) and retains the sign of the Doppler frequency.
2. _\_,_li________________l__Ç_!_!
The standard cohérent oscillation (COHO) of conventional Doppler radars with magnetron transmittersis replaced by a fully digital subsystem called the Amplitude and Phase Memory (APM) (figure 6). This APM performs both phase adjustment of the sampled complex video signal in each range gâte and the correction of amplitude fluctuations of the transmitted signal :
A sample of the transmitted pulse is mixed with the local oscillator and connected to the IF mixers for 5 ps following the radar trigger. After this, the switch passes the returned signal to the mixers. Since the part of the transmitted pulse and the returned signal are processed by the same low-pass filters, the amplitude and phase fluctuations of the transmitted wave are eliminated, as well as the amplitude and phase of the returned intensity. In both cases, only one complex intensity value is obtained and is associated to the mean amplitude and phase of the signal (transmitted or received) during the range gâte.
The computing time of this device, according to an algorithm
detailed in fig. 6, is of course lower than the minimum 1 ys interval between two successive range gâtes. The APM is a reliable device due to its solid state design.
3. Ground_çlutter_çançel]_or
Another subsystem of interest is a recursive digital filter designed to eliminate echoes from fixed targets. This low frequency canceller is imple- mented in the time domain in order to allow the recording for spécial purposes
(see section 2, Soundings at vertical incidence) of filtered time séries.
A multiplication in the frequency domain (after the discrète Fourier Transform), in spite of a lower cost, would not hâve offered that opportunity.
Three eut off frequencies (20, 40 or 60 Hz) and two si opes
(40 or 80 dB/decade corresponding to a two or four pôles transfer function) can be selected, and the whole circuit can be by-passed if necessary.
4. ABBroximate_Fguri er_Transf ormer
An approximate Fourier Transformer, based on the DFT algorithm, can process the 64 points complex time séries for 64 simultaneous range gâtes in 22 ms. This high performance is obtained by a coarse quantization of the sinus and cosinus functions in the table of the DFT. Thèse functions take successively the following values : -1, -1/2, +1/2 and 1. So all multiplications of the true DFT are replaced by one-bits shifts thus increasing the computing speed of the device.
The effects of that quantization can be seen by considering that the unit circle is replaced by discrète points made with the 8 vertex of a circumscribed octagon (fig. 7a,b). The resuit is a 1.25 power gain and additive noise. However, spurious spectrum lines are maintained at least
13 dB below the main spectrum line amplitude. Prior to calculating the spectral moments, a threshold at -12 dB from the peak is used to guarantee that the
clutter due to approximate DFT does not appear in the estimated signal spectrum. (Fig. 7c, d)
5. Moments_çomguter
The data flow at the output of the analog-to-digital converters is about 3.0 M bit s" for highest PRF. This is the results of 64 dual conversions with 8 bits coders 2 928 times per sec.
After computation of the Power Spectrum Density when, thanks to
the use of ping-pong memory, no data are missed, 64 power spectra of 64 x 10 bits lines are obtained every 22 ms. So the data flow remains about 1.9 Mbit s
which is quite demanding for standard magnetic tape recorders. Data compression is achieved in a post-processor that computes the first three moments MO' M, and
M2 of the PSD. Even after addition of some house-keeping data (time, antenna coordinates, AGC's ) the data flow is reduced to 0.12 Mbit s which is compa- tible with standard 20 K byte s recorders acquisition rate.
The three moments and the AGC value in each range gâte are used to compute both the reflectivity factor and the radial velocity of the scatterers.
The second moment of the PSD leads to a measurement of the spectrum variance which, until now, has mainly been used for élimination of spurious echoes. A variance threshold, adjusted to 5 m 2 s -2 for treatment of frontal Systems data, is used at this time for eliminating :
i - régions with no écho (radar noise only),
ii - multiple trip returns characterised by a high reflectivity factor and a white-noise type spectrum.
6. Ambiguous_velgçity_çorreçtor
The radial velocity and the velocity variance are derived from straightforward algorithms computing the mean frequency and variance of power spectra :
Thèse estimators provide erroneous measurements of the mean velocity and variance when the central line of the spectrum approaches the limits of unambiguous domain as illustrated in the figure 8a :
- The mean velocity is found close to 0,
- The variance is significantly overestimated.
A real time subsystem, Ambiguous Velocity Corrector has been imple- mented to increase the post processor efficiency, for data approaching the limits of the velocity domain. It opérâtes as follows : the overall zéro order moment of the spectrum Mo and the part of this moment M« contained in two spectral window (fig. 8a) containing the extrême lines of the spectrum are computed simultaneously according to the following équations :
where
S. are the spectral lines of the PSD.
A -rr�� k test (with 0 �k �1) is then used for detecting spectra where ambiguous velocity values are expected. In such a case, assuming f is the puise répétition frequency, a f /2 shift is applied on the PSD lines before computing the first and second moments. This procédure allows a valid compu- tation of the radial velocity and the variance (fig. 8b) if the folded spectrum is correctly detected. This subsystem is still under test with a k = 0.5
threshold.
PPP VersusDFT wJththreshold
The RONSARD radars project was started in 1972, just before the great development of Puise Pair Processors (PPP) [2,8], which can estimate spectral moments without calculating the complète Doppler spectrum. Analyzing the Fourier Transform (FT) with threshold and covariance techniques for frequency measurements [9], we find a definite superiority of PPP for low signal-to-noise ratios (�0 dB) mainly due to the poor behavior of the FT
technique when the spectrum central frequency approaches the Nyquist frequency.
In addition, thanks to its simpler algorithm offering an increased number of range gâtes at a lower cost, the second technique has subsequently grown to a wide extent in meteorological Doppler radars.
Yet, some points should be clarified, particularly concerning the PPP and FT behaviour when data with multiple peak spectra (eg spectra of meteoro- logical echoes mixed with ground clutter, or multiple trip returns, are processed.
i - In case of multiple peak spectra, it clearly appears that both methods yield erroneous measurements of the radial velocity. It should be noticed however that the good estimate of the variance in the FT case allows a straight- forward élimination of the spurious data.
On the contrary the variance estimator [2,9] most commonly used as well as the three lags estimator proposed recently [10 , 13]lead to an underestimated variance value. Thus the erroneous velocities caused by fixed echoes may not be detected as reliably as they can be with FT processing, if clutter suppression techniques are not employed.
Moreover, the PPP mean velocity estimator is sensitive even to a low intensity secondary peak in the spectrum. Thus, due to leakages of digital high pass filters, advantage cannot really be taken of fixed target canceller implementations. In any case, covariance argument techniques used for variance estimations imply an assumption concerning spectra shapes (usually "Gaussian") which is unacceptable in case of multi-mode spectra.
ii - When processing poor signal-to-noise ratio spectra, the velocity estimator based on FT technique has poor results mainly because of biasing at Nyquist interval. In case of RONSARD radars, this particular disadvantage is partly overcome since spectra approaching the Nyquist interval are detected and shifted (see § C.6).
However the disadvantage of FT method mainly appears when handling multiple trip returns mixed with unambiguous signais : the -12 dB threshold operated on such a spectrum is strongly exceeded since the multiple trip return behaves as an uncorrelated noise with high intensity, generaly yielding a very low signal-to-noise ratio.
The FT estimator delivers a close to zéro velocity estimate while PPP has a correct radial velocity estimate if the signal-to-noise ratio keeps greater than 0 dB [9].
But, whatever is the origin of spectrum broadening (radar noise or multiple return echoes) the FT estimate of the variance exceeds the previously mentionned variance threshold and the associated mean velocity is eliminated. On the contrary, covariance argument variance estimators
cannot easily yield a cohérent power test. This is a major advantage of FT technique whichclearly appears when one attempt the intégration of continuity équation in order to retrieve the tri-dimensional wind field from dual Doppler measurements (see section 2), since the method is very sensitive to spurious data.
The previous discussion leads to the conclusion that, in spite of low cost advantage, Puise Pair Processors hâve deficiencies for certain types of data which Fourier Transform techniques with ambiguous velocity correctors naturally overcome (incorrect multiple peaksspectrum processing, déficient erroneous data rejection when handling multiple return echoes). The benefit of the Fourier transform technique,with its spurious data elimi- nation capability, is however counterbalanced by higher complexity and cost.
SECTION 2
The flexibility of the RONSARD System is the resuit of both the
radars design and of the spécial receiver and data processing. A short descrip- tion of typical procédures for observing air motions, and various examples of preliminary scientific results are given below.
A - OBSERVATIONAL PROCEDURES
Three types of méthodologies are used for investigation of the air motions and précipitation characteristics ; they correspond to three methods of analysis of the observational data.
1. Conical-scanninq (single radar methodology - Typical exploration time : 7 minutes)
Hemispherical exploration is performed through full 360° scannings at various fixed élévation angles and with typical ranges of .8 - 100 km. The method described by Browning-Wexler [4] , extended to the case of non
uniform distributions of tracers [il] , is used for radial velocity analysis. It provides vertical profiles of the mean horizontal velocity Vu and divergence div
Vn at scales of about 40 km. In addition, the vertical velocity may be obtained by the intégration of the continuity équation under the anelastic approximation. This method was used in observations of stratiform précipi- tation associated with frontal Systems [il] .
Figure 9 shows the horizontal wind field in the vicinity of a cold front as deduced from the conical scanning methodology. Isocontours of cross front velocity (upper diagram) and long front velocity (lower diagram) are displayed in a référence frame moving with the front.
and with intense vertical ascent. The rain bands are found stationary in the frame moving with the front.
2. Ççpjan (Dual radar methodology - Typical exploration time : 3 minutes)
This classical methodology, adapted for investigation of three dimensional convective motions associated with storms or showers, was first proposed by Lhermitte [7 ]. The interpolation program (needed to analyze dual Doppler data on a common grid) that is used with RONSARD data yields a three dimensional wind field over a typical 50 x 50 x 10 km volume with a resolution of 1 x 1 x .5 km. This basic technique has been improved to allow a correct retrieval of the first derivative of the wind field which leads to the compu- tation of the vertical air accélération derived from standard hydrodynamic équations and thus to the buoyancy force.
Figure 10 illustrâtes the convective wind field observed in a shower using the coplan methodology. A vertical cross section of the wind field is exhtbited, superimposed on isocontours of the vertical accélération.
3. Soundinqs-at-vertical incidence (single radar methodology - Typical
resolution range : minimum altitude = 800 m, altitude resolution = 200 m - Typical time needed for a 10 km altitude range acquisition : about 0.5 s)
Taking advantage of the 64 point samples time séries recording capa- bility, an off line Fourier processor yields power spectrum densities with about 30 dB dynamic range. An objective noise level détermination [6] is used to set the threshold.
At vertical incidence, the PSD essentially represents the terminal fall velocity spectrum of hydrometeors shifted by the mean vertical air velocity. Assuming the drop size distribution of hydrometeors to be of the form
N(D) = N exp(-AD), a new technique, based on a three parameters non linear least square fitting has been developpedallowing simultaneous estimâtes of :
- the slope and intercept parameters of the distribution A and NQ, - the vertical air velocity W.
Briefly, each observed Doppler spectrum is fitted by a theoretical curve depending on the three previously described parameters which are adjusted until the mean square déviation between the two spectra becomes minimum. Details on this method will be fully given in a future paper presently under progress.
Figure 11 shows vertical profiles of :
i - parameters of the doppler spectrum (reflectivity factor Z, mean radial velocity �v � , velocity standard déviation a) ;
ii - results of the least square fitting analysis in No, A and W (The corresponding water content is also indicated).
This figure clearly displays the transition between water and ice particles near the altitude of the 0Q isotherm, just above the classical feature of the bright band. Notice also that the growth of précipitation is observed above 4 km altitude in the ice phase.
B - CRPE SCIENTIFIC PROGRAM
The radars are engaged in CRPE scientific programs generally invol- ving other atmospheric research laboratories or the Meteorological Office, so that the necessary environmental data (radiosoundings, satellite imagery, raingauges, radio link measurement) are available. The activity is organized around three main topics :
1 - Atr Dynamics, and the physics of précipitation in mid-latitude frontal Systems. The use of the three previous méthodologies provides dynamical data in a wide scale range (from 1 to about 300 km) and microphysical information from vertical incidence soundings allow the study of the formation process of précipitation.
2 - Dynamics, thermodynamics and précipitation associated with deep convection. Coplane methodology and occasionally vertical incidence soundings are used, yïelding the three-dimensional wind vector, précipitation field, and microphysical data. This leads to a better knowledge of the formation process of précipitation in convective conditions, and of the interaction
between air dynamics and précipitation. In addition, the estimation of vertical fluxes of momentum, mass, vorticity, liquid water, which is possible from our data allows an approach to the problem of convection parametrization.
3 - Propagation studies in the frequency range 4-14 GHz for Télécommunication purposes. This program is based on the simultaneous use of dual polarization radar data, and data of atténuation or cross polarisation obtained on radio links (11 and 14 GHz beacons of the O.T.S. satellite, and 4 to 13 GHz terrestrial radio links). The radar data are used both to déter- mine the structure of rain cells aloft and to identify the hydrometeors respon- sible for the cross polarizing and attenuating properties of the précipitation.
A frontal observation program started in spring 76 near Paris and continued in Oct-Nov 77 and March 78 with observation campai gns involving others atmospheric laboratories [5].
First deep convection observations took place in Switzerland (1978). Future development of the convection program is based on a French coopérative experiment , near Bordeaux in July-August 79 which also involves extensive measurements of electric field [3j.
Tropical convection will be investigated in May and June 81 in an Ivory Coast experiment [l].
FIGURES
Figure 1 : A RONSARD radar trailer which supports the aerial, transmitter and receiver.
Figure 2 : A RONSARD setup showing antenna and shelter.
Figure 3 : RONSARD block diagram (a : trailer b : shelter).
Figure 4 : RONSARD typical dual polarization séquence for the measurement of the orthogonal components of the scattered field (the transmitted field is linearly polarized and not switched). A minimum 60 ms
switching time is needed between observation periods T.
Figure 5 : AGC response to a rapidly varying signal with wide dynamic range. The feed horn has been replaced by a C-band écho box through an isolating 10 dB attenuator. The returned power from a transmitted puise is a strong signal observed at a .8 km distance rapidly decreasing to a value lower than the receiver noise after 4 km. Curve (a) shows the measured power after
the gain control. Curve (b) shows the AGC atténuation values and curve (c) the retrieved power received from the echo-box.
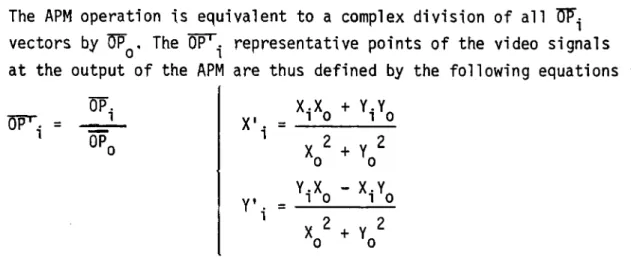
Figure 6 : Amplitude and phase memory subsystem (APM).
After mixing the IF returned signal with two quadrature 60 MHz local oscillator outputs, the measured complex signal has to be corrected depending upon th_e mean amplitude and phase of the transmitted puise. Let us assume that 0T is the représentative vector of the transmitted puise (with phase © , amplitude A , X and
Y as I and Q coordinates)and that UP~. is the received signal in each of the 64 range gâtes (with phase vi and amplitude A^ , Xi and
The APM opération is équivalent to a complex division of ail ffl- vectors by ÕPo. The Wr- représentative points of the video signais at the output of the APM are thus defined by the following équations :
W. = - 1 XI. 1 = 1 0 1 0
1 yix0
110
K 2 + y02
Figure 7 : The approximate Discrète Fourier Transformer.
Diagram (a) shows how the unit circle is approximated for the quantization of the sine and cosine tables and curves (b) are the display of sine and cosine values versus phase angle.
Figure (c) and (d) are power spectrum density représentations obtained with a true DFT (c) and an approximate DFT (d) applied to the same sine wave-. All spurious lines are lower than 13 dB below the main line level.
Figure 8 : Ambiguous Velocity corrector (AVC)
a) displays a typical folded power spectrum density obtained with RONSARD radars. The présence of energy close to the ambiguous values is detected in the Ambiguous Velocity Windows when computing the power spectrum density (PSD).
b) shows the same power spectrum density after a f/2 Doppler shift (which can be obtained by simply inverting the most signi- ficant bit of the PSD memory address) implemented before calculating
the moments. The whole opération amounts to shifting the Fourier analysis window position according to the observed Doppler shift.
Figure 9 : Horizontal circulation inferred from single Doppler radar data. Isocontours of cross front velocity (upper diagram) and long front velocity (lower diagram) have been derived from 18 VH vertical profiles obtained at the times indicated by triangles. Horizontal axis représenta also horizontal distances assuming the stationarity of the flow and a front speed of 8 ms-1.
\
Figure 10 : Vertical cross-section of the wind field. /Corresponding isocontours of the vertical accélération (Yi- = V.vw - V* wind vector, w.vertical velocity) are also shown.
Figure 11 : Mean results obtained from vertical sounding (during 90 s) in a large scale continuous précipitation associated to a warm front, near Paris. From left to right :
ï reflectivity factor,�V�mean Doppler velocity, a standard déviation of the spectrum, A and N parameters of the hydrometeors distributions, M precipitating water content, and W air vertical
velocity (négative upward). Eventhough the two séquences of measurement are not obtained exactly at the same time, the successive results in altitude hâve been connected for clarity of the figure.
Also are indicated the altitudes of 0°C, -5°C and -10°C isotherms.
REFERENCES
[1]*Achy, S. , P. Amayenc, J.P. Chalon, M. Desbois, M. Gilet, P. Olory, C. Pastre, G. Sommeria, J. Testud : Avant projet d'une expérience d'étude de la convection profonde tropicale (COPT), Présentation report by CRPE, LMD, EERM and Abidjan University, 1978.
[2] Benham, F.C., H.L. Groginsky, A.S. Soltes and G. Works, 1972 : Puise pair estimation of Doppler spectrum parameters. Final Report, Contract F - 19 628 - 71 - C - 0126, Raytheon Company, Wayland, Mass.
f 3l*Bou1ay, J.L., M. Payen, G. Sommeria, P. Vangrunderbeck, S. Chauzy, P. Laroche, J. Testud : objectifs et organisation générale de l'expérience
"Landes 79", Présentation report by CRPE, LMD, Météorologie nationale, L.P.A., CESTA, ONERA, 1979.
[4] Browning, K.A. and R. Wexler, 1968 : The détermination of kinematic properties of a wind field using Doppler radar. J. Appl. Meteor., 7, 105-113.
[5] Gilet, M., Campagne de mesures "Fronts 77", Compte-rendu des opérations, Note technique EERM 407, April 1978, Météorologie Nationale - Paris.
[6] Hildebrand,P.H. and R.S. Sekhon, 1974 : Objective détermination of noise level in Doppler spectra, J. Appl. Meteor., 13, 808-811.
[7] Lhermitte, R.M., 1970 : Dual Doppler observation of convective storm circulation, Preprints 14 Radar Met. Conf., Tucson, Americ. Meteor. Soc. 139-144.
[8] Miller, K.S. and M.M. Rochwarger, 1972 : A covariance approach to spectral moment estimation. IEEE Trans. Inform. Theory, IT-18, 588-596.
[9] Sirmans, D. and B. Bumgarner, 1975 : Numerical comparison of five mean frequency estimators, J. Api. Meteor., 14, 991-1003.
[10] Srivastava, R.C., A.R. Jameson and P.H. Hildebrand, 1978 : Time-domain computation of mean and variance of Doppler spectra. 18 Conf. on Radar Meteorology, Atlanta, Ga, Amer. Meteor. Soc., 383-386.
[11] Testud, J., G. Breger, P. Amayenc, M. Chong, B. Nutten, A. Sauvaget, 1979 : A Doppler radar observation of a cold front : three-dimensional air circulation, related précipitation System, and associated wave like motions. Submitted to J. Atmos. Sci., 1979.
[12] Waldteufel, P. H. Corbin, 1979 : On the analysis of single Doppler Radar data. J. Appl. Met., 1979, 18, 532�542.
[l3]Zmic, D.S., 1979 : Spectrum width estimâtes for weather echoes. IEEE Trans. Aerosp. Electron. Syst.
*available on request at CNET/CRPE 38 rue du Général Leclerc 92130 ISSY-LES-MOULINEAUX
CHARACTERISTICS OF RONSARD RADARS
Table 1 1/2
TRANSMUTER
Frequency f = 5 600 or 5 630 MHz (X ^ 5.4 cm/C Band) Type coaxial magnetron with AFC
Peak power 250 KW
3 puise répétition frequencies (Hz) 2 928 1 464 732 Puise duration (ps) .34 .68 1.36 Velocity span (Nyquist interval (ms- 1) 78.2 39.1 19.6 Range (km) 50.4 101.6 204.0
AERIAL
Type Cassegrain with circular paraboloïd main reflector
Diameter 4 m
Angular width (3 dB, one way) .9 degree
On-axis gain 44.4 dB with 50 % efficiency Maximum angular velocity 18° S-1
Maximum accélération 18° s Azimuth span � 360° Elévation span -1/90° Pointing accuracy 0.1 degree
Wind tolérance 60 km/hr (nominal), 140 km/hr (survival)
RECEIVER
Polarization linear, horizontal or vertical Recovery time 5.3 vis
Noise température 450° K (Noise figure : 4 dB) Self calibrating capability
Quantized 6 dB AGC loop with overall 80 dB dynamic
REAL TIME PROCESSOR
Switchable ground clutter canceller
cut-off velocity : .5, 1, 1.5 ms
. Number of pôles in the transfert function : 2 or 4 Discrète Fourier Transform Processor with quantized sine and cosine tables.
Spectrum moments computer
Ambiguous velocities controller
RADAR MANAGEMENT SYSTEM
Mini computer based (MITRA 15) performing :
. Radar data acquisition
. Magnetic tape radar and house-keeping data recording . Antenna motion management
. Interactive radar programming
DATA RATES (Range resolution volumes/sec)
1 - Time series recording