HAL Id: tel-01139406
https://pastel.archives-ouvertes.fr/tel-01139406
Submitted on 4 Apr 2015
HAL is a multi-disciplinary open access archive for the deposit and dissemination of sci-entific research documents, whether they are pub-lished or not. The documents may come from teaching and research institutions in France or abroad, or from public or private research centers.
L’archive ouverte pluridisciplinaire HAL, est destinée au dépôt et à la diffusion de documents scientifiques de niveau recherche, publiés ou non, émanant des établissements d’enseignement et de recherche français ou étrangers, des laboratoires publics ou privés.
application to cryogenics and air separation unit
Marco Campestrini
To cite this version:
Marco Campestrini. Thermodynamic study of solid-liquid-vapor equilibrium : application to cryogen-ics and air separation unit. Chemical and Process Engineering. Ecole Nationale Supérieure des Mines de Paris, 2014. English. �NNT : 2014ENMP0035�. �tel-01139406�
MINES ParisTech
CTP – Centre Thermodynamique des Procédés
35, rue Saint Honoré, 77300 Fontainebleau
présentée et soutenue publiquement par
Marco CAMPESTRINI
le 9 décembre 2014
Etude thermodynamique des équilibres solide-liquide-vapeur:
application à la cryogénie et aux unités de séparation de l’air
(Thermodynamic study of solid-liquid-vapor equilibrium:
application to cryogenics and air separation unit)
Doctorat ParisTech
T H È S E
pour obtenir le grade de docteur délivré par
l’École Nationale Supérieure des Mines de Paris
Spécialité “ Energétique et Procédés ”
Directeur de thèse : Christophe COQUELET Maître de thèse : Paolo STRINGARI
T
H
È
S
E
Jury:M. Jean-Noël JAUBERT, Pr., Université de Lorraine, Laboratoire Réactions et Génie des Procédés Président
M. João Araújo Pereira COUTINHO, Pr., University of Aveiro, Department of Chemistry Rapporteur
Mme. Laura Annamaria PELLEGRINI, Pr., Politecnico of Milan, Department of Chemistry Rapporteur
M. Philippe ARPENTINIER, Dr., Air Liquide - Centre de Recherche Claude-Delorme Examinateur
M. Christophe COQUELET, Pr., MINES ParisTech, PSL Research University , CTP Examinateur
M. Guy DE WEIRELD, Pr., Université de Mons, Department of Thermodynamics Examinateur
M. Maurizio GRIGIANTE, Dr., University of Trento, Department of Civil and Environmental Engineering Examinateur
I would like to express my gratitude to all the jury members. I am thankful to Pr. João Coutinho and Pr. Laura Annamaria Pellegrini for agreeing to read and evaluate my work, and for the interest shown in being supervisor of this thesis. In addition, a thank you to Pr. Jean-Noël Jaubert and Pr. Guy de Weireld, for accepting to examine this three years work and for the kind cooperation. I wish to thank Dr. Maurizio Grigiante, who in 2010 proposed me to spend a month at the Centre Thermodynamics of Processes, thus giving beginning to my French experience.
I would like to acknowledge the crucial role of Pr. Christophe Coquelet, Dr. Paolo Stringari, and Dr. Philippe Arpentinier. My gratitude is addressed to my project external guide Dr. Philippe Arpentinier from the Air Liquide company, for the useful comments, remarks and engagement during the last three years, especially through the learning process of the cryogenic distillation of air.
I would like to express my special appreciation and thanks to my directeur de thèse, Pr. Christophe Coquelet, and my maître de thèse, Dr. Paolo Stringari. You have been important mentors for me, and I thank you for your motivating guidance, invaluable constructive criticism and friendly advice during this work. Furthermore, I would like to thank Dr. Paolo Stringari for encouraging my research and for allowing me to grow as a researcher. Your advices on research as well as on my career have been priceless. Thank you for your precious assistance you have been giving me since 2010, and for all the constructive discussions we shared sometimes till night in your office.
I would like to thank all the staff of the Centre Thermodynamics of Processes, who has been receiving me as in a family since the beginning of my thesis. Special thanks go to my friends, colleagues and team mates, Martha, Snaïde, Elise, Fan, Eric, Mauro, Jamal, and Ali. Your support has been fundamental, thank you for remembering me that life is not only work and for making me smiling even in the most busy and stressful periods. I have also to appreciate the assistance provided by Marie-Claude and Jocelyne in dealing with French bureaucracy, and the guidance given by David and Herve in playing football and learning French, respectively.
I would like to express my gratitude to the Air Liquide company, ARMINES, and the Ecole Nationale Supérieure des Mines de Paris for giving me the possibility of doing this work and growing as a researcher.
I want to express my endless gratitude to my wife and my family. You all shared with me these three years, it has not been easy to stay away from you, but you have never ceased to make me feel your love, your support and your encouragement. I will never forget what you have done to allow this aim to be possible. Grazie Fabrizia, Renzo, Maria, e Barbara.
Table of Contents
LIST OF FIGURES ... III LIST OF TABLES ... VII
PREFACE ... 1
INTRODUCTION AND SUMMARY ... 3
1 AIR DISTILLATION ... 5
1.1 Air separation technologies ... 5
1.2 Cryogenic air separation unit ... 6
1.2.1 ASU block diagram and P-h diagram ... 8
1.2.2 ASU flow diagram ... 11
1.2.2.1 Argon and rare gases separation ... 14
1.2.2.2 Cold box ... 14
1.2.3 ASU operative conditions ... 15
1.2.4 Safety problems and contaminants removal ... 16
1.3 Systems of interest ... 18
1.3.1 Bibliographic research ... 20
2 PHASE DIAGRAMS INCLUDING SOLID PHASE ... 23
2.1 Aggregation states of the matter ... 23
2.2 Phase rule ... 23
2.3 First order phase transition ... 24
2.4 Phase diagrams ... 25
2.4.1 Pure compounds ... 25
2.4.1.1 Shape of the melting line ... 26
2.4.2 Binary mixture ... 28
2.4.2.1 Global phase diagrams for fluid phases ... 28
2.4.2.2 Solid-liquid temperature-composition projections ... 29
2.4.2.3 Global phase diagrams for solid and fluid phases ... 30
2.4.2.4 Type I PT-EP ... 32
3 PHASE EQUILIBRIUM CALCULATION ... 33
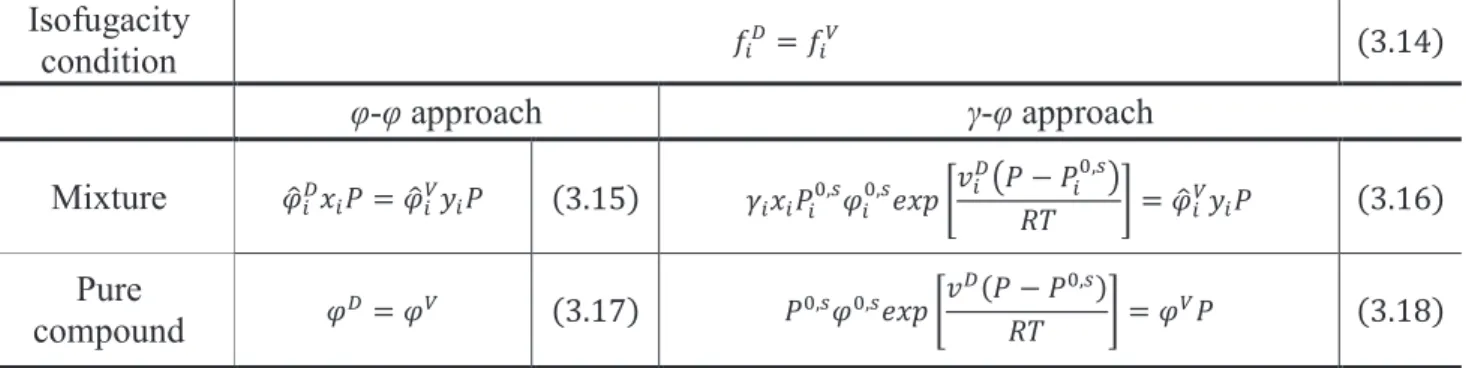
3.1 Equilibrium condition ... 33
3.1.1 Symmetric and asymmetric approach ... 35
3.1.2 Cubic EoSs ... 35
3.1.3 Fugacity coefficient from an EoS and Gibbs free energy of mixing ... 37
3.2 Representation of the solid-liquid equilibrium ... 40
3.2.1 Classical approach ... 40
3.2.2 Solid-fluid equilibrium models ... 41
3.2.3 Solid-liquid transition ... 44
3.2.4 SFE models comparison ... 45
4 REPRESENTATION OF PHASE EQUILIBRIA.I.PURE COMPOUNDS ... 51
4.1 Yokozeki EoS ... 51
4.2 Analytical solution of the SLV EoS ... 55
4.3 Setting EoS parameters of the SLV EoS... 55
4.3.1 New procedure for setting EoS parameters ... 59
4.4 Modeling of phase equilibrium properties ... 62
4.4.1 Equilibrium pressures and temperatures ... 63
4.4.2 Equilibrium densities and enthalpies ... 65
4.5 Results for pure compounds ... 67
4.5.1 Pressure-temperature ranges for the EoS parameters regression ... 68
4.5.2 Representation of pressure-temperature equilibrium projections ... 69
5 EXTENSION TO MIXTURES ... 73
5.1 Mixing rules ... 73
5.2 Partial molar fugacity coefficients ... 76
5.4 Prediction of phase equilibria in binary mixtures ... 79
5.5 Mixtures of interest: data assessment ... 84
5.6 Application of the SLV EoS to Lennard-Jones mixtures ... 86
5.6.1 Lennard-Jones potential ... 87
5.6.2 Functional form of the LJ-SLV EoS ... 88
5.6.3 Phase diagram of the LJ fluid from the LJ-SLV EoS ... 88
5.6.4 Phase diagram of binary LJ mixtures from the LJ-SLV EoS ... 90
5.6.4.1 Equation for the binary interaction parameters ... 92
5.6.5 Phase diagram of real binary mixtures from the SLV EoS and predicted binary interaction parameters ... 92
6 REPRESENTATION OF PHASE EQUILIBRIA.II.BINARY MIXTURES ... 97
6.1 Evaluation of a three phase line ... 98
6.2 Evaluation of then critical loici ... 98
6.3 Results for the binary mixtures of interest ... 99
6.3.1 Type Ia PT-EP: systems Ar+Kr and N2+Ar ... 102
6.3.2 Type Ib PT-EP: system Ar+CH4 ... 111
6.3.3 Type IIb PT-EP: O2+C2H6 ... 116
6.3.4 Type IIIb+c PT-EP: system N2+C2H6 ... 123
6.3.5 Type IIIb+d PT-EP: system Ar+CO2 ... 129
6.4 Considerations about the binary interaction parameters ... 133
6.5 Modeling O2+impurity binary mixtures at the reboiler-condenser of the ASU ... 134
CONCLUSIONS ... 137 BIBLIOGRAPHY ... 141 COMMUNICATIONS ... 147 APPENDIX A ... A1 APPENDIX B ... B1 APPENDIX C ... C1 APPENDIX D ... D1 APPENDIX E ... E1 APPENDIX F ... F1
List of figures
Figure i.1: Single column apparatus for air separation by Carl von Linde. ... 2
Figure i.2: Single column apparatus for air separation by Georges Claude. ... 2
Figure 1.1: Air Liquide MEDAL membrane technology for nitrogen production. ... 6
Figure 1.2: Principle of the Air Liquide FLOXAL adsorption technology for oxygen and nitrogen production. ... 6
Figure 1.3: Saturation lines of the three main air components. ... 7
Figure 1.4: Molar fractions of nitrogen in the liquid and vapor phases in the N2/O2 system at 0.1, 0.5 and 1 MPa. ... 8
Figure 1.5: Molar fractions of argon in the liquid and vapor phases in the Ar/O2 system at 0.1, 0.5 and 1 MPa. ... 8
Figure 1.6: ASU main components. ... 9
Figure 1.7: Pressure-enthalpy diagram of air. ... 10
Figure 1.8: ASU block diagram: main components and flows within an ASU. ... 10
Figure 1.9: Air separation unit flow diagram. ... 12
Figure 1.10: Example of the pressure drop chart of an ASU. ... 15
Figure 1.11: Qualitative removal efficiency. ... 18
Figure 2.1: Pressure-temperature equilibrium projection of a phase diagram for a pure substance. ... 25
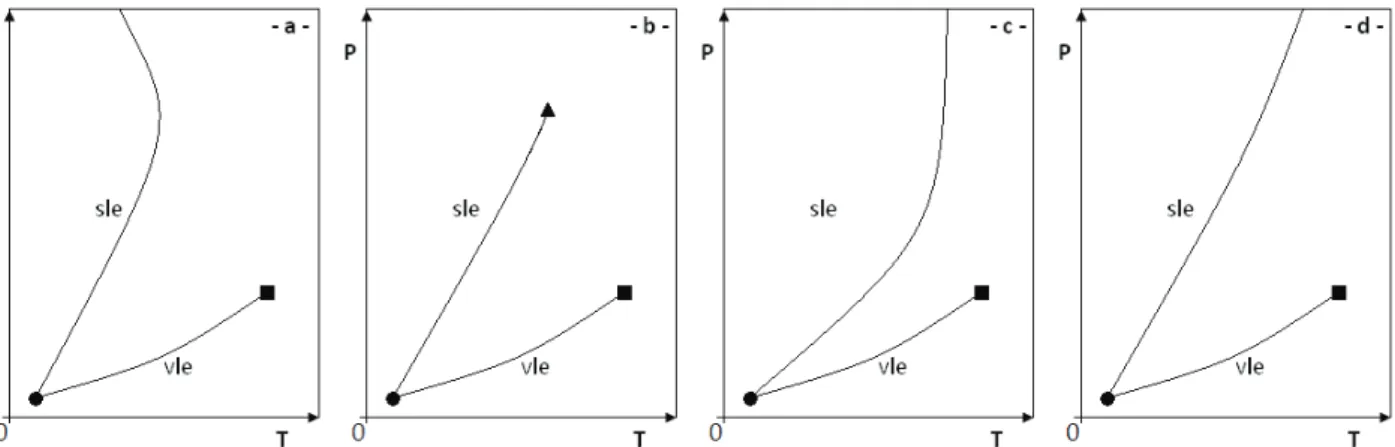
Figure 2.2: Qualitative pressure-temperature equilibrium projections of a phase diagram for a pure substance, considering only solid-liquid and liquid-vapor equilibria. ... 27
Figure 2.3: Qualitative Type I PT-EP systems as presented in van Konynenburg and Scott. ... 29
Figure 2.4: Types of solid–liquid phase diagrams identified by Matsuoka. ... 30
Figure 2.5: Qualitative Type I PT-EP systems in case of complete miscibility in the solid phase. ... 32
Figure 2.6: Qualitative Type I PT-EP systems in case of partial or total immiscibility in the solid phase. .... 32
Figure 3.1: Qualitative representation of the vapor-liquid equilibrium in a pure compound. ... 38
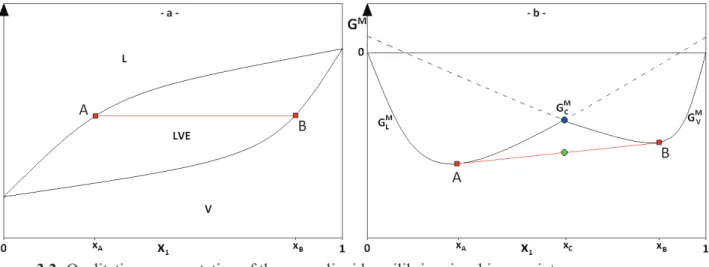
Figure 3.2: Qualitative representation of the vapor-liquid equilibrium in a binary mixture. ... 39
Figure 3.3: SLE of methane from fundamental relation. ... 40
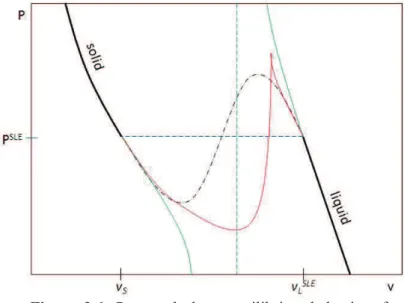
Figure 3.4: Qualitative subcritical isothermal pressure-volume equilibrium projection of a pure compound. 44 Figure 3.5: Graphical derivation of the Maxwell’s equal area rule for phase transition. ... 44
Figure 3.6: Proposed phase equilibrium behaviors for the solid-liquid transition. ... 45
Figure 4.1: Schematic P-v diagram of the Yokozeki EoS at the triple point temperature and v>b. ... 52
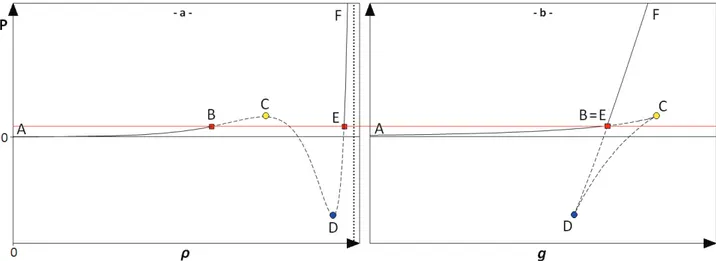
Figure 4.2: Qualitative Pressure-residual Gibbs free energy diagram related to the Yokozeki EoS. ... 52
Figure 4.3: Proper EoS parameter regions for solving the critical point condition with different attractive terms. ... 57
Figure 4.4: Function a(T) for argon. ... 58
Figure 4.5: Function b(T) for argon. ... 58
Figure 4.6: Phase diagram of argon and carbon dioxide in the pressure-temperature equilibrium projection obtained by the Yokozeki EoS with vdW attractive term. ... 59
Figure 4.7: Flow chart of the proposed procedure for setting the parameters of the SLV EoS. ... 61
Figure 4.8: Values of the parameter a for argon. ... 64
Figure 4.9: Values of the parameter b for argon. ... 64
Figure 4.10: Pressure-temperature equilibrium behavior of argon obtained with the SLV EoS and values from auxiliary equations. ... 65
Figure 4.11: Reduced temperature – reduced density phase equilibrium behavior for argon. ... 66
Figure 4.12: Latent heats of transition versus reduced equilibrium temperature for argon. ... 66
Figure 4.13: PT-EP of methane obtained with the SLV EoS. ... 71
Figure 4.14: PT-EP of carbon dioxide obtained with the SLV EoS. ... 71
Figure 5.1: Qualitative Gibbs free energy of mixing at the solid-solid-liquid equilibrium. ... 74
Figure 5.3: Main steps of the simplified version of the flow diagram related to the algorithm for the
minimization of the Gibbs free energy of mixing. ... 78
Figure 5.4: Vapor-liquid equilibrium at 138 K for the system Ar + Kr. ... 79
Figure 5.5: Solid-liquid equilibrium for the system Ar + Kr. ... 80
Figure 5.6: Vapor-liquid equilibrium at 100 K for the system N2 + O2. ... 80
Figure 5.7: Solid-liquid equilibrium for the system N2 + O2. ... 81
Figure 5.8: Vapor-liquid equilibrium at 253 K for the system N2 + N2O. ... 81
Figure 5.9: Solid-liquid equilibrium for the system N2 + N2O. ... 82
Figure 5.10: Saturation lines of N2, O2, and N2O. ... 83
Figure 5.11: Lennard-Jones intermolecular potential. ... 87
Figure 5.12: Reduced pressure, P*, versus reduced temperature, T*; diagram for the pure LJ fluid. ... 89
Figure 5.13: Temperature vs. composition phase diagrams for two LJ binary mixtures. ... 91
Figure 5.14: Dependence of the binary interaction parameter kij from ε11/ε22 and σ11/σ22. ... 91
Figure 5.15: Solid-liquid equilibrium for the system Ar – Kr in the temperature-composition diagram. ... 93
Figure 5.16: Solid-liquid equilibrium for the system Ar – CH4 in the temperature-composition diagram. .... 94
Figure 5.17: Solid-liquid equilibrium for the system N2 – Ar in the temperature-composition diagram. ... 95
Figure 6.1: Mixture Ar+Kr : comparison between experimental and calculated values of SLE. ... 102
Figure 6.2: Mixture Ar+Kr: comparison between experimental and calculated values of VLE. ... 102
Figure 6.3: Mixture Ar+Kr: qualitative pressure-temperature equilibrium projection. ... 103
Figure 6.4: Mixture Ar+Kr: calculated pressure-temperature equilibrium projection. ... 104
Figure 6.5: Mixture Ar+Kr: evolution of the phase equilibrium behavior with pressure in the range 70 K – 160 K. ... 105
Figure 6.6: Mixture N2+Ar: comparison between experimental and calculated values of SLE. ... 106
Figure 6.7: Mixture N2+Ar: comparison between experimental and calculated values of VLE. ... 106
Figure 6.8: Mixture N2+Ar: qualitative pressure-temperature equilibrium projection. ... 107
Figure 6.9: Mixture N2+Ar: calculated pressure-temperature equilibrium projection. ... 108
Figure 6.10: Mixture N2+Ar: calculated pressure-temperature equilibrium projection in the proximity of the triple point of N2. ... 109
Figure 6.11: Mixture N2+Ar: evolution of the phase equilibrium behavior with pressure in the range 55 K – 85 K. ... 110
Figure 6.12: Mixture Ar+CH4: comparison between experimental and calculated values of SLE. ... 111
Figure 6.13: Mixture Ar+CH4: comparison between experimental and calculated values of VLE. ... 111
Figure 6.14: Mixture Ar+CH4: qualitative pressure-temperature equilibrium projection. ... 112
Figure 6.15: Mixture Ar+CH4: calculated pressure-temperature equilibrium projection. ... 113
Figure 6.16: Mixture Ar+CH4: calculated pressure-temperature equilibrium projection in the proximity of the triple points. ... 114
Figure 6.17: Mixture Ar+CH4: evolution of the phase equilibrium behavior with pressure in the range 65 K – 115 K. ... 115
Figure 6.18: Mixture O2+C2H6: comparison between experimental and calculated values of VLE. ... 116
Figure 6.19: Mixture O2+C2H6: comparison between experimental and calculated values of SLE. ... 117
Figure 6.20: Mixture O2+C2H6: qualitative pressure-temperature equilibrium projection. ... 118
Figure 6.21: Mixture O2+C2H6: calculated pressure-temperature equilibrium projection. ... 119
Figure 6.22: Mixture O2+C2H6: calculated pressure-temperature equilibrium projection in the proximity of the triple point of O2. ... 120
Figure 6.23: Mixture O2+C2H6: evolution of the phase equilibrium behavior with pressure in the range 40 K – 200 K up to 0.2 MPa. ... 121
Figure 6.24: Mixture O2+C2H6: evolution of the phase equilibrium behavior with pressure in the range 40 K – 320 K for P > 0.2 MPa... 122
Figure 6.25: Mixture N2+C2H6: comparison between experimental and calculated values of SLE. ... 123
Figure 6.26: Mixture N2+C2H6: comparison between experimental and calculated values of VLE. ... 123
Figure 6.27: Mixture N2+C2H6: qualitative pressure-temperature equilibrium projection. ... 124
Figure 6.28: Mixture N2+C2H6: calculated pressure-temperature equilibrium projection. ... 125
Figure 6.29: Mixture N2+C2H6: calculated pressure-temperature equilibrium projection in the proximity of the triple point of N2. ... 126
Figure 6.30: Mixture N2+C2H6: evolution of the phase equilibrium behavior with pressure in the range 50 K – 300 K up to 3 MPa. ... 127
Figure 6.31: Mixture N2+C2H6: evolution of the phase equilibrium behavior with pressure in the range 50 K
– 300 K for P > 3 MPa... 128
Figure 6.32: Mixture Ar+CO2: comparison between experimental and calculated values of VLE. ... 129
Figure 6.33: Mixture Ar+CO2: qualitative pressure-temperature equilibrium projection. ... 130
Figure 6.34: Mixture Ar+CO2: calculated pressure-temperature equilibrium projection. ... 131
Figure 6.35: Mixture Ar+CO2: evolution of the phase equilibrium behavior with pressure in the range 50 K – 300 K. ... 132
Figure 6.36: Form of a typical temperature dependent function used for the binary interaction parameters. 133 Figure 6.37: Phase equilibrium behavior of the system O2+CH4 at 94 K. ... 135
Figure 6.38: Phase equilibrium behavior of the system O2+C2H4 at 94 K. ... 135
List of tables
Table 1.1: Air composition. ... 5
Table 1.2: The three processes of air separation... 5
Table 1.3: Abbreviations used in the ASU flow diagram. ... 11
Table 1.4: Selection of the binary mixtures of interest for the bibliographic study. ... 19
Table 1.5: Binary mixtures and pure compounds of interest for this study. ... 20
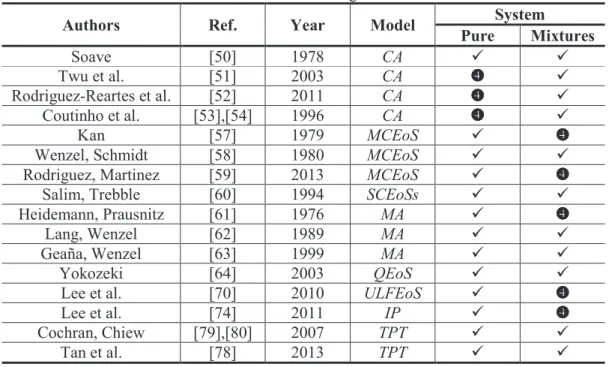
Table 1.6: Literature review on the kind of equilibrium data for the binary mixtures on interest. ... 21
Table 2.1: Phase rule scenarios for a pure substance. ... 25
Table 2.2: Phase rule scenarios for a binary mixture. ... 31
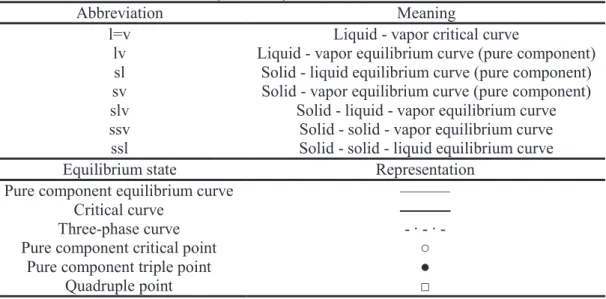
Table 2.3: Abbreviations, line styles and symbols used in the PT-EP. ... 31
Table 3.1: Formalisms for the symmetric and asymmetric approaches for the equilibrium condition between a vapor phase and a dense phase in pure compounds and mixtures. ... 35
Table 3.2: Principal cubic EoSs. ... 36
Table 3.3: Examples of α–function for subcritical temperatures. ... 37
Table 3.4: Overview of the main models accounting for the SFE. ... 43
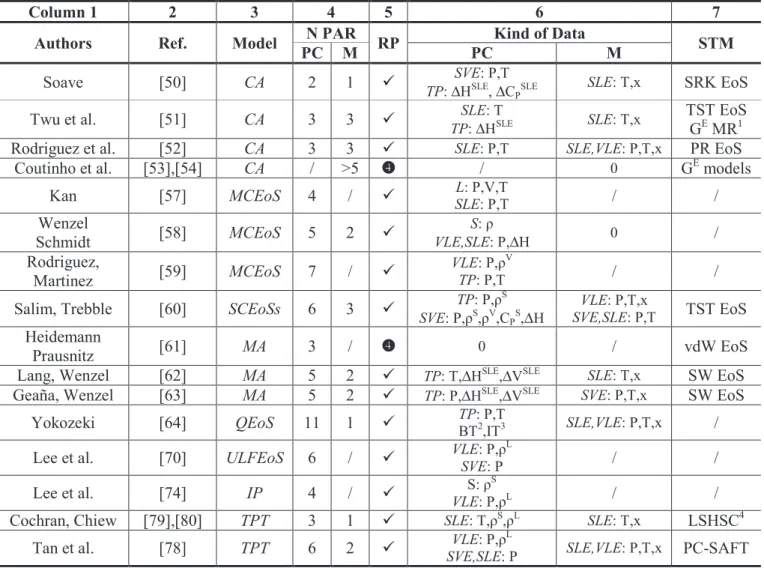
Table 3.5: SFE models comparison in terms of number of parameters, data involved in the regression of the parameters, and additional fluid-state model. ... 46
Table 3.6: SFE models comparison in terms of proposed criteria. ... 48
Table 4.1: Functional forms of the SLV EoS which have been compared in terms of representation of phase equilibrium properties of pure argon. ... 62
Table 4.2: EoS parameters of the five different SLV EoSs for argon. ... 62
Table 4.3: Summary of the statistical errors in calculating equilibrium temperatures at fixed pressures for argon. ... 63
Table 4.4: Summary of the statistical errors in calculating equilibrium pressures at fixed temperatures for argon. ... 63
Table 4.5: Triple and critical points for the substances of interest. ... 68
Table 4.6: Minimum SVE and maximum SLE values for the temperature and pressure used for the regression of the SLV EoS parameters. ... 68
Table 4.7: Summary of the statistical errors in calculating equilibrium pressures at fixed temperatures for the pure compounds of interest. ... 69
Table 4.8: Summary of the statistical errors in calculating equilibrium temperatures at fixed pressures for the pure compounds of interest. ... 70
Table 5.1: Temperature ranges of the available experimental values of fluid-fluid and solid-fluid equilibria for the mixtures of interest in this study. ... 85
Table 5.2: Parameters of the LJ-SLV EoS in reduced variables. ... 89
Table 5.3: Coefficients for the calculation of the binary interaction parameters from LJ parameters. ... 92
Table 5.4: Binary interaction parameters for the mixtures Ar + Kr, Ar + CH4, and N2 + Ar calculated from LJ parameters. ... 93
Table 6.1: Binary mixtures represented with regressed binary interaction parameters. ... 97
Table 6.2: Classification of the binary mixtures of interest according to the encountered pressure-temperature equilibrium behaviors. ... 100
Preface
Nowadays, the liquefaction of gases is a key issue in different fields. Several anthropic applications, like metallurgy, chemistry, petrochemistry, health, and electronics, require reasonable supplies of oxygen, nitrogen, and argon. High purity volumes of these substances are obtained from atmospheric air undergoing liquefaction in a cryogenic distillation plant.
At the same time, the world energetic demand is partially satisfied thanks to natural gas, predominantly constituted of methane. In this case, the liquefaction is operated mainly for reducing volumes and consequently abating the transport costs from the areas where natural gas is produced to where it is needed.
The first liquefaction of a gas was achieved by Louis Clouet and Gaspard Monge around 1780.
Liquid SO2 came out from a cooled coil plunged in a bath of salt and ice and fed with compressed
gas. Ammonia was liquefied for the first time in 1787 in a bath of snow and hydrochloric calcareous
earth. In 1823, Michael Faraday liquefied SO2, H2S, CO2, N2O, C2H2, NH3, and HCl using a
compressor up to 40 bars and cooling the apparatus down to –110°C in a bath of ether and solid carbon dioxide.
Nevertheless, O2, CO, N2, He, and H2 were still considered as “permanent gases” since any
attempt to liquefy them by means of very high pressures failed due to the incapacity of lowering the temperature under their critical temperatures. It was Thomas Andrews in 1869 who first pointed out that liquefaction of a gas cannot be achieved above the critical temperature even for the highest imposed pressure.
Droplets of liquid oxygen were obtained for the first time in 1877 independently by Louis Paul Cailletet in Paris and Raoul-Pierre Pictet in Geneva. The former physicist allowed cooled and compressed oxygen to rapidly expand, thus exploiting the Joule-Thomson effect for cooling the gas
further. Pictet first vaporized SO2 to liquefy CO2 and then vaporize CO2 to liquefy O2. Based on
these insights of introducing an isoenthalpic expansion and subsequent steps of vaporization/liquefaction, the so called “cascade method”, Sigmund von Wroblewski was able in 1883 in Cracow to collect liquid oxygen and show a meniscus between the liquid and the vapor
phases. With the same technique, he liquefied also small quantities of N2, CO, and CH4.
The first liquefaction of air in an industrial scale was performed by Carl von Linde in 1895. He used a throttle valve giving the Joule-Thomson isoenthalpic expansion, thereby lowering the temperature of the precooled and compressed feed air till obtaining its partial liquefaction. In 1901, same scientist obtained pure liquid oxygen by a single column apparatus equipped with a reboiler at the bottom, resumed in Figure i.1.
The feed compressed and precooled air is partially liquefied through two heat exchangers and an expansion valve before entering at the top of the distillation column. The first heat exchange occurs in countercurrent with the gaseous products of the process that are moved away from the column. The second heat exchanger is placed at the bottom of the column and it is the centre of the heat exchange between the feed air and the liquid oxygen. The liquid oxygen receives enough heat for reaching its boiling point, and for this reason this exchanger is called reboiler.
The produced oxygen is drawn from the bottom in the vapor state and it may be very pure. The purity of the nitrogen drawn from the top can be improved by increasing the number of trays inside the column, but this stream will still contain high quantity of oxygen owing to the proximity of its extraction point whit the feed air.
Figure i.1: Single column apparatus for air separation by Carl von Linde [1].
In 1902, George Claude introduced an expansion machine in the liquefaction cycle, thus performing liquefaction by isentropic expansion. Furthermore, he modified the Linde process and proposed the well-known “Retour en arrière” configuration for improving the purity of nitrogen, Figure i.2. Claude placed a reflux heat exchanger at the bottom of the distillation column. In this way he obtained an oxygen-enriched liquid and a nitrogen-enriched liquid fed to the middle and to the top of the column, respectively. Using this process it was still no possible to drawn pure nitrogen vapor from the top of the column, even if the oxygen content was reduced.
Figure i.2: Single column apparatus for air separation by Georges Claude [1].
All the cryogenic technologies have been successively proposed starting from these two insights and over the years it clearly appeared that two columns were required for producing simultaneously high-purity oxygen and nitrogen by distilling air. Pure liquid nitrogen and oxygen were simultaneously obtained only between 1905 and 1910, when the double column apparatus was conceived.
By the beginning of the 20th century also hydrogen and helium were liquefied, respectively by
James Dewar in 1989 and Heike Kamerlingh Onnes in 1908. The work of Onnes introduced also the low temperature physics and the phenomenon of superconductivity in 1911.
Introduction and Summary
Cryogenic distillation of air is the oldest but most highly developed separation technology for the industrial production of oxygen. This technology has not changed fundamentally from that initially
developed by Carl von Linde and Georges Claude at the beginning of the 20th century.
Cryogenic air separation is based on fractional distillation in which components of the air mixture are separated on the basis of differences in boiling point and relative volatility. The core of a conventional Air Separation Unit (ASU) is a system of two distillation columns and a reboiler-condenser in between working at about 100 K.
Because of the low temperatures needed in the cryogenic distillation of air, we are faced with the
risk of solidification of impurities (CO2, N2O) within the process. This phenomenon entails the
fouling of the heat transfer surfaces, which worsen the heat exchanges, increases the pressure drops through the process, and causes energy losses and blockages of cryogenic units.
Furthermore, air distillation plants are generally installed on industrial sites and this contributes to air contamination by light hydrocarbons, thus giving a significant safety hazard related to the formation of flammable mixtures in liquid oxygen.
Significant efforts are made by the oxygen producing companies to ensure the safety of cryogenic ASU. Their aim is to avoid that unwanted contaminants reach the reboiler-condenser, are concentrated in liquid oxygen or form a critical mass of solid deposit which could lead to an explosion. Global approaches are developed by these companies to minimize and control that risk. These latter have led to the development of processes equipped with liquid oxygen filters, the development of new adsorbents in the air purification unit and monitoring strategies to track accurately the contaminants from the feed air to the liquid oxygen.
Although the air is sent to a purification unit before entering the double column system, the removal is not complete and some impurities enter in the columns and can accumulate. It is therefore essential for Air Liquide to master the complete phase diagram of the system under the conditions of cryogenic distillation.
Considering the scarcity of experimental values for the binary mixtures hydrocarbons-oxygen, Air Liquide and the Centre Thermodynamics of Processes (CTP) of MINES ParisTech developed a new apparatus for establishing quality data of binary mixtures of interest in the air distillation process.
This apparatus (A. Baba Ahmed, Appareillage pour l’étude des équilibres liquide-vapeur dans le domaine cryogénique, conception et développement, Thesis, 1999), was initially used for the
vapor-liquid equilibrium of binary and ternary mixtures of N2, O2, and Ar.
More recently (D. Houssin, Solubilité des hydrocarbures dans l’oxygène liquide, Thesis, 2007), same apparatus has been modified and used for the vapor-liquid and liquid-liquid equilibria in binary mixtures of hydrocarbons/nitrogen and hydrocarbons/oxygen.
In a previous work (V. De Stefani, Etude de la solubilité de solides à pression modérée dans le domaine de la cryogénie: mesures et modélisation, Thesis, 2003), the CTP realized a work related to solid-liquid equilibrium with the aim of facing the scarcity of SLE data for the binary mixtures
plugging components-oxygen, where plugging components refer to CO2 and N2O. A classical
approach was adopted for representing the experimental values, then it could not be applied for representing the global phase diagram of the cited mixtures.
The purpose of the present work is to develop and apply a different thermodynamic model for representing, in a wide range of temperature and pressure, the phase equilibrium behavior of the main binary mixtures involved in the cryogenic air distillation process. The main goal is to obtain the global phase diagrams for a selected number of binary mixtures, and the development of the model is proposed in the framework of the research contract between Air Liquide and MINES ParisTech/ARMINES via the CTP.
This manuscript is organized as follows.
Chapter 1 briefly presents the cryogenic air distillation process, and fixes the pure substances and binary mixtures of interest in this work. A bibliographic research has been carried out for collecting experimental values for the systems of interest, and the available literature data are listed in Appendix A.
The presence of the solid phase in the phase equilibrium diagram of pure substances and binary mixtures is presented in Chapter 2. For mixtures, the Pressure-Temperature Equilibrium Projections (PT-EPs) have been qualitatively evaluated starting from the classification of phase diagrams proposed by van Konynenburg and Scott, and most of the obtained PT-EPs have been detailed in Appendix B. These phase diagrams have been produced in a previous work (P. Stringari, M. Campestrini, C. Coquelet, Etude des équilibres solide–fluide–fluide: diagrammes de phases, inventaire des modèles et banques de données, Bibliographic Study for Air Liquide, 2012).
Chapter 3 focuses on the representation of phase equilibria and some literature models proposed for representing the solid-fluid equilibrium. At the end of Chapter 3 some criteria have been proposed for selecting a thermodynamic model, while a detailed presentation of all the considered literature model has been reported in Appendix C. The selected thermodynamic model is the Equation of State (EoS) proposed by Yokozeki in 2003.
The capability of the Yokozeki EoS in representing phase equilibrium properties of pure substances is discussed in Chapter 4. Furthermore, a new procedure for setting the EoS parameters is here presented. The quantitative comparison between model and pure component equilibrium temperature and pressure has been summarized at the end of Chapter 4, whereas details have been reported in Appendix D.
Extension of the Yokozeki EoS to binary mixtures has been considered in Chapter 5. The algorithm for the resolution of the phase equilibrium by means of the minimization of the Gibbs free energy of mixing via the Yokozeki EoS has been detailed in Appendix E. The capability of the EoS in predicting the phase equilibrium behavior in binary mixtures is challenged in Chapter 5, and the necessity of regressing Binary Interaction Parameters (BIPs) is also illustrated. The lack of data suggested applying the EoS to mixtures of Lennard-Jones fluids as device for evaluating BIPs from the LJ parameters σ and ε.
Chapter 6 portrays the application of the Yokozeki EoS for representing the global phase diagram of 5 binary mixtures considered as representative of all the mixtures of interest. The quantitative comparison between model and data for all the mixtures of interest has been presented in Appendix F.
It is worth mentioning that EoS parameters for pure components and BIPs are protected by confidentiality from Air Liquide, so any information concerning their values has been presented within this manuscript.
1 Air distillation
Air is indispensable to life and an important resource at the same time. It is approximately a ter-nary mixture of nitrogen, oxygen, and argon.
Nevertheless, it contains changeable quantities of many other substances like rare gases, carbon dioxide, hydrogen, methane, carbon monoxide, oxides of nitrogen, NOx, and of sulfur, SOx.
To illustrate, Table 1.1 gives an example of an aver-age distribution of the substances in the air mixture. In Table 1.1, distinction is made between fixed compo-nents and impurities [1].
Nitrogen and oxygen are among the most common commodity chemicals produced all over the world, and their commercial uses are many. For instance, nitrogen is used to shield materials from contact with oxygen, in ordinary light bulbs, in manufacturing stainless steel, in military aircraft fuel system to reduce fire hazard, to produce ammonia, and as a refrigerant. Refineries, pe-trochemical plants and marine tankers use nitrogen to remove dangerous vapors and gases from equipments, tanks and pipelines and to maintain an inert and protec-tive atmosphere in tanks storing flammable liquids.
Also oxygen is used in primary metal production and in petroleum refining; others industrial areas are the health services, power generation, catalytic oxida-tion, oxy-combustion and paper industry.
Taking into account that air contains large amounts of nitrogen and oxygen, it is consequently used for ob-taining these compounds and to satisfy practically all the industrial requires. The choice of the production procedure for separating nitrogen and oxygen depends on the quantity and quality that are re-quested.
1.1 Air separation technologies
Depending on the commercial purposes, a general industrial application could mainly ask two different qualities of oxygen or nitrogen: high-purity and low-purity. For high-purity quality the oxygen (or nitrogen) content must be higher than 98%, while low-purity quality is referred to con-tents comprised between 85% and 98% [1]. The three main procedures for air separation are mem-brane, adsorption, and distillation. Table 1.2, a comparison in terms of capacity range and purity of the final products, presents the major advantages of the air separation technologies.
Table 1.2: The three processes of air separation [2].
Process Development Purity Capacity Advantages
Membrane 1980 N2: 95% to 99.9% < 80 T/D to 95% < 5 T/D to 99.9% Small investment Simple operation Adsorption 1970 O2: 90% to 95% N2: up to 99.9% 5 T/D to 150 T/D Small investment Quick start up Distillation Near 1900 O2: 85% to 99.7% N2: up to 10 ppb of Ar, Kr, Xe 100 T/D to more than 4000 T/D Large production Energy efficient Gaseous and liquid products
Table 1.1: Air composition [1].
Constituent Volumetric composition
Fixed components N2 78.084 ± 0.004% O2 20.964 ± 0.002% Ar 0.934 ± 0.001% CO2 0.033 ± 0.003% Ne 18 ± 0.04 ppm He 5.2 ± 0.05 ppm Kr 1.14 ± 0.01 ppm Xe 0.086 ± 0.001 ppm H2 0.05 ppm Impurities(1) H2O 0.1–2.8% CH4 1–6 ppm CO 0.06–1 ppm SOx 0.1–1.0% NOx 0.52 ppm O3 0.01–1 ppm Rn 6 × 10⁻³ ppq
(1) In ambient air, including dust, pollen and local pollutants.
Membranes technologies exploit the selective permeation of the substances in the mixture to be separated with respect to porous or non-porous synthetic membranes of polymers such as polyethy-lene or cellulose acetate. This kind of technology has been developed since the beginning of the 80’s, and it is principally used for small operations of hydrogen or moisture removal, and separation of nitrogen from air up to 99.9%. The most advanced membrane technology in the world is the Air Liquide MEDAL hollow fiber membrane, Figure 1.1.
Figure 1.1: Air Liquide MEDAL membrane
tech-nology for nitrogen production.
Figure 1.2: Principle of the Air Liquide FLOXAL
adsorption technology for oxygen and nitrogen production.
The adsorption separation process is based on fixing nitrogen and air impurities on a porous solid substance called adsorbent, typically zeolite. The separation occurs thanks to electrostatic attraction between these components and the metal cations within the zeolite framework.
Among adsorption plants of various types, Pressure Swing Adsorption (PSA) plants have found the largest application worldwide. A schematic representation of the Air Liquide FLOXAL PSA technology is shown in Figure 1.2. To sum up, in a PSA plant the feed air enters a row of adsorbers wherein water, carbon dioxide and nitrogen are sequentially adsorbed. Oxygen passes through the bed and is collected as final product with purity from 90 to 95%. A mixture with a nitrogen content from 80% to 90% is desorbed from the bed by pumping it with a vacuum pump, while high-purity nitrogen could be obtained by dedicated PSA technologies working on the same principle.
Instead of using pressure swings to selectively adsorb/desorb air components, temperature swing adsorption technologies involve temperature variations. Adsorption technologies are especially used for small to medium requirements, where the high-purity product desired is nitrogen or the low-purity oxygen demand is economically competitive with the cryogenic technologies. The adsorption process has known a rapid growth since the beginning of the 1990’s, but it cannot replace the cryo-genic processes when a large request of high-purity nitrogen and high-purity oxygen is needed.
The distillation process is a cryogenic technology which has been developed since the beginning
of the 20th century, when Carl von Linde (Germany) and George Claude (France) devised processes
for the air liquefaction and its subsequent distillation. The importance of this process depends heavily on its capability in providing extremely pure nitrogen and oxygen also in the liquid state. The production capacity ranges from 100 T/D up to more than 4000 T/D, with an energy
consump-tion of only 0.33 kWh for Nm3 of oxygen produced, [2].
1.2 Cryogenic air separation
Cryogenic air separation is based on the principle of fractional distillation. This process involves liquid and vapor phases and air components are separated on the basis of differences in boiling point and of relative volatility.
The whole process depends consequently on vapor-liquid equilibria occurring within the distilla-tion column, thus important informadistilla-tion for the plant design are saturadistilla-tion lines of the main air
components, Figure 1.3, and vapor-liquid equilibria of the nitrogen-oxygen and argon-oxygen mix-tures, Figure 1.4 and Figure 1.5.
Figure 1.3: Saturation lines of the three main air
com-ponents, [3].
: nitrogen; : argon; : oxygen.
Each saturation line in Figure 1.3 extends from the triple point up to the critical point of the cor-respondent substance. These points have not been pointed up in Figure 1.3 because its prior aim is showing the evolution of the saturation lines of the main air components and introducing some im-portant remarks for air distillation.
As stated above, in the distillation process a liquid phase is needed. According to Figure 1.3, the first note is that the process temperature must be at least lower than the critical temperature of oxy-gen, about 155 K (~ -120 °C), for distillation to be carried out. In this case, pure oxygen can be in the liquid phase depending on the pressure. Furthermore, this temperature should be even lower to keep the operative pressure close to the atmospheric value (0.1 MPa) and limit the operational costs. As a result, the air distillation is commonly referred as cryogenic separation due to the low oper-ative temperatures, which is about 100 K, (~ -170 °C).
A second important note is the mutual positioning of the three saturation lines. Nitrogen is the most volatile fluid among the main air components, while oxygen is the less volatile. The saturation line of argon is close to the oxygen one, and this fact results in the necessity of realizing further treatments in handling with their small relative volatility.
Assuming air being a ternary mixture of nitrogen, oxygen, and argon, a vapor rich in nitrogen is obtained from a first distillation column, while oxygen and argon feed a second column in the liquid phase to be separated, being less volatile than nitrogen. Details are given in section 1.2.2.
To a fair approximation, the composition of argon in the first column can be neglected, then a ni-trogen-oxygen mixture can be considered to account for the equilibrium behavior in this column. The argon-oxygen mixture is instead representative of the equilibria occurring in the second one.
To fix ideas, three equilibrium behaviors of the binary mixtures nitrogen/oxygen and ar-gon/oxygen at three different pressures have been portrayed in Figure 1.4 and Figure 1.5, respec-tively.
The diagrams in Figure 1.4 and Figure 1.5 are the typical yx equilibrium mole fractions of binary mixtures used for the industrial planning of distillation columns. The shape of a general isobaric yx curve is an important aspect seeing that the height of the distillation column heavily depends on its deviation from the diagonal line, where y=x.
This deviation depends in turn on the difference in boiling points and relative volatility, which directly give a measure of how easily two substances can be separated by distillation. The greater the difference and the relative volatility, the easier the distillation.
Figure 1.4: Molar fractions of nitrogen in the liquid and
vapor phases in the N2/O2 system at 0.1, 0.5 and 1 MPa,
[4].
Figure 1.4 and Figure 1.5 show that a pressure increase is followed by a leveling of the yx curve towards the x=y line, thus operating distillation at low pressures facilitates cryogenic air separation.
Figure 1.5: Molar fractions of argon in the liquid and
va-por phases in the Ar/O2 system at 0.1, 0.5 and 1 MPa, [5].
A rather complex process is expected for the separation of argon and oxygen because of their small relative volatility, as it can be deduced from Figure 1.5. This results in a more challenging se-paration and in a higher distillation column.
1.2.1 ASU block diagram and P-h diagram
The previous section places emphases on the cryogenic aspect of the air distillation and the ne-cessity of working at temperatures around 100 K.
Considering that the atmospheric air temperature is usually far away from temperatures needed for its liquefaction, important efforts and investigations have been done by the pioneers of this tech-nology to fill a gap of about 200 degrees.
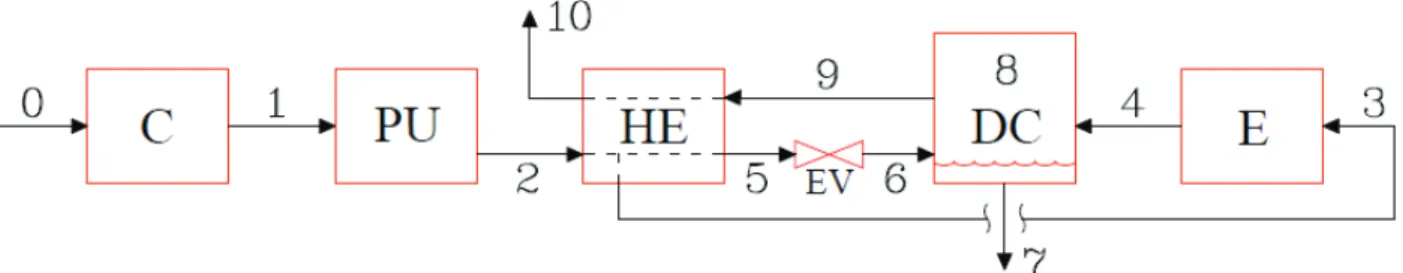
The result of these researches is an Air Separation Unit (ASU) consisting of five main compo-nents, Figure 1.6. The main components are a Compressor C, a Purification Unit PU, a Heat Ex-changer HE, an Expander E, and the Distillation Column DC.
To provide a description of the processes involved in the ASU of Figure 1.6, the Pressure-enthalpy diagram (P-h diagram) of Figure 1.7 and the ASU block diagram resumed in Figure 1.8 have been considered. Numbers and capital letters used in these figures have been reported in their captions.
Figure 1.6: ASU main components.
Air Liquide technology, [2]: C: Compressor; PU; Purification Unit; HE: Heat Ex-changer; DC; Distillation Column; E: Expander.
Inlet air, point 0 in Figure 1.7, is at atmospheric pressure (0.1 MPa) and a temperature of 27 °C (300 K) has been chosen. At these conditions, the correspondent air entropy and enthalpy are about 6.87 kJ/(kg·K) and 300 kJ/kg, [6].
At 0.1 MPa and 300 K air is in the gaseous state. Keeping constant the pressure, the temperature should be reduced under 82 K for obtaining a liquid phase and entering in the vapor-liquid dome, that is the area underneath the saturated liquid line, in gray, and the saturated vapor line, in red. The saturated lines join together in the air critical point, placed at about 132.6 K and 3.78 MPa, [6].
Each green line within the dome represents a specific quality, which is the ratio between the va-por mass and the total air mass. The quality ratio ranges between 0 on the saturated liquid line and 1 on the saturated vapor line.
The P-h diagram of Figure 1.7 is completed by isentropic curves, in magenta, and isothermal lines, in blue.
When the air temperature is lower than the critical value, the correspondent isotherm splits in two curves: the one on the left of the dome represents air in the liquid phase, whereas the second one is on the right of the dome representing air in the vapor phase. The part of the blue line drawn within the dome is artificial and does not correspond to a real behavior; its only role is to join to-gether the equilibrium saturated phases, placed on the saturated liquid and vapor lines.
Remembering that air distillation requires air liquefaction, the main goal of an ASU is to bring atmospheric air from point 0 to a point somewhere in the vapor-liquid dome.
With reference to Figure 1.6-Figure 1.8, the following processes are involved in an ASU.
The inlet air (0) is compressed by means of the compressor C up to point 1 in the P-h diagram. The pressure of point 1 is 0.7 MPa and its temperature is greater than 300 K because air undergoes heating during compression.
Figure 1.7: Pressure-enthalpy diagram of air, [3].
: constant entropy lines; : constant quality lines; : isotherms; : saturated vapor line; : saturated liquid line; : main ASU processes.
Reference state for air in [3]: T = 298.15 K, P = 0.001 MPa, h = 3453.2 kJ/kg, s = 34.532 kJ/(kg×K).
Flows: 0: inlet air; 1: compressed air; 2 compressed and purified air; 3: cooled vapor; 4; expanded vapor; 5: subcooled liquid; 6: air at vapor-liquid equilibrium; 7: saturated liquid; 8: saturated vapor; 9: cold vapor product; 10: outlet steam.
Figure 1.8: ASU block diagram: main components and flows within an ASU.
Components: C: Compressor; PU; Purification Unit; HE: Heat Exchanger; EV: Expansion Valve; DC; Distillation Col-umn; E; Expander;
The compressed air (1), is then purified in the purification unit PU in order to remove impurities and cooled typically down to its inlet temperature, 300 K. This compressed and purified air is represented by point 2.
Further cooling is obtained in the heat exchanger HE by means of a thermal exchange with the cold vapor product (9) coming from the distillation column DC. A part of the compressed and puri-fied air (2) is withdrawn from the HE at a temperature of about 160 K, point 3 in Figure 1.7, whe-reas the remaining flow of air is liquefied and cooled down to 95 K, point 5.
The possibility of heavily reduce the air temperature from point 2 to point 5 is ensured by the expander E, where the cooled vapor (3), is isentropically expanded down to atmospheric pressure, point 4. The expanded vapor (4) enters the DC lowering the temperature of the cold vapor product
(9) leaving the column. This allows the liquefaction of the compressed and purified air (2) in the HE, thus the process within the expander is usually called “cold production”.
Point 5 is representative of a subcooled liquid which pass through a Joule-Thompson Expansion Valve EV, thus the pressure is isoenthalpically reduced towards point 6. Point 6 is underneath the vapor-liquid dome, thus the air feeding the distillation column DC splits in a saturated liquid phase (7), and a saturated vapor phase (8). Saturated liquid and vapor phases have two different pressures on the same isotherm: the saturated liquid is at the bubble pressure, whereas the saturated vapor is at the dew pressure of air. According to Figure 1.7, Points 7 and 8 are at about 82 K, and 0.14 MPa and 0.1 MPa, respectively.
The cold vapor product (9) is the result of the mixing between the saturated vapor (8) and the expanded vapor (4), thus its temperature will depend on their flows. Nevertheless, in Figure 1.7 the temperature of point 9 has been approximated to that of point 4.
The cold vapor product (9) feeds the heat exchanger HE cooling and liquefying the purified and compressed air (2) coming from the PU. As a result, the cold vapor product is heated up to a tem-perature close to the inlet air temtem-perature. The outlet steam is indicated by point 10 in Figure 1.7.
Points 0 to 10 in Figure 1.7 represent only qualitatively the operative conditions of the air distil-lation and are not referred to a specific ASU configuration.
The description of the main processes briefly presented here above has been done considering isobaric purification and heat exchange. Furthermore, ideal processes have been considered: for in-stance, point 4 has been obtained from point 3 considering an ideal isentropic expansion in the E.
1.2.2 ASU flow diagram
A detailed representation of a conventional cryogenic ASU is presented in Figure 1.9. In Figure 1.9, capital letters have been used for operating units, while lowercase letters are referred either to liquid or gaseous flows. The abbreviations are summarized in Table 1.3 along with their meaning.
Table 1.3: Abbreviations used in the ASU flow diagram.
Capital letters Lowercase letters
Mark Meaning Mark Meaning
F Filter w Waste
C1 Compressor 1 gox Gaseous oxygen
DCAC Direct contact aftercooler lox Liquid oxygen
CT Chiller tower hpgan High pressure gaseous nitrogen
WT Waste tower lpgan Low pressure gaseous nitrogen
PU Purification Unit ncg Non-condensable gases
C2 Compressor 2 ullq Upper lean liquid
HE1 Heat exchanger 1 lllq Lower lean liquid
EV Expansion Valve lro Liquid rich in oxygen
E Expander gro Gas rich in oxygen
TH Top hat ca Crude argon
LPC Low pressure column ra Raw argon
HE21 Heat exchanger 2
HPC High pressure column
CAC Crude argon column
HE3 Heat exchanger 3
HE4 Heat exchanger 4
P Pump
1
usually called reboiler-condenser.
It is worth mentioning that the flow diagram of an ASU is the result of a detailed design specifi-cally tailored for the on-site customer needs, thus varying from the scheme of Figure 1.9. The inten-tion of the author is to discuss here a general ASU configurainten-tion.
Furthermore, in Figure 1.9 the term air has been roughly used without taking into account the specific temperature and pressure conditions of the different air flows within the ASU.
After being filtered, the atmospheric air is compressed in the main air Compressor C1. It is then cooled by means of the Direct Contact Aftercooler DCAC and the Chiller Tower CT. The main ob-jective of such operation is to cool the air before the Purification Unit PU. In addition, cooling air allows for a moisture removal by condensation, reducing the water load to be vented in the PU.
Figure 1.9: Air separation unit flow diagram.
A part of the dry waste gas leaving the ASU is used in the Waste Tower WT, to chill a circulating cooling water stream. This latter flows in counter-flow to the air stream in the DCAC and the CT decreasing the compressed air temperature.
The compressed and precooled air is then sent to the PU, where unwanted substances are re-moved. The importance of this step has been discussed later in section 1.2.4.
Following the diagram of Figure 1.9, a part of the purified air leaving the purification unit is drawn off and compressed in a booster Compressor C2 before entering the Heat Exchanger HE1.
The uncompressed air enters in the Heat Exchanger HE1 where it is split; a part is drawn off and isentropically expanded, generally by means of a turbine, the Expander E.
The expanded air is sent to the Low Pressure Column LPC, while the colder air stream feeds the bottom of the High Pressure Column, HPC. The compressed air leaving the HE1 is expanded in the Expansion Valve EV before feeding the middle of the LPC.
Both the low pressure and the high pressure columns are provided with many sieve tray sheets on which the rising vapor and the sinking liquid reach the vapor-liquid equilibrium. In some cases, trays are replaced by aluminum structured packing, resulting in a greater contact surface favorable for the heat transfer.
Since nitrogen is more volatile than oxygen, nitrogen moves from the liquid to the vapor phase, while oxygen makes the opposite path. In operative conditions, a nitrogen-enriched vapor is pro-duced at the top of the columns while an oxygen-enriched liquid is propro-duced at their bottoms.
The double column system couples a single condenser column underneath a single boiler col-umn. In a single condenser column fed at the bottom with a gaseous mixture of nitrogen and oxy-gen, the high-purity distillation product is a nitrogen-enriched gas leaving the top of the column. On the other hand, in a single reboiler column fed at the top with a liquid mixture of a nitrogen and oxygen, the high-purity distillation product is an oxygen-enriched liquid leaving the bottom of the column. As a consequence, the core of the double column ASU is the reboiler-condenser, which provides both heat transfer effects in the same Heat Exchanger, HE2. This unit allows achieving the most productive solution in terms of purity and amount of products.
The HPC is supplied to the bottom with the compressed and cooled feed air coming from the HE1, to the middle with air at the vapor-liquid equilibrium obtained by means of the Expansion Valve EV, and to the top with a nitrogen-enriched liquid previously condensed in the HE2. It should be noted that gases like hydrogen, helium, and neon, are more volatile than nitrogen and purifica-tion units are not designed for their removal. These gases will never condense at the top of the HPC because the sinking liquid is not cold enough. Therefore, these Non-Condensable Gases, ncg, are vented thanks to a permanent purge installed in the proximity of the HE2.
The nitrogen-enriched liquid condensed in the Heat Exchanger HE2 derives from a gas rich in nitrogen moving from the top of the HPC to the HE2. The heat of condensation is adsorbed by a liquid rich in oxygen produced at the bottom of the LPC which enters in the HE2. This liquid par-tially vaporizes in the HE2, providing the rising vapor which exchanges energy and matter with a liquid flow sinking from the top of the low pressure column.
The Liquid Rich in Oxygen, lro, leaving the bottom of the high pressure column, has an oxygen content of about 40% [2]. In order to reduce the oxygen losses in the Waste, w, and to increase the nitrogen production, two lean liquids are drawn off from the HPC and two corresponding refluxes are provided to the LPC.
In addition, a third column called top hat or “minaret” is introduced in the ASU to further purify waste nitrogen leaving the top of the LPC. The Lower Lean Liquid, lllq, exits the mid-HPC and feeds the top of the LPC, while the Upper Lean Liquid, ullq, is a high-purity nitrogen liquid feeding the Top Hat, TH. A part of this ullq is drawn off and sent to the Liquid Nitrogen, lin, tank.
Also the remaining high-purity oxygen and nitrogen products are obtained in correspondence of the reboiler-condenser. Liquid Oxygen, lox, is drawn off and stored in apposite tank.
With reference to the oxygen production, there are two primary ASU configurations. In the ga-seous oxygen process, a cold stream of Gaga-seous Oxygen, gox, is drawn off from the HE2 area, warmed against incoming air in the HE1, and compressed to pressure required by the customer.
In the Liquid Oxygen process, lox is pumped to the product pressure and vaporized against in-coming air always in the HE1. In turn, the gaseous nitrogen demand can be satisfied by means of gaseous streams coming either from the HPC or the LPC. In this case, it is commonly used referring respectively to High Pressure Gaseous Nitrogen, hpgan, and Low Pressure Gaseous Nitrogen, lpgan.
A third heat exchanger, HE3, is realized for improving the energy efficiency and managing the thermal content of the refluxes moving from the HPC to the LPC.
1.2.2.1 Argon and rare gases separation
Up to now only nitrogen and oxygen have been considered.
The third main component of air is argon, whose vapor pressure curve is close to the oxygen one. The most of argon entering the column will consequently go to the liquid rich in oxygen, lro, thus leaving the bottom of the high pressure column and moving towards the low pressure column.
Composition profiles in the LPC show that near the middle of the column the concentration of argon in the gas phase reaches its maximum, around 15%. Because at this point the nitrogen con-centration is not negligible, it follows that the gaseous mixture drawn off from LPC is made at a lower level, where the nitrogen content is only 0.1%, [2].
This mixture, called Crude Argon, ca, is sent to the bottom of the Crude Argon Column, CAC, in order to eliminate oxygen. This fourth column is fed at the top with the lro coming from the HPC, and a fourth heat exchanger, HE4, is installed. The CAC allows reducing the oxygen content down to 2-3%, thus Raw Argon, ra, is drawn off and sent to a further treatment. A Gas Rich in Oxygen, gro, and a lro stream are sent back to the HPC. Furthermore, to a fair approximation, all nitrogen coming in the column comes out in the gro stream due to its highest vapor pressure curve.
The further purification of ra is made in two alternative ways. In the first case, oxygen removal is given by an exothermic chemical reaction with hydrogen. This process occurs in a “deoxo” reac-tor full of alumina balls covered with palladium. ra leaving the CAC is heated to ambient tempera-ture and compressed up to 5 bars before entering the reactor, [2].
The final gas contains water steam (which is a product of the reaction between oxygen and hy-drogen) and hydrogen seeing that an excess of hydrogen with respect to the stoichiometric quantity is added for a complete oxygen removal. As a consequence, the gas is successively cooled and dried to remove water and then treated in a supplementary column in order to remove any trace of hydro-gen and of the remaining nitrohydro-gen. The process above is called “hot purification” due to the high quantity of heat produced in the deoxo reactor, and the supplementary column where argon is puri-fied is known as the pure argon column.
In order to reduce the hydrogen consumption in hot purification processes and considering its as-sociated difficult operations, it is today preferred to realize taller CAC, up to almost the double col-umn height. In this configuration, called “argon cryogenic separation”, ca with less than one ppm of oxygen is obtained from the CAC and sent to the pure argon column for nitrogen removal.
The inlet air contains other noble gases then argon. Krypton and xenon are much less volatile than the main air components, thus accumulating in the lox at the bottom of the LPC. On the other hand, helium and neon are much more volatile then main air components, thus accumulating in the lpgan at the top of the LPC and as ncg in the proximity of the reboiler-condenser, HE2. Special units are then designed in the ASU in order to extract raw mixtures of Kr/Xe and He/Ne from an oxygen-enriched flow and a nitrogen-enriched flow, respectively. These raw mixtures are after-wards sent to dedicated separation and purification units.
1.2.2.2 Cold box
The blue line in Figure 1.9 separates the non-cryogenic and the cryogenic areas of an ASU. Operative cryogenic temperatures are required for cooling the air and make the distillation possible. Thus, cold production is needed together with an efficient insulation.
All the cold parts within an ASU are confined in steel boxes in order to maintaining cryogenic temperatures, [2]. These boxes are filled with an insulator like perlite and rock wool, and the whole system undergoing insulation is commonly called “cold box”.
In spite of the insulation, cold losses not prevented by the insulation must be considered in the cold balance, in addition to thermal losses arising from the incomplete recovery of the cold of the distillation products. These last losses are indicated by the temperature difference at the warm end of all the heat exchangers within the ASU. Therefore, the cold production is designed to cover all the thermal losses and to assure the production of liquid flows required from the customer.
An efficient indicator of the cold balance is the level of lox at the bottom of the LPC, and it is re-quired to equilibrate the cold balance by increasing the cold production if this level cannot be main-tained. In an ASU, cold is produced manly by air expansion through a turbine, the expander E in Figure 1.9, and vaporization of the compressed lox drawn off from the bottom of the LPC against compressed and purified air in the heat exchanger HE1.
1.2.3 ASU operative conditions
The reboiler-condenser, HE2, is the device needed to condense Gaseous Nitrogen, gan, at the top of the HPC and to vaporize Liquid Oxygen, lox, at the bottom of the LPC. The possibility of trans-ferring heat from the gan to the lox is ensured only by having gan warmer than lox. As a conse-quence, the energetic performance of the whole process depends on the temperature difference ∆T between the lox at the bottom of the LPC and the gan at the top of the HPC. Furthermore, this ∆T implies a pressure difference between the top and bottom sides of the reboiler-condenser, and this last value is important for determining the pressure at which feed air needs to be compressed.
Considering that nitrogen is more volatile than oxygen, the pressure of the HPC must be greater than the LPC pressure to get nitrogen warmer than oxygen. This explains why the columns are called high pressure column and low pressure column.
Figure 1.10 is an example of the pressure drop chart used in the planning stage of an ASU. Ac-cording to Figure 1.10, blue and black lines are referred to the waste and the air circuit, respective-ly.
Figure 1.10: Example of the pressure drop chart of an ASU.
∆P is the pressure drop which occurs in the corresponding unit; w: waste; air: atmospheric air.
Waste are drawn off from the top of the LPC, warmed against incoming air in the HE1, and sent to the PU before leaving the plant. The inlet air is compressed, purified and cooled before entering the bottom of the HPC. Cooled waste leaving the PU and inlet air are at atmospheric pressure.
Each operation unit occurs with a pressure drop, indicated by the corresponding ∆P in Figure
1.10. The low pressure drops occurring in piping have not been reported in the pressure drop chart of Figure 1.10, but have to be taken into account during the planning stage.
The pressure at the top of the LPC is determined by the pressure drops of the waste circuit. Therefore, this pressure is determined from the atmospheric pressure by adding the pressure drops
in the PU, ∆PPU, in the HE1, ∆PHE1, and piping. A pressure drop is required in the PU unit in order
to provide the minimum pressure needed for the purification.
The pressure at the bottom of the LPC is then obtained increasing the LPC top pressure by
∆PLPC, the pressure drop of the trays or of the structured packing. This pressure corresponds to the
vapor pressure of the liquid oxygen evaporating in the HE2, thus imposing the saturation tempera-ture at the bottom of the LPC.
The temperature difference, ∆T, between the bottom of the LPC and the top of the HPC is a
proper characteristic of the reboiler-condenser. There are principally two kind of devices used in ASU: bath vaporizers and film condensers. The comparison and the detailed description of their
![Figure 2.4: Types of solid-liquid phase diagrams identified by Matsuoka, [27].](https://thumb-eu.123doks.com/thumbv2/123doknet/2997786.84103/45.892.212.681.178.597/figure-types-solid-liquid-phase-diagrams-identified-matsuoka.webp)