OATAO is an open access repository that collects the work of Toulouse
researchers and makes it freely available over the web where possible
Any correspondence concerning this service should be sent
to the repository administrator:
[email protected]
This is an author’s version published in: http://oatao.univ-toulouse.fr/23143
To cite this version:
Iranzo, Audrey
and Chauvet, Fabien
Synthesis of in situ purified iron nanoparticles in an
electrochemical and vibrating microreactor: study of ramified branch fragmentation by
oscillating bubbles. (2019) Microfluidics and Nanofluidics. ISSN 1613-4982
Official URL : https://doi.org/10.1007/s10404-019-2211-4
and shape-controlled metal nP are highly desirable. The most common synthesis method is the “colloidal” batch synthesis in which a reductant solution (NaBH4 , sodium
citrate, etc.) is added, in a controlled manner, to a solution of the metal salt. Specific compositions (metal salt, type of reductant, surfactants/polymers to stabilize the particles) and conditions (temperature, mixing, flow rate, etc.) are determined, for a given metal, to (1) favour nucleation events and limit the growth of the particles and (2) pro-duce particles with a controlled shape and a narrow size distribution [see, for example the batch synthesis of Fe nP (Wang and Zhang 1997)]. It has to be noted that, after the synthesis, a purification step is required to separate the produced nP from the remaining reacting species and by-products [dialysis, ion exchange resin, centrifugal or filtration processes (Sweeney et al. 2006)].
Nevertheless, this synthesis method suffers from weak reproducibility in size distribution and a slow screening capability (Marre and Jensen 2010). The use of microre-actors, to carry out this synthesis continuously, has led to a significant progress in terms of screening capability, particle size distribution and control of particle shape. All of this is thanks to the high degree of control of mix-ing and transfers (hydrodynamics, mass and energy) in specifically elaborated microreactors (Song et al. 2008; Yang et al. 2010; Zhang et al. 2010; Marre and Jensen
2010; Ma et al. 2017). Two main types of microreactor have been employed: continuous flow-based and droplet-based microreactors.
In the work of Wagner et al. (2008), a continuous flow-based microreactor is used to synthesize Au and Ag nP; the metal precursor stream is mixed to the reductant stream in a passive micromixer, then the solution flows in a micro-channel in which the growth, and thus the particle size, is controlled by the residence time. This configuration has two main drawbacks: (1) residence time distributions are often wide that prevents to obtain narrow particle size distribu-tions (Song et al. 2008; Marre and Jensen 2010) and (2) clogging and particle adhesion on the internal walls can occur (Song et al. 2008; Ma et al. 2017).
With droplet-based microreactors, these drawbacks are avoided. The reactive mixture is confined in aqueous drop-lets which are transported along the microchannel by an oil phase [refer to the work of Duraiswamy and Khan (2009) for the synthesis of Au (rod-shaped) nP with this method]. How-ever, these microreactors present the following drawbacks:
• the device materials (glass/silica, SU-8 resin based sys-tems) and the fabrication are generally expensive (clean room facilities are required) (Ma et al. 2017)
• even if they are used in small quantities, the reductants (such as NaBH4 ) increase the production cost and are
toxic, corrosive, and flammable (Wang et al. 2014)
• a purification step is required as in batch synthesis (Ma et al. 2017).
Here, we propose the exploration of a new synthesis of metal nP in microreactor with the aim to overcome these drawbacks. The proposed method is based on the coupling of the direct electrochemical generation of metal particles (avoiding the use of reductant as NaBH4 ), in the form of
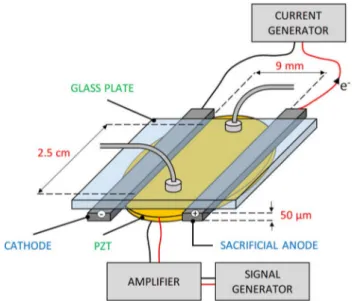
“ramified branches”, from a simple and cheap aqueous metal salt solution, with their fragmentation, by the action of low-frequency acoustic vibrations, releasing the particles. The fabrication of the designed “electrochemical and vibrating” microreactor does not require clean room facilities. It con-sists in the assembly of two thin (50 μ m) metal plates (the electrodes) between a piezoelectric disk (PZT, resonance frequency of 4 kHz) and a glass plate, see the sketch shown in Fig. 1. The formation mechanism of the ramified branches has already been explained in many works [see for example (Iranzo et al. 2017)] and it is briefly recalled here. The rami-fied branches are formed by galvanostatic electrolysis of the stagnant metal salt aqueous solution inside the microchan-nel. The constraint of electroneutrality forces the deposit to grow rapidly in the form ramified branches [growth velocity is equal to the velocity of the anions (Fleury 1997)]. These last grow by successive nucleation/growth events that leads to a fine branch structure made up of metal crystals whose can be nanometric and their size depends on the applied cur-rent density (Fleury 1997). This leads to the expectation of an external control of the produced nP in terms of size. The particles of interest are thus immobilized inside the micro-channel, allowing them to be flushed by a simple flow of water (deionized and deaerated), before their fragmentation, to avoid subsequent purification steps.
The proposed method is applied here for the produc-tion of Fe nP from FeCl2 as an electrolyte. In such a
thin gap cell, the growth of Fe branches is known to be accompanied by the formation of H 2 bubbles due to the
co-reduction of H + (Bodea et al. 1999; Grujicic and Pesic 2005; Iranzo et al. 2015). The influence of the operating parameters (applied current and concentration of FeCl2 )
on the obtained deposit morphology (spatial arrangement of Fe branches and H 2 bubbles) and the microstructure
of the branches, in the proposed microreactor design, has already been studied and optimal conditions have been determined (Iranzo et al. 2017). The purity of the pro-duced final solution (mass fraction of the metallic iron) has been estimated at ∼ 83 %, that is well higher than the typical purity at the end of a colloidal synthesis ∼ 10 % (Iranzo et al. 2017). The resulting deposit consists of an arrangement of long and parallel branches each one being surrounded by bubbles.
During the activation of the integrated PZT, the co-formed bubbles are expected to oscillate in such a way that they induce sufficiently fast fluid flows that fragment the branches and release the smaller particles that they are composed of. Indeed, when a bubble is subjected to a sound wave, with a frequency f close to its resonance frequency fr , its oscillations induce a stationary and
asym-metric flow (called acoustic streaming) in the liquid over a distance of the order of the bubble size (Tho et al. 2007; Rallabandi et al. 2014). In microfluidic systems, oscillat-ing bubble-induced flows have been implemented, essen-tially to enhance the mixing (Liu et al. 2002; Wang et al.
2009; Ahmed et al. 2009). Furthermore, in close vicinity to the interface, fast oscillating flows are also generated due to the bubble surface motion itself; this has been used for example to fragment dendrites under ultrasonic cavita-tion (Shu et al. 2012).
This study focuses on the fragmentation of ramified Fe branches by oscillating co-formed bubbles. Fragmentation scenes are visualised with a high speed camera for sev-eral conditions of vibrations: with variation of the ampli-tude, the frequency and the waveform of the signal sent to the PZT. The corresponding behaviour of the bubbles (motions and coalescence, oscillation modes) is described and analysed with the support of theoretical considera-tions on both bubble shape oscillaconsidera-tions and the “dancing bubble” effect. The fragmentation mechanism is studied comparing the structure of the branches, before fragmen-tation, to the produced particles (size distribution and TEM observations). The role of bubble oscillation on the fragmentation of the metallic branches is considered using a force balance between the mechanical stress and the mechanical resistance of the material. Finally, improve-ments of this method are discussed, as well as, the possible extension to other metals.
2 Experimental set‑up and methods
2.1 The electrochemical and vibrating microreactor
The description of the electrochemical and vibrating microreactor can be found in (Iranzo et al. 2017); here, we detail it briefly. The microreactor used consists of two 50 μm thick iron plates, assembled in parallel between a glass plate and the PZT disk working in radial mode (lead/ zirconate/titanate piezoelectric, resonance frequency = 4 kHz, capacitance = 20 nF, ABT-441-RC, Radiospare), see Fig. 1. The length of the electroactive zone is equal to 2.5 cm (Fig. 1). The assembly is held together using two clamps (not shown) that press on the glass plate and on the PZT.
2.2 Chemicals
The electrolytic solution (FeCl2 0.1 M) is prepared by
dis-solving FeCl2,4H2 O (99% Sigma-Aldrich) in deionized water
(18.2 M Ω·cm); no supporting electrolyte is used. This solu-tion, and also the deionized water used to flush and to col-lect the particles, are deaerated (to prevent O 2 co-reduction
during the electrodeposition and to limit the Fe corrosion) by Argon bubbling during 15 min ( ∼ 30 mL) before being collected by a gastight syringe (Hamilton 1 mL, 1001LT) and injected into the microreactor. Experiments are achieved at room temperature (18–22 ◦C).
2.3 Instrumentation
A syringe pump (Harvard PHD 22/2000) is used for the injections of the solutions. The electrodeposition is driven by applying an electric current of 1 mA (80 mA/cm2 ) between
the electrodes using a potentiostat (Autolab PGSTAT100N). The PZT is activated by an electric signal generated by a function generator (GF467AF, Radiospare) and amplified by a Falco WMA-300 amplifier. The fragmentation process is visualised by reflection using a fibre optic illuminator and a high speed camera (Photron APX/RS 3000) equipped with a 105 mm macro-objective.
2.4 Characterization
The structure of the Fe branches (before fragmentation) is observed by scanning electron microscopy (SEM) with a JEOL JSM 7100F TTLS or a JEOL JSM 7800F Prime-EDS. An automated morphological optical analyzer (Morphologi G3 Malvern × 50) is used to measure the wet particle size distribution up to the optical resolution limit. The produced
particles are also characterized by TEM with a JEOL JSM 2100F-EDS.
2.5 Description of the synthesis
The synthesis consists of five main phases (see Fig. 2):
• Phase 1: the microreactor is filled with the electrolyte
(FeCl2 0.1 M).
• Phase 2: the current is applied, the branches start to grow
on the cathode after a short depletion time ( ∼ 1 s). The branches grow following a columnar morphology with a constant growth velocity; H 2 bubbles nucleate and grow
at the top of the branches and they are continuously left behind the moving front (Fig. 3a). It has to be noted that these bubbles, called initial bubbles from now, are not spherical but squeezed inside this thin cell since their apparent average diameter, 114 ± 30 μ m, is higher than the cell depth (50 μm). It has been previously shown (Iranzo et al. 2017) that only 5% of the applied current is used for the formation of these bubbles. The oxidation of the anode, made of iron, prevents the production of both
O2 (bubbles never observed) and FeIII . The electrolysis is
stopped when the growth front reaches approximately the half the cell width (total duration ≈ 300 s). The branches thus formed consist of a dendritic structure exhibiting three levels of branching as shown in Fig. 3b. It has to be noted that this microstructure and its typical length scale have been observed on the entire analysed sample. This means that the same microstructure is continuously built during branches growth by galvanostatic electroly-sis. This is of a great importance to produce particles with a narrow size distribution.
• Phase 3: the branches are flushed by a flow of
deion-ized and deaerated water. A low flow rate, ∼ 100 μL/ min, is applied to avoid damaging the branches and dis-placement of the bubbles.1 The residual concentration
of FeCl2 , in the microreactor, depends on the duration Fig. 2 Representation of the different phases of the synthesis
1 The dissolution of the H
2 bubbles is negligible because of both the low solubility of H 2 in water ( ∼ 8.10−4 mol/L) and the low surface area of the liquid-gas interfaces (the bubbles are squeezed in this con-fined geometry).
of the flushing; a duration of 10 min is used here (the corresponding total injected volume is equal to ∼ 90 times the volume of the microchannel).
• Phase 4: the PZT is activated during ∼ 15 s. The
phenomena observed with the high speed camera are described in the following sections.
• Phase 5: a flow of deionized and deaerated water is
applied to recover the particles and remove the bubbles. These phases are repeated until the desired quantity of particles is collected.
3 High speed visualisations of branch
fragmentation and characterization
of the produced particles
After the growth and the flush of the Fe branches, an ampli-fied electric signal is sent to the PZT to induce the vibrations into the microreactor. Several experiments have been carried out varying the frequency f (100 Hz–4 kHz), the peak to peak voltage Vpp (120–250 V, after amplification) and the
waveform (sinusoidal, triangular and square). The signal is symmetrical (centred on 0). The corresponding image sequences, acquired with the high speed camera (acquisi-tion frequency = 1500 FPS, exposure time = 1/1500 s), are shown in Figs. 4, 5 and 6. For all investigated cases, the pattern of the branches is strongly disturbed by the PZT activation.
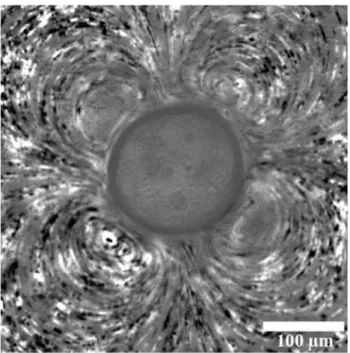
The image sequence obtained using a sinusoidal signal (with f = 4 kHz and Vpp = 250 V), Fig. 4a shows that the Fig. 3 The ramified iron branches and the co-formed H 2 bubbles
gen-erated by the galvanostatic electrolysis (FeCl2 0.1 M, 80 mA/cm2 , 300 s), a optical visualisation before the opening of the microreac-tor (centre of the microreacmicroreac-tor), b observation of the structure of the branches by SEM
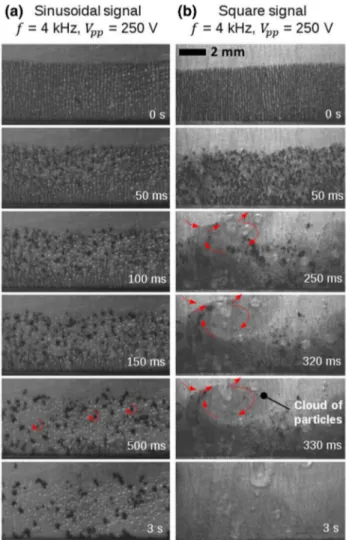
Fig. 4 Image sequences of the fragmentation process for sinusoidal
(a) and square (b) signals; the arrows indicate the observed particle motions; f = 4 kHz and Vpp = 250 V; acquisition frequency = 1500 FPS, exposure time = 1/1500 s
branches are broken and the fragments are grouped into several blocks between the bubbles. Some blocks, not fully jammed between their neighbouring bubbles, are set in a stationary rotational motion in the plane of the channel (see the red arrows in Fig. 4a and the video in the supplemen-tary information Frag_Sin_4kHz_250V). These rotational motions are the signature of the expected bubbles micros-treaming which is known to generate vortex flows (Liu et al.
2002; Tho et al. 2007). Nevertheless, these flows are not sufficiently fast to fragment the branches into small parti-cles, even using the maximum value of Vpp of the examined
range (as shown in Fig. 4a). It has to be noted that the bubble network is unaffected by the sinusoidal vibration of the PZT (no motions and no surface deformation). The fragmentation process, using a triangular signal (not shown), is similar to the one using a sinusoidal signal (branch breakage and block formation).
By performing the same experiment, but using a square signal instead of a sinusoidal signal (Fig. 4b), a more com-plex scene is visualised. Some of the initial bubbles (initially located between the branches) coalesce to form larger bub-bles. The resulting bubbles exhibit surface deformations, splitting/coalescence events and motions inside the channel.
Microstreaming is also observed for the larger and unstable bubbles formed by coalescence (refer to the red arrows in Fig. 4b and the video in supplementary information Frag_ Sq_4kHz_250V). It is barely visible in the image sequence of Fig. 4b, but the initial bubbles (not still coalesced) gener-ate also microstreaming as it can be clearly seen in Fig. 7. In this case, in a dedicated experiment, a single bubble, with a diameter ∼ 100 μ m, oscillates under a low amplitude (14 V) square signal. As when using a sinusoidal signal, flows aris-ing from bubble microstreamaris-ing break the branches and put in motion the resulting fragments. Since the flows generated by the unstable large bubbles spread over larger areas than flows generated by the initial bubbles, the fragments end up being attracted to the surface of unstable bubbles where they are fragmented. This fragmentation process is visible in Fig. 4b where a group of branch fragments is “aspirated” by a large unstable bubble (exhibiting splitting/coalescence events). When they reach the surface of the corresponding split bubbles, they are fragmented and the ejection of a grey cloud is observed. This cloud is composed of particles that are too small to be visualised with the optical resolution used of 20 μ m (the size of one pixel on the images).
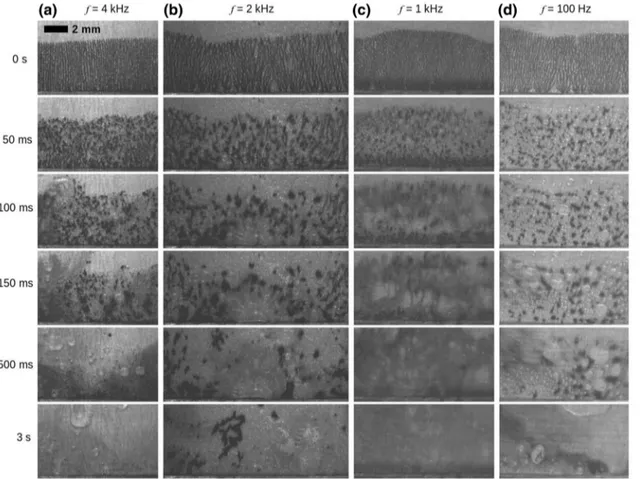
Fig. 5 Image sequences of the fragmentation process for f = 4 kHz (a), f = 2 kHz (b), f = 1 kHz (c) and f = 100 Hz (d); Vpp = 250 V; acquisition frequency = 1500 FPS, exposure time = 1/1500 s
The wet particle size distribution (for f = 4 kHz, Vpp =
250 V and a square waveform) has been measured with an automated morphological optical analyser. The sample is a drop of the produced solution placed between two glass slides. The obtained distribution curve (Fig. 8) shows that the maximum particle size, in terms of circle equivalent diameter (based on the equivalent projected surface area), is effectively lower than 20 μ m. The shape of the curve sug-gests a significant amount of micrometric and submicromet-ric particles with a minimum size of less than the optical resolution limit ∼ 500 nm.
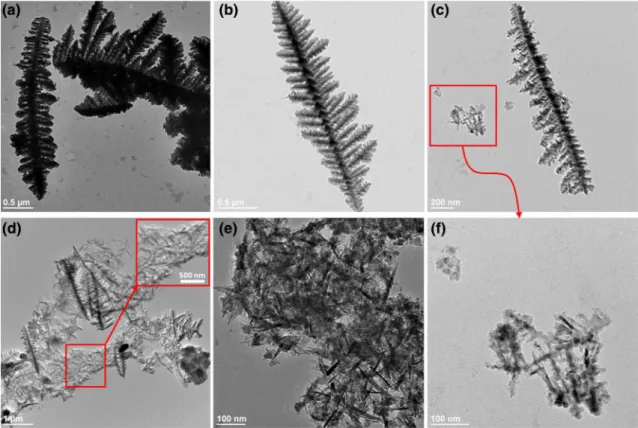
In Fig. 9, the TEM observations reveal two main types of particles:
• broken (Fig. 9a–d) and partially “plucked” dendrites (snatched secondary arms, Fig. 9c) whose length and width are, respectively, ∼ 2 μ m and ∼ 1 μ m for the exam-ined samples; these dendrites are certainly secondary
dendrites detached from bigger primary dendrites as shown in Fig. 3b; their sphere equivalent specific surface, ∼1.5 × 10⁸ m −1 (from the estimation of the perimeter to surface ratio by image processing of Fig. 9b), corre-sponds to the specific surface of a spherical particle with a diameter of 40 nm
• small needle-like particles, ∼ 200 nm long and ∼ 20 nm in diameter, and other fragments whose shape is difficult to observe since they are superimposed and grouped into clusters (Fig. 9d–f); these nanometric fragments probably come from the fragmentation of the tertiary dendrites of the broken (secondary) dendrites described just before; the specific surface of these particles is ∼ 2 × 10⁸ m −1
that corresponds to a spherical particle with a diameter of 30 nm.
The size range of the broken dendrites corresponds to the decreasing part of the distribution curve for the particle sizes
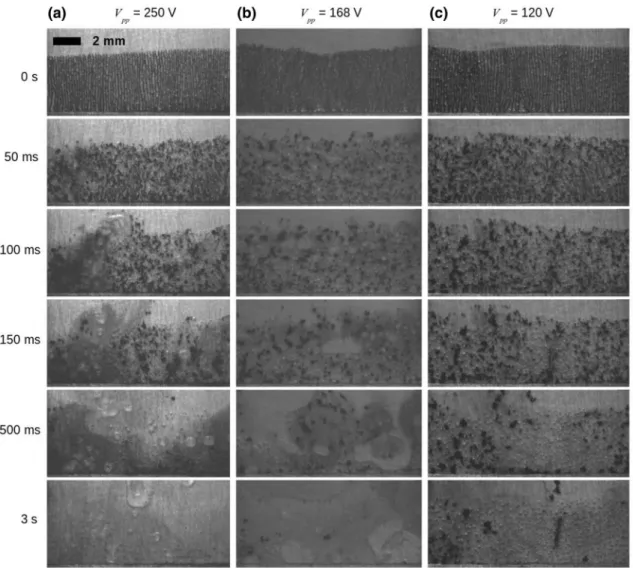
Fig. 6 Image sequences of the fragmentation process for Vpp = 250 V (a), Vpp = 168 V, (b) and Vpp = 120 V (c); f = 4 kHz; acquisition frequency = 1500 FPS, exposure time = 1/1500 s
<∼ 2 μ m. The other particles (needle-like particles and frag-ments) and/or agglomerates of them, even if they are too small to be optically resolved, appear as blur spots with sizes that could fall into the submicrometric range (due to light diffraction) and are then counted in the same size range. Concerning the biggest particles, up to ∼ 10 μ m, detected by the optical morphological analyser, they probably corre-spond to broken parts of primary dendrites as that, partially visualised, which appears to the right in Fig. 9a. Such “big” fragments are rarely encountered in the samples examined by TEM. This is in accordance with the relatively low occur-rence frequency for this size range (Fig. 8). With the present data, it is not possible to estimate relative amounts of broken dendrites compared to needle-like particles. Nevertheless, these analyses provide useful information on the typical sizes of the fragmented particles that will be used below to elucidate the fragmentation mechanism.
To sum up, the fragmentation of the branches is observed only when large bubbles, formed by coalescence, oscillate with surface deformations under the action of the PZT driven with a square signal. This required particular behav-iour is specifically analysed in the following section with the help of theoretical considerations on the bubble oscillation in this geometric configuration.
Fig. 7 Microstreaming pattern obtained with an air bubble located in
the centre of the channel and with a square signal ( Vpp = 14 V, f = 2 kHz); 5 μ m polystyrene particles are used as tracers, superposition of recorded images for 2 s (1500 FPS)
Fig. 8 Size distribution in
num-ber of the produced particles driving the PZT with a square wave, f = 4 kHz and Vpp = 250 V. The inset corresponds to the same plot but with a linear scale for the x-axis; measurement realised from the produced par-ticle dispersion (in water) with an automated morphological optical analyser (Morphologi G3 Malvern × 50), number of counted particles = 28,031
Concerning the fragmentation, the dendrites (constituting the branches) are broken when the branches are brought to the surface of the unstable bubbles by microstreaming. Den-drites are broken at different levels: breakage of the primary dendrites, breakage of secondary dendrites at their roots and fragmentation of tertiary dendrites. In another section, these breakage events are also analysed considering the mechani-cal constraint acting on the dendrites (flow in the vicinity of the surface of the bubbles) and the material resistance (shear strength).
4 On the coalescence of bubbles
when the PZT is driven with a square
signal
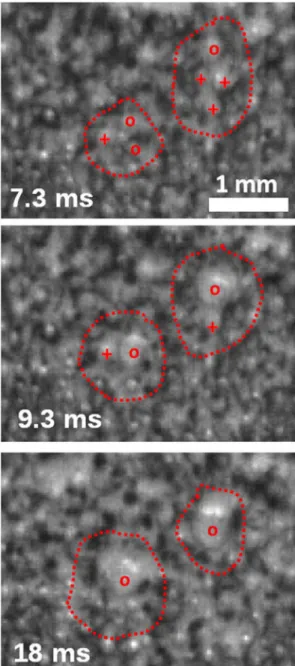
The analysis of the recorded images, just after the activation of the PZT, shows that the first coalescence events are due to sudden motions of some initial bubbles, which rapidly end up in contact with other motionless bubbles, see Fig. 10. The resulting bubbles continue to move across the initial bubble network, coalescing with other bubbles. Such a bubble motion has never been observed when using a sinusoidal or triangular signal. Erratic motions of unconfined bubbles in an acoustic field have been reported when using high acoustic pressure amplitude. This phenomenon is sometimes called “dancing
bubbles” (Eller and Crum 1970). It has been shown that this motion is related to the interactions between different modes of shape oscillation (Eller and Crum 1970; Doinikov 2004). Shape oscillations appear when stabilizing effects (surface tension and viscous stress) can no longer dampen the growth of infinitesimal shape perturbations. This happens when the pressure amplitude exceeds a certain threshold which depends on the liquid and gas properties, the frequency of the acoustic signal f and the rest radius of the bubble R0 (Eller and Crum 1970). The derivation of the corresponding amplitude thresh-old, in terms of bubble oscillation amplitude Ct= 𝛥Rt∕R0 for
each mode n (n corresponding to the number of “peaks” on the bubble surface), by stability analysis, has been performed in several works (Francescutto and Nabergoj 1978; Prosperetti
1984) for spherical and unconfined bubbles submitted to a sinusoidal acoustic signal:
where 𝜔 = 2𝜋f is the applied pulsation and
𝛽n= (n +2)(2n + 1)𝜇∕𝜌R20 the damping parameter of the
shape oscillations of the mode n ( 𝜇 being the dynamic vis-cosity and 𝜌 the density of the liquid). The influence of the bubble size and of the frequency on 𝛥Rt∕R0 can be obtained
(1)
𝛥Rt∕R0= 2
n −1∕4
𝛽n 𝜔,
using the fact that the most easily excitable mode n scales as R1∕3
0 (in the limit of “large” values of n):
with fb the oscillation frequency of the bubbles
(corre-sponding to the applied frequency when a sinusoidal signal is used). Eq. (2) shows that, for a given fb , large bubbles
are less stable than small bubbles. This is attributed to the damping by viscous effect which is more important at small (2)
𝛥Rt∕R0∝ 1
R5∕30 fb
,
scales. For a given R0 , the threshold decreases with fb , as
expected, since the growth rate of shape perturbations is directly related to fb (Prosperetti 1984).
The observed motion of the initial bubbles in the microre-actor could be explained by the same dancing bubble effect. To verify this assumption, it has to be shown that the bubble oscillation amplitude exceeds a certain threshold when using a square wave and not when using a sinusoidal or triangular wave.
Unfortunately, the prediction of Ct for unconfined and
spherical bubbles, Eqs. (1)–(2), cannot be directly applied to the present situation. This is because the bubbles are not spherical, but squeezed and confined in the thin cell. In addition, instead of being exposed directly to an oscillatory pressure field (the cell depth of 50 μ m is well lower than the sound wavelength ≈ 37 cm here), the bubbles are subjected to the oscillation of the cell depth (bending of the surface of the PZT working in radial mode). Therefore, the driv-ing force for the oscillation of the bubbles is the oscillatory cell depth instead of the oscillatory pressure field. This cell depth could be idealized as e(t) = e0+ 𝜖(t) (neglecting side
effects), with e0 the channel depth at rest ( e0 = 50 μm).
However, in spite of these differences, by considering only the parameters related to the bubble oscillation ( R0
and fb ), and not the specific driving force, the dependence
of both R0 and fb on Ct should be the same as for a
spheri-cal bubble (Eq. 2). Indeed, even in this confined case, it is reasonably expected that the viscous damping should also increase when the bubble size decreases (the exponent of R0
in Eq. (2) may be different but still positive), and the shape perturbations should also be less damped when fb increases.
Consequently, for the present confined case, it is considered that the prediction of Ct (Eq. 1) applies in terms of scaling,
Eq. (2).
It could be argued that the presence of the branches can disturb the oscillation of the bubbles which would prevent use of the proposed theory that was established for a sim-ple liquid without particles. Indeed, such an effect is not expected here since the metallic branches are very porous. Indeed, one specific aspect of this kind of electrodeposit (the ramified branches) is that the concentration of metal inside each branch is very low. This is due to the “high” growth velocity (velocity of the anions) that forces the aver-age density of the deposit to be very low and close to twice the electrolyte concentration (0.1 M), see (Léger et al. 2000). As a consequence, the branches should not disturb the oscil-lation of the bubbles.
Concerning the resonance frequency of such confined bubbles, Rabaud et al. (2011) found that fr has an
interme-diate value between the resonance frequency for spherical bubbles fsph
r , given by the Minnaert formula (Rabaud et al. 2011):
Fig. 10 Image sequence showing some coalescence events. Cir-cles and crosses indicate mobile and stagnant bubbles, respectively; square signal, f = 4 kHz and Vpp = 168 V; acquisition frequency = 1500 FPS, exposure time = 1/1500 s
and the resonance frequency for infinitely long cylindrical bubbles oscillating inside a liquid shell fcyl
r , given by the
work of Prosperetti (2004):
where 𝜎 is the polytropic exponent, p0 the static pressure and
L the radius of the liquid shell. The results of Rabaud et al.
(2011) suggest to consider:
Applying this last formula (Eq. 5) to the bubbles of inter-est, for which R0≈57 μ m, using 𝜎 = 1 , 𝜌 = 1000 kg/m3 and
L = 1 cm, corresponding to the length scale of the lateral
dimensions of the cell used ( fcyl
r depends slightly on L due
to the slow increase of the logarithmic term), fr≈33.1 kHz.
Consequently, when a sinusoidal signal at 4 kHz is used, we are far from the resonance, and the pulsation amplitude
𝛥R∕R0 is expected to be very low. Experimental results
sug-gest that even when using the maximum voltage amplitude of 250 V, the bubble pulsation amplitude is not high enough to induce shape deformations, 𝛥R∕R0< 𝛥Rt∕R0.
Concerning the cases where a square signal is used, the oscillation of the initial bubbles, at fr≈33.1 kHz, could
appear (free oscillation) during a plateau after a step, if the rise (and fall) time tr of the steps of the channel depth signal
e(t) is lower than 1/(33.1 kHz) = 30.2 μ s (excitation of the
bubbles at their resonance frequency). Thanks to an electric method described in the Appendix, it has been found that
tr is proportional to Vpp : tr =0.1Vpp (with tr given in μ s and
Vpp in volts).
Therefore, tr is always lower than 30.2 μ s and so the initial
bubbles are actually expected to oscillate at their resonance frequency after a step (a minimum number of 8.3 cycles is expected when 4 kHz is applied). Additionally, shape deformations are more likely to appear since from Eq. (2),
𝛥Rt∕R0∝1∕fb (the dependence on R0 is not considered here since the values of R0 are the same for the two analysed
cases) is expected to be lower than when a sinusoidal sig-nal at 4 kHz is used ( fb = 4 kHz). As a consequence, this
analysis suggests that if the shape deformations (highlighted by coalescence events associated to the motions of the ini-tial bubbles) occur for a given applied frequency using a square waveform, they should also occur for lower applied frequencies. This is indeed observed experimentally, as shown in Fig. 5, where coalescence events (and also the (3) frsph= 1 2𝜋 √ 3𝜎p0 𝜌 1 R0, (4) frcyl= 1 2𝜋 √ 2 log(L∕R0) 𝜎p0 𝜌 1 R0, (5) fr≈ frsph+ frcyl 2 .
fragmentation of the branches) appear for applied frequen-cies that range from 4 and 0.1 kHz and a voltage amplitude of 250 V. For a given applied frequency, it is expected that the pulsation amplitude 𝛥R∕R0 of the free oscillations should
be proportional to the squeeze amplitude 𝛥𝜖 which is itself proportional to the applied voltage amplitude. Consequently, below a threshold value of the applied voltage amplitude, no coalescence events should be observed. Once again, this is observed experimentally, as shown in Fig. 6, where the applied frequency is 4 kHz and the applied voltage varies between 250 and 120 V. The corresponding threshold value of Vpp is between 168 and 120 V.
The shape deformations of the initial bubbles are diffi-cult to observe with both the magnification and the acquisi-tion frequency (1500 FPS ≪ 33.1 kHz) used; the surface of the initial bubbles appears as blurred, which suggests a fast motion of the interface as expected. Shape deforma-tions are more easily observed for slightly larger bubbles, from R0>∼ 200 μ m. It is observed that the amplitude of
the shape deformations increases with the bubble size. Addi-tionally, fragmentation of the bubbles themselves (split/ coalescence events), is even observed for the bigger ones (up to 1 mm in size). These observations suggest that the supercriticality (𝛥R∕R0)∕(𝛥Rt∕R0) −1 increases with R0 . If
the pulsation amplitude 𝛥R∕R0 is considered not dependent
on R0 (it should mainly depend on the voltage amplitude),
𝛥Rt∕R0 should decrease when R0 increases. Such a trend is indeed expected from Eq. (2), from R0>R
f =4 kHz
0 = 511
μ m (where Rf0 corresponds to the bubble size for which the resonance frequency, given by Eq. (5), is equal to the applied frequency f), since in this case fb is fixed and equal to the
applied frequency f.
To sum up, the observed dynamics of the bubbles (coales-cence and shape deformations), when a square signal is used, is explained by the onset of the oscillations of the bubbles at their resonance frequency after a sufficiently stiff step. A large enough voltage amplitude has to be applied to induce the coalescence of the initial bubbles and then all the bub-bles are unstable and exhibit shape deformations. The branch fragmentation is analysed in the following section.
5 Branch fragmentation mechanism
It is observed that the fragmentation of the branches appears only when they are brought close to the surface of large bub-bles formed by coalescence, exhibiting surface deformations (see the sketch in Fig. 11a). On the contrary, when no shape deformations are observed (use of a sinusoidal signal or a square signal without a sufficiently high applied voltage), the branches are only broken by the action of the micros-treaming. The observed requirement of shape deformations to induce fragmentation is specifically analysed here.
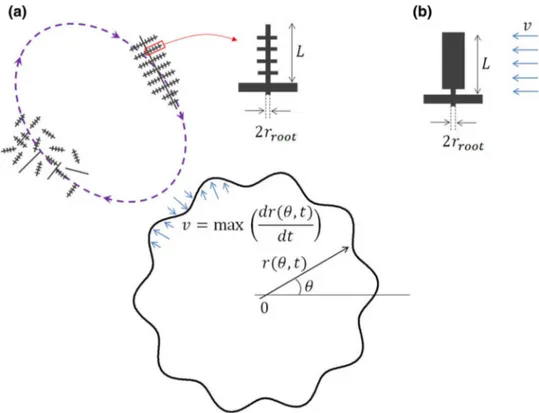
We consider an overall and simplified force balance between the mechanical constraint applied on the dendrites (constituting the branches), in the vicinity of the surface of the bubbles, and the mechanical resistance of the dendrites. We use the same approach as in (Shu et al. 2012), where the mechanical constraint, originated from the surface dis-placement of a cavitation bubble, is assimilated to the vis-cous force acting on the secondary dendrites supposed to be attached to a fixed wall as sketched in Fig. 11b.2
Assimilating the dendrite to a rod of length L connected to the wall by a smaller rod of radius rroot (Fig. 11b), Pilling
and Hellawell (Pilling and Hellawell 1996) show that the stress 𝛴 , generated by an uniform flow of velocity v perpen-dicular to the dendrite, is maximum at the dendrite root and it could be expressed as:
where 𝜇 is the dynamic viscosity of the liquid.
The flow velocity v is assimilated to the maximum veloc-ity of the bubble surface, see Fig. 11a. v has been measured for a given bubble size R0≈300 μ m (typical size of the most
destructive bubbles for f = 4 kHz, Vpp=250 V), using very
high speed visualisations (up to 50 × 103 FPS, to be able
to follow the surface displacement), for several values of the voltage amplitude. This has been done by first realis-ing a typical experiment with f = 4 kHz and Vpp=250 V.
After the fragmentation phase, the solution is left in the cell and selected bubbles (with an equivalent radius ≈ 300 μ m) (6)
𝛴 = 6𝜇vL
2
r3root ,
Fig. 11 a Sketch of the fragmentation of the iron branches by a
bub-ble oscillating with shape deformations (black closed line): the micro-streaming (violet dash line) puts in motion the dendrites (grey), com-posing the branches, which end up bringing them close to the bubble surface where they are broken: the trunk of the primary dendrites is broken and the secondary dendrites are detached from the primary trunk, as sketched (the detachment of the tertiary dendrites from the secondary ones, as observed in Fig. 9d–f, is not sketched). b
Equiva-lent situation considered [inspired by (Shu et al. 2012)] to model a force balance, on the secondary dendrites, when the still unfrag-mented primary dendrites are in the vicinity of the bubble surface: a secondary dendrite is considered as a single rod, of length L and attached to a fixed wall (relative to the bubble surface displacement), subjected to a stationary flow of velocity v and perpendicular to the dendrite axis
2 The use of this approach here implies that, the still unfragmented dendrites, arriving at the surface of the bubbles, are considered as immobile, compared to the vigorous oscillatory flow close to the bub-ble surface. Such a situation occurs, if the unfragmented branch piles (appearing as black blocks) are so heavy that, the time required for the matching between their displacement velocity and the oscillatory flow velocity, is well higher than the characteristic time of the oscil-latory flow (around 1/4000 s). The estimation of this time is possi-ble but difficult, mainly because the mass of a given branch pile is unknown. Indeed, the piles of branches could be more or less com-pressed during their transport by microstreaming, which complicates the estimation of their masses. However, this assumption is made here to enable, as a first approximation, the estimation of the mechanical stress acting on the secondary dendrites.
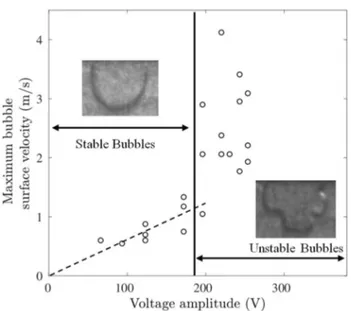
are visualised to measure v varying the applied voltage. In Fig. 12, it is shown that below a threshold voltage ∼ 190 V, the bubbles oscillate without surface deformations and v is proportional to the voltage reaching ≈ 1 m/s when Vpp=190
V. For voltages higher than 190 V, the bubbles oscillate with surface deformations and v increases rapidly with Vpp ,
reach-ing up to 4 m/s.
Using the typical sizes of produced particles, L ∼ 2 μ m and rroot∼ 50 nm for the broken secondary dendrites, L ∼
200 nm and rroot∼ 10 nm for the needle-like particles, and
also the threshold velocity, ≈ 1 m/s, from which shape defor-mations appear, from Eq. (6), a failure stress 𝛴f could be
deduced for both kinds of produced particles (using 𝜇 = 0.001 Pa.s): 𝛴f ∼ 192 MPa for broken dendrites, 𝛴f ∼ 240
MPa for needle-like particles. A trend according to the size cannot be deduced because of the lack of precision of these measurements. Instead we retain a failure stress ∼ 216 MPa deduced from these experiments. This failure stress value has to be compared to the (ultimate) shear strength of mate-rial that the dendrites are composed of; the dendrites are supposed to be made of pure iron.
The shear strength is generally close to ∼ 60 to ∼ 100 % of the (ultimate) tensile strength (Gargari 2005) which is the material property usually reported. From data available in (Lucon et al. 2015), the tensile strength of 99.9999878% pure bulk iron is around 200 MPa. Therefore, the deduced failure stress ∼ 216 MPa is of the same order of magnitude, and slightly higher, than iron shear strength which lies in the range ∼ 120 to ∼ 200 MPa.
This rather good matching allows the major role of bubble shape deformations to be highlighted. Bubble shape defor-mations induce a faster bubble surface displacement, and so a higher mechanical stress which allows the fragmentation of the metallic branches. Furthermore, it has to be noted that these unstable bubbles, in this system, are also able to break nano objects (the needle-like particles). Note that the mechanical constraint originated from the shear rate by the streaming flow, could also contribute to the fragmentation. The resulting stress could be estimated from 𝛴st= 𝜇(vst∕l) ,
where vst corresponds to the scale of the velocity of the
streaming flow and l to the characteristic size of the shear zones. Near the bubble surface, the maximum expected value of 𝛴st is ∼ 80 Pa, using vst=4 m/s and l = 50 μ m
(shear across the cell thickness). This last value is well lower than the required constraint to break the dendrites which shows that the streaming flow is not responsible for the branch fragmentation.
6 Conclusion
To conclude, the proposed electrochemical and vibrating microreactor offers three main advantages compared to the colloidal synthesis in microreactors:
• in situ purification of the produced particles taking advantage of the immobilization of particles in the branches before fragmentation. The purity of the pro-duced solution (mass fraction of the metallic iron) is estimated at ∼ 83 % (Iranzo et al. 2017)
• the device is simple to assemble (clean room facilities are not required) and cost-effective (simple parts, low-frequency PZT and instrumentation)
• the only chemical used is the metal precursor, no reduct-ants (and surfactreduct-ants/polymers) are required
• the shape oscillation of the squeezed bubbles generates sufficiently high mechanical constraint to pull nanometric metal fragments ( ∼ 200 nm × ∼ 20 nm). This observa-tion is very important because it shows that it is possible to act mechanically on nanometric structures with the proposed device and that the proposed principle is valid. The two main drawbacks are:
• a large particle size distribution
• a perfectible selectivity in terms of particle shape (den-dritic and needle-like particles).
These drawbacks are mainly due to a lack of control of the fragmentation process, since the formation of the particles is well controlled during the branch columnar growth. It has been clearly observed that the branches are
Fig. 12 Maximum bubble surface velocity v measured for differ-ent bubbles, having a size R0≈ 300 μ m, as a function of the voltage amplitude of the signal applied to the PZT (f = 4 kHz); these veloci-ties are obtained measuring surface displacements on magnified visu-alisations of the bubbles such as the ones shown as insets and also using a very high acquisition rate (50 × 103 FPS)
fragmented by oscillating bubbles of different sizes which should induce different mechanical constraints on frag-ments of dendrites. This results in produced particles in the form of broken dendrites of different levels and sizes. A better control of the fragmentation process should be obtained using one bubble (or several bubbles of the same size) with a fixed and controlled location. This could be realised by integrating a microfluidic device for a con-trolled generation of bubbles (T-junction, flow focusing...) and also using bubble traps in the cell. This integration is indeed required if, for the targeted metal, the electrochemi-cal formation of the branches is not accompanied with the co-formation of H 2 bubbles.
Concerning the control of the particle shape, this is clearly related to the electrochemical growth. It is expected to reach the same degree of versatility, than for the colloi-dal synthesis, using surfactants/polymers, and/or specific salts (counter ions), to control the growth of the metallic nanocrystals. This work is in progress in our team.
Acknowledgements This study was supported by the MSR Graduate
Research Fellowship and the authors would like to thank the Paul Saba-tier University for funding the research. The authors are very grateful to M. L. de Solan-Bethmale and C. Rey Rouch (Laboratoire de Génie Chimique), S. Le Blond du Plouy and Laurent Weingarten (Centre de microcaractérisation Raimond Castaing) for SEM and TEM observa-tions. We thank the FERMAT Federation for the loan of the high speed camera.
Appendix: Estimation of the rise time
of the depth fluctuations 𝜖(t)
The current I(t) flowing through the PZT is the sum of a capacitive current Ic(t) = c0dV∕dt ( c0 being the
capaci-tance and V the voltage at the PZT terminals) and a cur-rent Ip(t) , relative to the (direct and reverse) piezoelectric
effect Ip(t) ∝dS∕dt , S being the strain of the PZT
mate-rial (Arnau 2008) considered as an average value here. The derivation of the proportionality factor requires the integration of the fundamental piezoelectric relations considering the bending of the PZT disk and the metal-lic support as well as the location of the clamps. Here, we restrict the analysis and simply consider that the PZT surface bending, measured by 𝜖(t) = e(t) − e0 , is
propor-tional to S, Ip(t) is thus ∝ d𝜖∕dt . Consequently, from the
simultaneous measurements of V(t) and I(t) and know-ing (or measurknow-ing) the value of c0 = 20 nF, the form of
the idealized depth fluctuations signal can be determined:
e(t) − e0 ∝∫0t(I(𝜏 ) − Ic(𝜏 ))d𝜏.
For the square signals, these measurements (with a filled cell) have shown that the PZT surface displacement is limited by the PZT response and a rise time tr=0.1Vpp
(with tr given in μ s and Vpp in volts) has been determined
(the rise time of the amplifier = 0.0005 μs/V in open loop).
References
Ahmed D, Mao X, Shi J, Juluri BK, Huang TJ (2009) A millisecond micromixer via single-bubble-based acoustic streaming. Lab Chip 9(18):2738–2741
Arnau A (2008) Piezoelectric transducers and applications. Springer, Berlin Heidelberg
Astruc D, Lu F, Aranzaes JR (2005) Nanoparticles as recyclable catalysts: the frontier between homogeneous and heterogeneous catalysis. Angew Chem Int Edn 44:7852–7872
Bodea S, Vignon L, Ballou R, Molho P (1999) Electrochemi-cal growth of iron arborescences under in-plane mag-netic field: morphology symmetry breaking. Phys Rev Lett 83(13):2612–2615
Boisselier E, Astruc D (2009) Gold nanoparticles in nanomedicine: preparations, imaging, diagnostics, therapies and toxicity. Chem Soc Rev 38:1759–1782
Cheong S, Watt JD, Tilley RD (2010) Shape control of plati-num and palladium nanoparticles for catalysis. Nanoscale 2(2045–2053):2045–2053
Crane RA, Scott TB (2012) Nanoscale zero-valent iron: future pros-pects for an emerging water treatment technology. J Hazard Mater 211–212:112–125
Cuenya BR (2010) Synthesis and catalytic properties of metal nano-particles: Size, shape, support, composition, and oxidation state effects. Thin Solid Films 518:3127–3150
Doinikov AA (2004) Translational motion of a bubble undergoing shape oscillations. J Fluid Mech 501:1–24
Duraiswamy S, Khan SA (2009) Droplet-based microfluidic synthe-sis of anisotropic metal nanocrystals. Small 5(24):2828–2834 Eller AI, Crum LA (1970) Instability of the motion of a pulsating
bubble in a sound field. J Acoust Soc Am 47(3B):762–767 Fedlheim DL, Foss CA (2001) Metal nanoparticles: synthesis,
char-acterization, and applications. CRC Press, London
Fleury V (1997) Branched fractal patterns in non-equilibrium elec-trochemical deposition from oscillatory nucleation and growth. Nature 390(6656):145–148
Francescutto A, Nabergoj R (1978) Pulsation amplitude threshold for surface waves on oscillating bubbles. Acta Acust Unit Acust 41(3)
Gargari MT (2005) Strength design in aluminum: a review of three codes. ASCE Publications
Grujicic D, Pesic B (2005) Iron nucleation mechanisms on vitreous carbon during electrodeposition from sulfate and chloride solu-tions. Electrochim Acta 50(22):4405–4418
Hadjipanayis CG, Bonder MJ, Balakrishnan S, Wang X, Mao H, Hadjipanayis GC (2008) Metallic iron nanoparticles for MRI contrast enhancement and local hyperthermia. Small 4(11):1925–1929. https ://doi.org/10.1002/smll.20080 0261
Iranzo A, Chauvet F, Tzedakis T (2015) Influence of electrode mate-rial and roughness on iron electrodeposits dispersion by ultra-sonification. Electrochim Acta 184:436–451
Iranzo A, Chauvet F, Tzedakis T (2017) Synthesis of submicromet-ric dendritic iron particles in an electrochemical and vibrating Hele–Shaw cell: study of the growth of ramified branches. Elec-trochim Acta 250:348–358
Kelly KL, Coronado E, Zhao LL, Schatz GC (2003) The optical properties of metal nanoparticles: the influence of size, shape, and dielectric environment. J Phys Chem B 107:668–677
Léger C, Elezgaray J, Argoul F (2000) Internal structure of dense electrodeposits. Phys Rev E 61(5):5452–5463
Liu RH, Yang J, Pindera MZ, Athavale M, Grodzinski P (2002) Bubble-induced acoustic micromixing. Lab Chip 2(3):151–157 Lucon E, Abiko K, Lambrecht M, Rehmer B (2015) Technical Note
(NIST TN)-1879. NIST Pubs
Ma J, Lee SM, Yi C, Li C (2017) Controllable synthesis of functional nanoparticles by microfluidic platforms for biomedical applica-tions—a review. Lab Chip 17:209–226
Marre S, Jensen KF (2010) Synthesis of micro and nanostructures in microfluidic systems. Chem Soc Rev 39:1183–1202
Murphy CJ, Gole AM, Hunyadi SE, Stone JW, Sisco PN, Alkilany A, Kinard BE, Hankins P (2007) Chemical sensing and imaging with metallic nanorods. Chem Commun 5:544–557. https ://doi. org/10.1039/b7110 69c
Pilling J, Hellawell A (1996) Mechanical deformation of dendrites by fluid flow. Metall Mater Trans A 27(1):229–232
Prosperetti A (1984) Bubble phenomena in sould fields: part two. Ultrasonics 22(3):115–124
Prosperetti A (2004) Bubbles. Phys Fluids 16(6):1852–1865
Rabaud D, Thibault P, Raven JP, Hugon O, Lacot E, Marmottant P (2011) Manipulation of confined bubbles in a thin microchan-nel: drag and acoustic Bjerknes forces. Phys Fluids. https ://doi. org/10.1063/1.35792 63
Rallabandi B, Wang C, Hilgenfeldt S (2014) Two-dimensional stream-ing flows driven by sessile semicylindrical microbubbles. J Fluid Mech 739:57–71
Shu D, Sun B, Mi J, Grant PS (2012) A high-speed imaging and modeling study of dendrite fragmentation caused by ultra-sonic cavitation. Metall Mater Trans A Phys Metall Mater Sci 43(10):3755–3766
Song Y, Hormes J, Kumar CSSR (2008) Microfluidic synthesis of nanomaterials. Small 4(6):698–711
Sweeney SF, Woehrle GH, Hutchison JE (2006) Rapid purification and size separation of gold nanoparticles via diafiltration. J Am Chem Soc 128(10):3190–3197
Tho P, Manasseh R, Ooi A (2007) Cavitation microstreaming patterns in single and multiple bubble systems. J Fluid Mech 576:191–233.
https ://doi.org/10.1017/S0022 11200 60043 93
Wagner J, Tshikhudo TR, Köhler JM (2008) Microfluidic generation of metal nanoparticles by borohydride reduction. Chem Eng J 135:S104–S109
Wang C, Zhang W (1997) Synthesizing nanoscale iron particles for rapid and complete dechlorination of TCE and PCBs. Environ Sci Technol 31(7):2154–2156
Wang SS, Jiao ZJ, Huang XY, Yang C, Nguyen NT (2009) Acoustically induced bubbles in a microfluidic channel for mixing enhance-ment. Microfluid Nanofluid 6(6):847–852
Wang T, Jin X, Chen Z, Megharaj M, Naidu R (2014) Green synthesis of Fe nanoparticles using eucalyptus leaf extracts for treatment of eutrophic wastewater. Sci Total Environ 466:210–213
Yang S, Cheng F, Yeh C, Lee G (2010) Size-controlled synthesis of gold nanoparticles using a micro-mixing system. Microfluid Nanofluid 8(3):303–311
Zhang W (2003) Nanoscale iron particles for environmental remedia-tion: an overview. J Nanopart Res 5:323–332
Zhang Y, Jiang W, Wang L (2010) Microfluidic synthesis of copper nanofluids. Microfluid Nanofluid 9(4):727–735
Publisher’s Note Springer Nature remains neutral with regard to