Gilles Vandewalle
Diplôme d’Etudes Appliquées en Sciences Faculté des Sciences
Université de Liège Belgium
Separation of the retinal and central
contribution to changes in visual
performance after light exposure
Master thesis supervised by Dr. Pierre Maquet
(Centre de Recherche du Cyclotron, Université de Liège, Belgium) In collaboration with Dr. Derk-Jan Dijk
(Surrey Sleep Research Center, University of Surrey, United Kingdom)
ACKNOWLEDGEMENTS
First, I would like to emphasize how much this time pasted in Guildford has taught me. The list of things I learn is endless!! I would like to thank all the people that made my stay so profitable.
I am very grateful to Mrs. Simoen and the F.N.R.S. for founding my stay in England and to the University of Surrey for hosting me.
I would also to like to thank Pierre for giving the opportunity to work in his lab next year and for sending me to Guildford. Thank you for the help you gave me on the phone as well! Et merci à Fabien aussi!
I am also thankful to the members of the Endocrinology Group of the University of Surrey for the time we shared together.
A whole bunch of thanks to the staff of the HPRU for the help they gave me, especially Neil for the logistic help and Stephen, who taught all I know about how to actually do an EEG and for all the little things you did for me (I really appreciated!). Thank for your time and patience!
A lot of thanks to Mark as well for moving all the way from London to help us out to design our protocol and to sort out the data.
Many thanks to Sarah and Karen for their help and for being so cheerful all the time or for being my ERG test volunteer!
Big big thanks to Benita for answering my never ending list of questions and most of all for being such a nice volunteer for my pilot studies! We didn’t stay up all night for nothing in the end!!
And finally, and most importantly, vele bedanken to Derk-Jan (I actually do remember a bit of Dutch!). Bedankt for accepting to host me in your group on such a short notice, bedankt for giving the opportunity to meet so many people, to learn so many things and to do an experiment on my own. Thank you so much for you time and your great expertise! I am very very grateful to you.
TABLE OF CONTENT
ABREVIATIONS ... 4
INTRODUCTION ... 5
Circadian period and phase response curves (PRC) to light ... 6
Effect of light on melatonin levels ... 7
Nonphotic entrainment of the circadian clock ... 8
Effect of light on vigilance, alertness and performance ... 9
Effect of light on the eye ... 10
Visual Evoked Potentials (VEPs) ... 13
The P300 wave ... 15
Effect of gender and oral contraception on physiological and neurobehavioral measures ... 17
Effects of alcohol, smoking, caffeine on physiological and neurobehavioral measures ... 17 MAIN OBJECTIVES ... 18 MAIN HYPOTHESES ... 18 SECONDARY OBJECTIVES ... 18 METHODS ... 19 Participants ... 19
Critical flicker fusion (CFF) test ... 20
Electroretinogram (ERG) and Visual evoked potentials (VEPs) ... 20
Karolinska Sleepiness Scale (KSS) ... 22
Karolinska Drowsiness Test (KDT) ... 22
Reaction time ... 22
Measurements not realized during the pilot studies ... 22
The P300 wave ... 22
Melatonin level assessment ... 24
Actigraphy and sleep Diary ... 24
Protocol of the experiment ... 25
RESULTS OF THE PILOT STUDIES ... 27
KSS ... 28 CFF Test ... 28 Reaction Time ... 30 ERG ... 31 VEP ... 32 KDT ... 32 DISCUSSION ... 32 REFERENCES ... 35
APPENDIX 1: THE INTERNATIONAL 10/20 ELECTRODE PLACEMENT SYSTEM ... 40
APPENDIX 2: KAROLINSKA SLEEPINESS SCALE (KSS) ... 42
APPENDIX 3: PITTSBURG SLEEP QUALITY INDEX (PSQI) QUESTIONNAIRE .. 43
APPENDIX 4: SLEEP DIARY ... 46
APPENDIX 5: MEDICAL QUESTIONNAIRE ... 47
APPENDIX 6: EPWORTH SLEEPINESS SCALE (ESS) ... 50
APPENDIX 7: CLOSE VISION TEST (READING TEST) ... 51
ABREVIATIONS
CBT: core body temperature cd: candelaCFF test: critical flicker fusion test CNS: central nervous system
DD: dark-dark cycle, or total darkness conditions EEG: electroencephalography EOG: electro-oculogram EKG: electrocardiogram ERG: electroretinogram Hz: Hertz J: Joules
KDT: Karolinska drowsiness test
kΩ: kilo Ohms
KSS: Karolinska sleepiness scale LD: light-dark cycle
LEDs: light emitting diodes µs: microseconds
mg: milligrams min: minutes ms: milliseconds
NIF response: non-image forming response ODS: outer segment shedding
PRC: phase-response curve RGC: retinal ganglion cells RHT: retinohypothalamic tract RT: reaction time
SCN: suprachiasmatic nucleus VEP: visual evoked potential
INTRODUCTION
Light carries information that is used by the cortex to generate images of the environment. In addition, the mammalian central nervous system (CNS), through the eye, is capable of detecting changes in irradiance resulting in non-image forming light (NIF) responses. These irradiance-dependent responses include several physiological aspects: synchronization of the circadian clock (1), suppression of pineal melatonin production (2, 3), elevation of core body temperature (CBT) (4, 5), regulation of cortisol levels (6). The rhythms of latter three variables are controlled by the same pacemaker (7). Light exposure also leads to pupil constriction (8), increase of heart rate (9, 10), reduced slow eye movements and electroencephalography (EEG) power density as well an enhancement of alertness (11, 12), changes in vigilance (13), shifts of the sleep propensity rhythm (14) and increase in sleep latency (5, 11, 12). In addition light induces direct effects at the molecular level (15).
The neural pathways mediating some NIF responses are anatomically distinct from the classical visual pathway (16). Although the photoreceptive system mediating entrainment to the light dark cycle was shown to be markedly different from that involved in the visual image formation 20 years ago (17), the pathways from photoreception to specific effects are not fully understood yet. However, several targets have been identified involving complex neural pathways. In rodents, radiance changes are transmitted from a discrete subset of photosensitive retinal ganglion cells (RGC) (18) via the retinohypothalamic tract (RHT) to 1) the hypothalamic suprachiasmatic nuclei (SCN) (19, 20, 21), the site of the mammalian circadian pacemaker (22) that also influences melatonin secretion (16), and connects and regulates many other systems (23, 24); the olivary pretectal nuclei (OPN) (20) involved in pupilloconstriction (8, 25, 26), 3); the ventro lateral geniculate complex (VLG) (20), thought to be implicated in the circadian response to light although not as an essential component (27) or 4) and the ventrolateral preoptic nucleus (VLPO) (28), a region of the brain that appears to be involved in the sleep-wake regulation. The RHT also connects to other hypothalamic and non-hypothalamic regions of the brain (20, 27).
Hence, it seems that the photopic system is not likely to be the primary input for all these responses (29, 30, 31), but NIF responses appear to be at least partly mediated by a non-classical photopigment (or several). Indeed, bright light can entrain and change circadian rhythms in some blind people in absence of conscious vision (32, 33) and melatonin is equally suppressed in people with different types of color deficiencies (34). Moreover action
spectra performed for different effects of radiance changes are all peaking around the same wavelength (479 nm for pupillary constriction in mice (35) and 459 nm (16) or 464 (29) for melatonin regulation in human) and fail to match any of the known photopigments (24). Rods and cones appear to have input on the SCN (36, 37) and could still be involved in the regulation of some of these NIF responses (8, 38).
In addition, it seems that there is a non-homogenous distribution of the circadian photoreceptors. Even if it is still debated, a recent paper (39) reported that the lower retina was far more efficient in suppressing central melatonin synthesis than the upper part, which did not appear to have much effect.
It should be stressed that the thresholds for inducing most of the NIF responses (e.g. phase adjustment of the circadian clock or phase shift) are significantly higher than those required to elicit a visual response; the circadian system, being an irradiance detection system, also appears markedly insensitive to light stimuli of short duration (1, 2, 40).
Circadian period and phase response curves (PRC) to light
The period of the human circadian pacemaker was first thought to be close to 25 hours and social cues were considered to be its main synchronizer rather than light (41). However those observations were based on studies in humans exposed to light level sufficient to confound circadian period estimation and the role of light (42) and it then became clear that light was also the main synchronizer in human as in all other species. Bright light was shown to be able to phase shift circadian rhythm (type 1 phase shift) (43) and sometime to strongly shift them as well as affecting the amplitude of the rhythm if a very bright pulse was received around CBT nadir (type 0 phase shift) (6, 44, 45). The timing of periodic behavioral stimuli, such as sleep, sedentary activity, social contact and food intake have now been shown to be relatively weak circadian synchronizers (46).
Precise estimation of period of endogenous circadian rhythms of several physiological factors (melatonin, cortisol, CBT) in carefully light controlled conditions revealed that the intrinsic period of the human circadian pacemaker averages 24.18 hours, with a tight distribution consistent with other species (42, 47).
The effect of light depends on the circadian phase at which it is administered. The relationship between circadian time of light stimulation and the consequent change in rhythm phase can be expressed as a phase-response curve (PRC) (e.g. 48).
It is generally thought that phase delays occur during early and mid subjective night before CBT nadir, and phase advances occur during late subjective night and early subjective morning around CBT minimum and after (6, 49). In many species, a single bright light exposure at mid or late subjective day in free-run conditions did not affect circadian rhythms and mid and late subjective day are thought to constitute dead zone where light has no phase shift effect. However, in diurnal rodents, PRCs did not seem to have dead zones (49). Moreover, a midday 5 hour exposure to very bright light (10000 lux) for 3 consecutive days phase shifted temperature rhythms and, thus showed that humans are sensitive to light throughout the subjective day with the phase advance portion spreading until 11.9 hours after temperature minimum and the phase delay portion starting right after with no dead zone in between (49). Similar conclusions were made concerning plasma melatonin level (50). Nevertheless, the phase shift induced by light is much greater during early and mid subjective night (phase delay effect) and during late subjective night and early subjective day (phase advance effect) (49).
Light intensities much lower than what was previously thought are able to entrain or phase shift circadian rhythms. Indeed, nocturnal exposure to a single 6.5 hours light pulse of approximately 100 lux generated half the maximum circadian phase delay resetting response that was observed at the same phase with a light of two orders of magnitude greater intensity (1). Candle light level (~1,5 lux) was also shown to be able to entrain the circadian system if the period of the light dark cycle was close to 24 hours in very controlled conditions (47).
Effect of light on melatonin levels
Many studies showed the suppression of melatonin level by light (e.g. 2, 3, 7, 50). The effect of light upon melatonin secretion is an acute effect since melatonin levels during secretion period decreases 10 to 20 minutes after bright light exposure and, within an hour, the daytime level are reached (3).
Bright light produced significantly stronger melatonin suppression when two whole retinas were exposed compared to a single retina exposure. These results demonstrate an additive effect of the two retinal inputs to the SCN for melatonin control (2) and maybe for all the systems influenced by the SCN.
Nonphotic entrainment of the circadian clock
Physical exercise is known to have an acute phase shifting effect on circadian rhythms although the mechanism involved is still unclear (51). In humans, activity early in the night in constant routine conditions is associated with phase delays of circadian rhythms of CBT, plasma cortisol, melatonin and thyrotropin (51). Intensity, duration and time of the exercise are to be considered since a 1-hour bout of intense exercise and a 3-hour bout of low-intensity exercise (centered at clock time 01:00) are equally effective in phase-delaying the melatonin/thyrotropin profiles (52). Late evening exercise during the rising phase of melatonin secretion may acutely blunt melatonin levels. High-intensity exercise during the night time period consistently results in a further (nearly 50%) elevation in melatonin levels. No effect of low-intensity exercise performed during the same circadian phase was detected. Finally, irrespective of intensity, exercise near the offset of melatonin secretion or during the daytime has no consistent acute effect on melatonin secretion.
In some blind people without light input to the circadian clock, small putative nonphotic synchronizers (such as the rest activity cycle) become the dominant synchronizers and therefore the phase relationship between the rest-activity cycle and the endogenous circadian rhythms of melatonin and CBT is primarily determined by the PRC to nonphotic stimuli (53). Other blind people seem to always free-run and thus are not affected neither by light nor nonphotic cues.
It was also suggested that bright light applied behind the knees could have an effect of the circadian clock in human (54), but despite all the interest it elicited it has been impossible to reproduce those results (24, 55, 56). Beside that surprising suggestion, no other extraocular photoreception has ever been reported in adult mammals. Even in blind people photoentrainment, if present, is mediated through the eyes (32, 33, 57).
Although photic stimuli remain far stronger influences on the circadian pacemaker in that they are capable of inducing phase shifts of up to 12 hours in 3 days, nonphotic stimuli elicit more modest but still significant responses from the pacemaker (53).
Effect of light on vigilance, alertness and performance
Light exposure affects vigilance (13), which is defined as the ability to respond to stimuli over a long period of time. Vigilance displays a circadian rhythm in parallel to the temperature cycle with low values at the temperature minimum (around 06:00) and high values at the temperature maximum (58, 59). Bright light at night rapidly increases the vigilance level (13), but the effects of light also appear at low light levels since night time exposure to typical room light (90-180 lux) can exert an alerting effect (23) and affect melatonin and cortisol rhythms (60) in humans. (for more information about how light levels are measured see 61)
Sleepiness, assessed by the latency to sleep onset, has been shown to be considerably greater under continuous dim light conditions compared with bright light conditions. Objective alertness (EEG beta activity) showed the opposite pattern, with high levels of alertness in bright light and low levels in dim light . The difference between the two light conditions was greatly marked in the latter part of the night (13). Subjective alertness, assessed by the Karolinska Sleepiness Scale (KSS) was maintained at a high level for most of the night with light level as low as 100 lux (11). Alternating 90 minute periods of bright light (5000 to 10000 lux) with 90 minute periods of dim light (50 lux) throughout the night generally induced within 30 minutes an increase in CBT (or maintained level) and a decrease in CBT, respectively (13). During continuous bright light condition, body temperature dropped only slightly across the night whereas it dropped sharply under dim light conditions. Hence, bright light at night has an acute effect upon body temperature level whereas during the day no effect was observed (13).
Badia et al. also showed that performance is affected by light (13). Performance is known to have a circadian rhythm similar to the vigilance rhythm with higher values at the end of the day and lower values at the end of the night (59, 62). In alternating conditions of 90 minutes of bright light (5000 to 10000 lux) followed by 90 minutes of dim light (50 lux) (13), performance (for digit recall, two letter search, serial additions and/or subtraction) was generally better under bright light than under dim light conditions. Performance exhibited a time-of-night deterioration in both conditions, indicating that the circadian decrements in performance can still be observed under bright light condition. Night time continuous bright light exposure was also able to maintain higher performance levels whereas daytime continuous or alternating condition failed to show any differences.
Although endogenous circadian performance rhythms are thought to be controlled by the same pacemaker that drives the endogenous circadian rhythm of body temperature (62), the mechanisms underlying these changes in vigilance, alertness and performance have not been fully elucidated (11). Hence, effects within the CNS as well as at the level of the retina need to be considered, since any effect of light has first to be mediated through the eye. This is especially true for performance tasks that have a visual component. Thus, it would be of great interest to know how light locally acts on the retina and to what extent it contributes to the light effect on (visual) performance.
Effect of light on the eye
It is well known that the mammalian visual system undergoes a complex diurnal transition between processes optimized for high (photopic) and low (scotopic) light levels (intermediate light level = mesopic). Several features of this transition can be pointed out. First, there is a nocturnal reduction in the threshold for rod-driven responses (63) and the ability to detect dim light increases systematically at night (64, 65). Chromatic sensitivity also varies (66) but only for short and long wave lengths in monocular detection since monocular green and white light and binocular detection threshold did not show any detectable rhythm. This led the authors to hypothesize that binocular thresholds produced summation based on central mechanism, which could mask retinal rhythmicity. Finally, the speed with which signals originating in cone photoreceptors are processed in DD decreases at night (67) (see below). The primary transition between scotopic and photopic vision is a direct response to environmental irradiance, however, many events associated with this transition are long-term adaptation (67).
Indeed, numerous in vitro (68, 69) and in vivo animal studies (Limulus (70), rats (27, 71, 72), Japanese quail (73)), as well as studies at the cellular level (74), have shown that the anatomical and physiological properties of retinal rod and cone pathways can be regulated according to the phase of the diurnal cycle. Many of these changes are maintained in constant darkness supporting the idea of the implication of retinal oscillator(s) autonomous from the SCN for some aspects of the regulation of retinal physiology (27, 75).
In humans, the electroretinogram (ERG) has been used to observe some retinal adaptations. The ERG is a field potential representing the sum of electrical responses of the
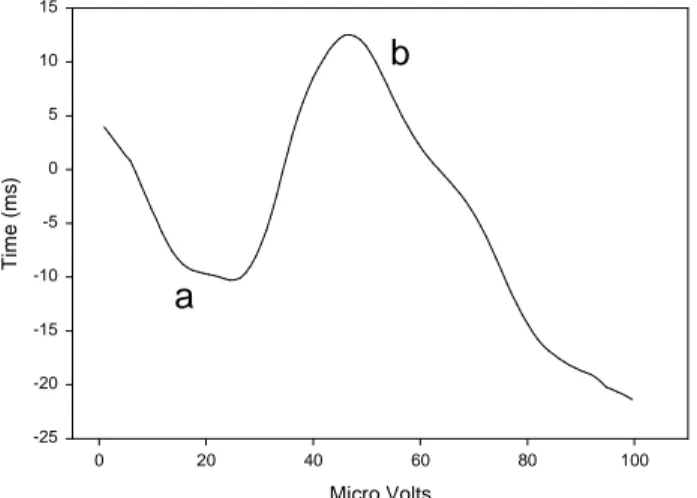
components (75) (fig. 1). Under stimuli of sufficient intensity, ERG reflects the activity of both rod and cone photoreceptors. However, using a background irradiance of light sufficient to saturate the rod photoreceptors, it is possible to examine the cone pathway in isolation (67). Responses to light flashes yield simple ERG waveforms comprising of the initial negative a-wave followed by the positive b- (light-ON) and d-waves (light-OFF), the latter being only visible when using prolonged-flash stimuli. Except near photopic threshold, where postreceptoral contribution must be taken into account (76), the initial a-wave response reflects the activity of retinal photoreceptors (75). The event leading to the b-wave begins with the increase of potassium concentration into the extracellular space, involving depolarizing (ON) and maybe hyperpolarizing (OFF) bipolar neurons (77). This locally depolarizes Müller cells, the glial cells of the retina, and thereby creates a transretinal b-wave potential. Thus, the a-wave of the ERG can be attributed to photoreceptoral activity, whilst the b- and d-waves provide a measure of post-photoreceptoral activity in the second-order retinal neural network, although its precise origin remains somewhat uncertain (75, 78).
Micro Volts 0 20 40 60 80 100 T im e ( m s ) -25 -20 -15 -10 -5 0 5 10 15
Figure 1: Typical averaged ERG waveform recorded from the observer in the pilot studies. Presentation of the
light stimulus occurred at time = 0 ms. After the light flash, the ERG comprises of an initial a-wave (a) followed b-wave (b)
Light and dark adaptation have both been shown to influence amplitude and, to a lesser extent, latency of ERG cone responses (79). During continued light adaptation, cone ERG response amplitudes increase gradually, requiring 10 or more minutes to achieve a stable level. During dark adaptation there is a initial increase in cone ERG amplitude followed by a subsequent decrease to the dark-adapted baseline. A decrease in cone ERG implicit time is also observed during light adaptation, but the magnitude of this decrease is not dependent upon stimulus luminance.
a
Hankins et al. (75) reported that there was little or no temporal variation in the human cone light response because both the amplitude and implicit time of the a-wave component remained constant throughout the 24-h cycle. On the other hand, the temporal properties of both b- and d-wave components varied systematically throughout the normal light cycle in opposition to the variation in ambient light level, with the implicit time being some 20% greater at midnight than in the middle of the day. This temporal variation could be abolished by constant light, but persisted in constant darkness.
The most likely explanation for the ERG kinetic variations is that changes occur somewhere presynaptic to the entire second-order pathway (75). Although its function is still uncertain, one potential benefit of delaying the response of the cone pathway might be that under mesopic conditions, with mixed rod-cone contributions, the visual system is to match the rod and cone temporal responses (78).
The delay of the response of the cone pathway can be affected by light exposure. Thus a night time light pulse has been reported to shift the ERG kinetic value to a daytime equivalent (67). Once again the action spectrum of the light required to drive this change failed to match the classical human photopigment and was reported to have a λmax ~ 483nm, which is similar to the result obtained for melatonin suppression in humans and pupillary constriction in rats (16, 29, 35).
Moreover, not only does light affect b-wave latency, but it does so locally. Indeed, single eye night time exposure to a light pulse showed that the ipsilateral b-wave changes are much greater than the contralateral changes (67). One possible explanation advanced to explain this result would be that the novel photoreceptor acts upon melatonin and dopamine levels in the retina, and that their concentrations would represent contraregulatory signals of night and day. The slight contralateral response observed might be due to the plasma decrease in concentration in melatonin caused by exposure to light.
Whatever the mechanism involved, these observations indicate that a local retinal network is primarily responsible for driving long-term adaptations in the cone pathway (67). Thus, it should be possible to speed up processing of visual information in one eye by exposing this eye to light. This implies that visual performance assessed through this eye should be most affected. Nevertheless the respective roles of the CNS and the retina in regulating rhythmic retinal physiology and visual performance remain unclear (e.g. 64, 80).
Since light has an effect on the CNS independent from the eye, one can measure the central effect of light, by assessing visual performance in the non-exposed eye of a volunteer receiving light in the other eye. In other words, if you expose only one eye to a light pulse, visual performance assessed with the exposed eye will be the result of the local and central effect of light and visual performance assessed with the unexposed eye of the same participant will be the result of the central effect of light alone.
The critical flicker fusion (CFF) test (58, 81) is one of the methods widely used to assess overall CNS activity. The CFF test determines the temporal threshold below which a high frequency light stimulus is perceived as steady. The mean CFF threshold frequency has been shown to fluctuate according to circadian time with lower values at night (82), but it is not known how or if the b-wave ERG changes affect visual performance and thus CFF thresholds. This could bias the evaluation of CNS activity and may be the explanation for why CFF has often failed to detect existing vigilance impairment (58). Moreover, to our knowledge, the effect of light exposure upon CFF value at night has not been systematically evaluated.
Visual Evoked Potentials (VEPs)
Visual evoked potential are electrophysiological signal that are recorded at the scalp over the occipital area, using standard EEG techniques. The obtained response depends on the technique used to elicit VEPs. There are three standard transient responses depending on the method used to elicit them, all three having their own characteristics; the flash VEP, the pattern reversal VEP and the pattern onset/offset VEP (83). Flash VEPs are elicited similarly to the ERG. The pattern reversal stimulus consists of black and white checks or black and white gratings which abruptly alternate. For the pattern onset/offset, a pattern is abruptly exchanged with an equiluminant diffused background. Although we recorded flash VEPs in this study, some mention will be done of previous results obtained with the other two standards. Although we recorded flash VEPs in this study, some mention will be done of previous results obtained with the other two standards.
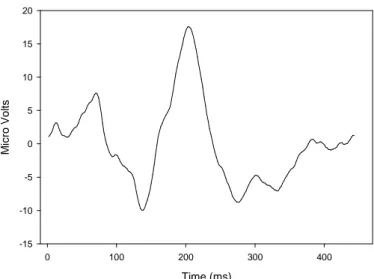
The flash VEP consists of a complex series of negative and positive waves beginning around 30msec and terminating around 300msec (83). In flash VEPs evoked by a diffused stimulus, the most common components are N2 and P2 components around 90 and 120msec, respectively (fig. 2).
Time (ms) 0 100 200 300 400 M ic ro V o lt s -15 -10 -5 0 5 10 15 20
Figure 2: Typical averaged flash VEP waveform recorded from the observer in the pilot studies. Presentation of
the light stimulus occurred at time = 0 ms. After the light flash, the flash VEP comprises of a series of negative and positive waves.
Circadian variations in VEP latencies and amplitudes have been reported using pattern reversal VEPs (84, 85). Latencies of different components of pattern reversal VEPs have been shown to be substantially longer during the night than during the day. The amplitudes of these VEP components increased in the evening between 18:00 and 23:00 and subsequently diminished in the course of the night. However, circadian variations of amplitudes were less prominent than those in latencies. This could reflect an increased sensitivity of the visual system in humans during the period of high visual acuity. In a study looking at multiple sclerosis patients (86), pattern reversal VEPs amplitudes of some components were reported to have diurnal variation with an increase between 08:00 and 15:00 in both patients and control volunteers, although these two times were the only ones to be looked at. Amplitudes of flash VEPs were also greater during the day and latency during the night in the domestic pigeon (87).
Hence, the amplitude and latency of some components of the VEP seem to show a circadian variation, but to our knowledge, the effect of light on their characteristic has not been investigated. Moreover, no correlation has been made so far between variation in the ERG and variation in the VEP. It would thus be of great interest to see if the decrease in ERG b-wave latency reported after a light pulse can be correlated to changes in the flash VEP. This would show how a change in the speed of information processing of the visual
information at the level the retina can induce changes in the processing of the same visual information at the occipital area level.
The P300 wave
The P300 wave is an endogenous evoked potential (88, 89). Contrary to exogenous evoked potential, they can be generated without any external stimulation. The P300 wave is a positive wave occurring when an expected but unpredictable stimulus is detected. It is mainly composed of two parts, the P3a wave occurring after 220 to 280 ms, mainly in the fronto-central areas, and the P3b wave occurring after 310 to 380 ms, in the centro-parietal areas. The P3a appears every time a stimulus is surprising a volunteer even if he is not concentrating his attention on it. When the volunteer focus his attention on that stimulus and has to discriminate it, the P3a wave is followed by a P3b wave. When speaking about P300, we mean P3b.
The protocol mostly used to elicit P300 waves is the “oddball paradigm”, in which two stimuli differing by a physical factor appear with contrasted probabilities (88). For example, in an auditory protocol, a low pitch sound is presented with a high probability while a high pitch sound is presented with a low probability.
Two parameters to take into consideration when looking at the P300 are its amplitude and its latency (88, 89, 90). The amplitude is related to the improbability of the stimulus, the motivation and vigilance degree of the volunteer and certain aspects of the selective attention. There is an inverse relationship between the amplitude and the probability of the stimulus and the amplitude undergoes a habituation process after the 15th rare stimulation especially in auditory tasks. Amplitude increases with the degree of attention given to the stimulus, and the complexity of the stimulus or the task up to a certain degree of complexity though. It is greater if the volunteers are asked to press a button rather than simply counting them. The amplitude is generally viewed as a measure of CNS activity and to be related to the amount of cognitive resources available for the evaluation of the stimuli (91, 92).
The latency of the P300 varies according to the difficulty of the task and seems to reflect the time necessary to evaluate the characteristics of the stimulus (88, 89, 90). It does not seem to represent any decision process because the reaction time (RT) occurs about 50 ms before the peak of the P300 (showed in an oddball paradigm). When accuracy was
emphasized, the reaction time tended to follow the peak latency, but when speed was emphasized, the reaction time could occur well before, and many of the early responses were incorrect. The P300 latency was correlated positively with subjectively rated sleepiness and negatively correlated with subjectively rated attention level and was found to increase after sleep deprivation (92, 93, 94). Hence, latency seems to be related to the arousal level.
In an Oddball paradigm, the scalp distribution of the P300 was widespread with maximum amplitude over the midparietal region, but it varies from experiment to experiment and no precise source has been identified (89). The P300 wave probably reflects the activity of multiple regions of the brain.
Diurnal variations have been shown in both P300 latency and amplitude when measured in the Pz location (92). (for more information about electrode placement see appendix 2). The latency was significantly longer at 08:00 than at 11:00, 17:00 and 20:00. The amplitude at 17:00 was significantly smaller than at 08:00 and 14:00, and the P300 amplitude at 20:00 was significantly smaller than at 08:00. P300 amplitude was also shown to decrease during extended wakefulness with greater value at the beginning of the night compared to the end of the night (93, 94). These variations seemed to correlate with diurnal variations in performance in discriminative tasks.
Variation in amplitude and latency during extended wakefulness are similar to changes that occur in the P300 in case of cognitive impairment (e.g. Alzheimer’s disease and alcohol exposure), and appeared to be fatigue related rather than circadian related (94).
Thus, even though they might no be circadian dependent, variations in amplitude and latency of the P300 throughout the night have been reported; however, to our knowledge the effect of a light on these parameters has not been investigated yet.
Few studies looked at reaction time in an oddball paradigm. When people were asked to press a button a soon as they heard the target high pitch stimulus, no significant variation in reaction time was found between 08:00 and 20:00 (92) and over the course of the night (201). There was no correlation with fatigue and CBT in the latter experiment. The effect of light on RT has not been investigated as well to our knowledge.
Effect of gender and oral contraception on physiological and
neurobehavioral measures
Wright and Badia (95) looked at several aspects of the effect of gender on circadian rhythms. In general, their conclusion is that the circadian rhythm data obtained in women were similar to those obtained in men under similar protocol and CBT levels in the follicular phase (day 1 to 10 of the menstrual cycle) was the most similar to those found in men (95). Melatonin levels for men and women were also similar. The relation of endogenous circadian phase to changes in alertness and performance was also similar for women and men in all measures were poorest near the melatonin peak and the temperature trough. Oral contraceptive use was not reported to affect subjective alertness or reaction time and vigilance performance.
Another study looked at four performance tasks during the menstrual cycle (96) and reported no decrement over the cycle. This was in agreement with a previous review of 35 independent studies, using 81 performance tests (for reference see 96).
Female visual sensitivity was found to differ from that of male (temperature and visual sensitivity changes were smaller for females) under constant darkness but not in light-dark conditions (65), but many of the studies concerned with visual variables during the menstrual cycle had inconclusive results lacking reproducibility with very small group of volunteers (97).
Effects of alcohol, smoking, caffeine on physiological and
neurobehavioral measures
Smoking has been shown to lead to both increments and decrements in overnight performance depending on when the test was performed compared to the time when the cigarette is smoked or when carving occurs (82).
Caffeine was also shown to increase alertness and performance and to influence EEG power density and CBT (98) and to affect CFF threshold value and vigilance state for at least 24 hours (99). However, caffeine impairment in performance could be the result of the failure to control for abstinence effect and might be associated with caffeine withdrawal
rather than caffeine itself. It is thus important to restrain from caffeine several days before testing when looking at performance (100).
Alcohol has been shown to decrease CFF frequency as well and to affect cone function and the ERG b-wave (101). Many studies have shown that alcohol reduces the amplitude and increase the latency of the P300 wave (88, 89).
MAIN OBJECTIVES
We used a CFF test after a single eye exposure to a night time light pulse to 1) show the effect of light upon CFF thresholds; 2) correlate the local retinal effect of light on b-wave latency after a single eye light exposure with local modifications in visual CFF and thus visual performance; 3) separate the central and the retinal contribution to these modifications by assessing CFF of an exposed eye and a non-exposed eye of the same volunteer and of an eye of volunteer in control conditions.
MAIN HYPOTHESES
We tested the following specific hypotheses:
1. Single eye light exposure at 02:30 significantly increases CFF threshold in the exposed eye, but not in the unexposed eye.
2. B-wave kinetic changes in ERG, either following a light pulse or during constant dim light conditions, are correlated with increase or decrease in CFF test thresholds, respectively.
SECONDARY OBJECTIVES
Beside the principal aims of our study, we also want to take the opportunity to look at visual evoked potential (VEP). Moreover, in order to assess alertness, vigilance or performance levels independent of the visual pathway, we also looked at variation in P300 wave and reaction time as well as perform the Karolinska drowsiness test (KDT). We will then compare the visual test results with the non-visual test results.
Hence, we intend to show the effect of a bright light pulse on the latency or amplitude of some components of the VEP by eliciting flash VEPs and to correlate these changes with variations in ERG b-wave latency after a single eye exposure to a light pulse.
We also propose to show the effect of a monocular light pulse on the amplitude and/or the latency on the P300 wave and on reaction time using an auditory oddball paradigm. Finally we will look for correlations between variations in reaction time and P300 latency and amplitude with subjective and/or objective alertness.
METHODS
The experiments were carried out in the HPRU/MRC facilities of the University of Surrey (Guildford, United Kingdom). The investigators involved in this study are Dr. Derk-Jan Dijk (University of Surrey), Dr. Mark Hankins (Imperial College, London), Dr. Benita Middleton (University of Surrey), Mr. Neil Stanley (University of Surrey), and myself, Gilles Vandewalle (University of Liege).
Because of a lack of time, only pilot studies have been done and only part of the data have been analyzed at the time this manuscript is subscribed. The pilot studies did not include all the aspects of the actual study, but the protocol of the pilot studies was identical to what we intended to do for the data collection experiments except for slight differences mentioned at the beginning of the “results of the pilot studies” section. After the pilot studies minor changes have been done to the protocol we will use, they will be exposed in the ‘discussion’ section.
NB: All electrodes were placed according to the International 10/20 Electrode Placement System (see appendix 1).
Participants
We will recruit an equal number of 6 males and 6 females between 20 and 40 year old, in good health with no recent acute or chronic illness and no current medication, inside 10% of ideal body weight, with no history of epilepsy or donation of blood in the past 6 weeks. They will be non-smokers, consuming less than 300 mg caffeine per day and less 14 alcoholic units per week on average and negative for any drug abuse. They will also be
screened for abnormal close vision using a reading test (see appendix 7), for abnormal color vision with the Ishihara colour blindness test (see appendix 8); they will complete the Epworth Sleepiness Scale (ESS) questionnaire (see appendix 6) to detect extreme daytime sleepiness and the Pittsburg Sleep Quality Index (PSQI) questionnaire (Appendix 3) to make sure they have regular sleep-pattern with no sleep disorder or extreme circadian type tendency. They must not have been employed as a shift worker within the last year or have traveled across more than one time zone in the past 2 months. Finally, they will fill-in a medical questionnaire (see appendix 5) and give a written consent from their general practitioner.
Volunteers will be asked to abstain from drinking alcohol- or caffeine containing drinks as well as avoiding strenuous physical exercise, especially at night, within 3 days prior to the experiment.
Critical flicker fusion (CFF) test
Volunteers are required to discriminate flicker from fusion in a set of four red light emitting diodes in monocular fixation (one eye is patched) at a distance of 1 meter. The mean CFF threshold of each test is determined by averaging the obtained values from four ascending and four descending frequency variations.
The moment when fusion/flickering is perceived depend on the angle and the distance you look at the LEDs from, so volunteers are asked to try to always be in the same position when they are doing the test.
To avoid any learning effect, the starting frequency of each trial changes at random.
Electroretinogram (ERG) and Visual evoked potentials (VEPs)
(Based on ERG 1999 standard (102) and VEP 1996 standard (83))
For the ERG, we elicited what is called a “single flash response” with a frequency of stimulation inferior to 2 Hz. It is usually done to look at cone response alone and requires background illumination to saturate rods. Because of the alerting effect of bright light, it was not the case in this protocol since we kept the volunteers in dim light (< 8lux), with the rods only partially saturated. We thus obtained a mixed response from rods and cones.
Both eyes were recorded individually, the unexposed eye was patched.
Electrodes
All electrodes had 5 kΩ or less impedance. To record ERGs, we used Mini-Goldi self-adhesive electrodes (Biomed Ltd) or gold disc electrodes (S.L.E. Ltd) attached bilaterally beneath each eyelid with the forehead as reference. To record flash VEPs, we used gold disc electrodes placed over the visual cortex at Oz, O3 and O4 and additionally at O1 and O2; the reference electrode was placed at Fz. Electrodes were maintained in position throughout the experimental procedure.
Light source
The stimulus duration must be shorter than the integration time of any receptor, thus the maximum duration is 5 ms. Responses were elicited using a PS40 stimulator (Grass Telefactor Ltd) eliciting 50 µs duration flashes of fixed intensity of approximately 0.7 J (= a peak luminance of 5 107 cd m2). The stimulator had an integrated dome to diffuse light.
Amplification
Responses were recorded using a Vitaport 2 amplifier (Temec Ltd.). Although the band-pass of the amplifier and preamplifier is recommended to include at least the range of 0.3-300 Hz for the ERG, the band-pass was set between 0.05 and 200 Hz since good signal were often recorded with that type of filters in previous studies. The band-pass filter of the VEP channels was set between 0.16 Hz and 100Hz.
Display of data and averaging
Digitizers sampled responses at a rate of 1024Hz for the ERGs and at 512 Hz for VEPs records. The marker signal coming from the stimulator for each flash was sampled at 1024 Hz. Responses were average over at least 50 consecutive flashes to reduce background noise and decrease variability. Artifact rejection (e.g. blinking) was part of the averaging system.
Measurements
Both amplitude and implicit time were measured. According to current convention on the ERG, the a-wave amplitude is measured from baseline to a-wave trough, the b-wave amplitude is measured from a-wave trough to b-wave peak, and the b-wave time-to-peak is
measured from time of the flash to the peak of the wave. Regarding VEP recording, amplitude measurements are made peak to peak from the preceding peak (between peaks and troughs of the deflection); peak latency measurements (or implicit time) should be taken from the onset of the stimulus to the peak of the component concerned.
Karolinska Sleepiness Scale (KSS)
The KSS has been validated as a measure of subjective level of alertness and has been correlated with decrements in performance (103). Volunteers were asked to estimate their alertness on a scale ranging from 1 (very alert) to 9 (very sleepy) every half hour (see appendix 2).
Karolinska Drowsiness Test (KDT)
The KDT aims to assess objective levels of alertness by measuring EEG power density in artifact free recordings. Volunteers were asked to relax and fixate a dot 1 meter away (in our case the LEDs of the CFF box, turned OFF) with as little movement or blinking as possible (11), for 2 minutes.
Reaction time
Reaction times were recorded while recording P300 waves in an oddball paradigm. We asked volunteers to press a button as soon as they heard an odd sound. A computer recorded the latency between the time the sound was produced and the time the button was pressed.
Measurements not realized during the pilot studies
The P300 wave
The P300 is measured in alert volunteers with their eyes open. Electrical potentials generated by the eye movements and blinks make the recording unusable (89). Volunteers were thus asked to fixate a dot and not to blink while performing the test with the exception
of the stimulation following an odd sound where they could blink if necessary there was never two consecutive odd sounds. Volunteers were asked to press a button as soon as they heard an odd sound and to count the number of odd stimulations.
Electrodes
All electrodes had 5 kΩ or less impedance. We used gold disc electrode (S.L.E. Ltd.) placed at Fz, Cz and Pz and referred to the linked mastoids (A1 and A2). Two additional electrodes were placed to record the electro-oculogram (EOG) 1 cm above one eye and 1 cm under the other eye.
Stimulation source
The frequent and rare sounds were produced by a laptop using the Matlab software. To avoid any learning effect, different routines were used. They all contained 110 sound productions with either 10, 11, 12 or 13 odd stimulations. Volunteers were wearing headphones during the test.
Amplification
Responses were recorded using a Vitaport 2 amplifier (Temec Ltd.). Signals were band-passed between 0.05 to 70 Hz.
Display of data and averaging
Digitizers sampled responses at a rate of 128 Hz. The amplitude of the P300 is about 10µV. The P300 latency and amplitude in each routine were determined after averaging between all odd sound occurrences. In order to compensate for the trial-to-trial latency variability when averaging, we lined up the recordings prior to averaging by giving an estimate of the peak latency on each recording.
Measurements
The measurements were taken at one electrode locally, Pz. The latency was taken earlier at a more frontal location, Fz. The amplitude was measured relative to a prestimulus baseline and peak latency relative to the stimulus onset. The peak is defined as the most positive point in the waveform between 200 or 250 ms and some later time (e.g. 400ms if the stimulus is easy to discriminate, which is our case, or 800 ms if it is difficult). Superimposed wiggles on the P300 wave could be attenuated by low-pass filtering (3-6 Hz cut-off), or when
the amplitude was the main measurement, by taking the mean amplitude value over a period of time (200-400 ms). Trials were rejected if the EOG exceeded 100 µV. The EOG was also looked at to ensure that small eye movements under the exclusion limit did not become time-locked to the stimuli.
Melatonin level assessment
Melatonin levels can be assessed by measuring its concentrations in saliva (129). Volunteers were asked to chew a salivette (Sarstedt Ltd) until it was completely saturated (so for about 1 min) every half hour, starting at 20:30 until 8:00. Samples were not taken too frequently (i.e. every 10 min) or else results would become unreliable because it could change fluid composition or secretion (104).
Changes in posture have been shown to influence saliva melatonin concentration (104), volunteers were thus asked to stay seated 15 min before each sample was taken.
Samples were frozen within 15 min or else melatonin would have started to degrade . Saliva samples will be assayed for melatonin by radioimmunoassay (Stockgrand Ltd.).
Actigraphy and sleep Diary
Whilst there are differences in the way the different actigraphs works, the basic principal stays constant (105). The motion sensor of the actigraph generates a signal voltage each time it moves; this count is then stored in a solid state memory and can be downloaded onto a personal computer using a proprietary interface unit.
Actigraphy has been shown to be sensitive to measuring the effects of medication (hypnotics, melatonin, anesthetics, etc.) or other substances (caffeine, potassium, etc.) on both nocturnal and diurnal activity in healthy volunteers, occupational groups and patients (105). However, two notes of caution need to be raised, the first is that periods of very low activity might be interpreted as sleep periods of sleep. The second concerns the lack of an established standardized methodology.
Volunteers were wearing actiwatches for 7 to 10 days preceding the experiment. The watches were checked when they arrived in the unit and if a volunteer had deviated from his sleep schedule more than 30 min more than twice he was not be allowed to take part in the study.
Every day while wearing their actiwatches, volunteers had to fill-in a sleep diary (see appendix 4). It will be taken with extreme caution since it is a very subjective report; volunteers may not be truthful or not accurate. It was used to have an indication on whether or not they respected the sleep schedule.
Protocol of the experiment
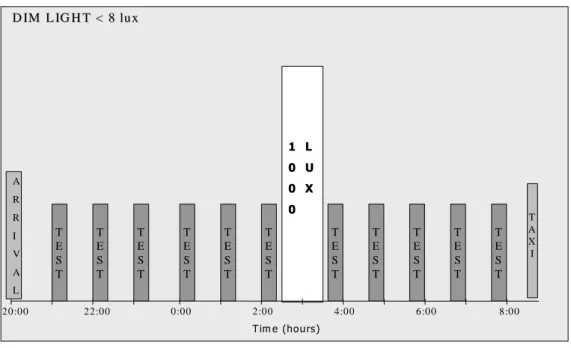
The volunteer arrived at around 20:00 in the experimental facilities. For the actual study, volunteers’ actiwatches will be checked before they will be wired up with the different electrodes. Ambient light levels were dim light (< 8 lux looking toward the light source) for the duration of the experiment, including testing sessions, starting at 20:30. Small snacks were available throughout the night.
Throughout the experimental protocol, the volunteer was asked to stay seated at all times except to go for the bathroom or occasional stretching within the 15 minutes following each test session. The volunteer was allowed to read and converse or listen to the radio as well as using a laptop for work purposes provided that the screen was generating a light intensity bellow 5 lux. Smoking, consumption of alcohol or caffeine-containing drinks and naps were not allowed.
Room temperature was be kept constant and at a comfortable level for the whole experimental time.
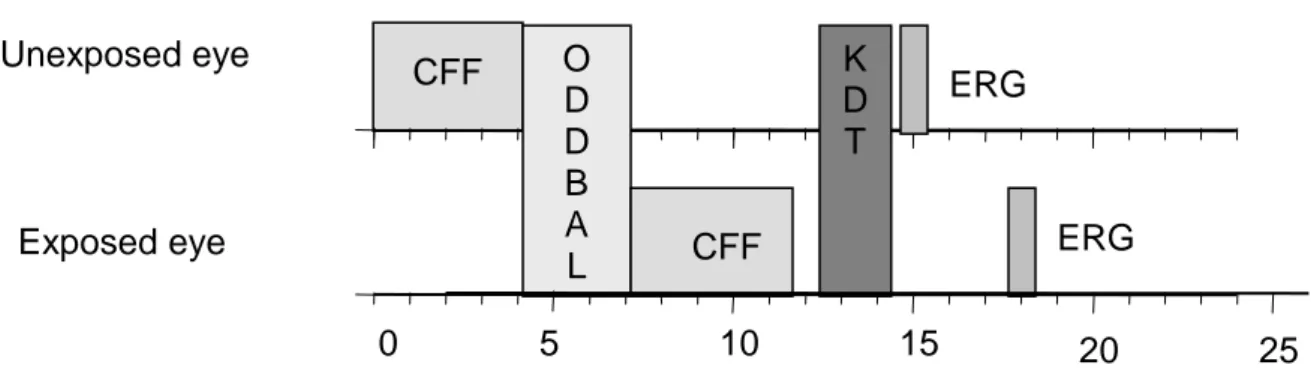
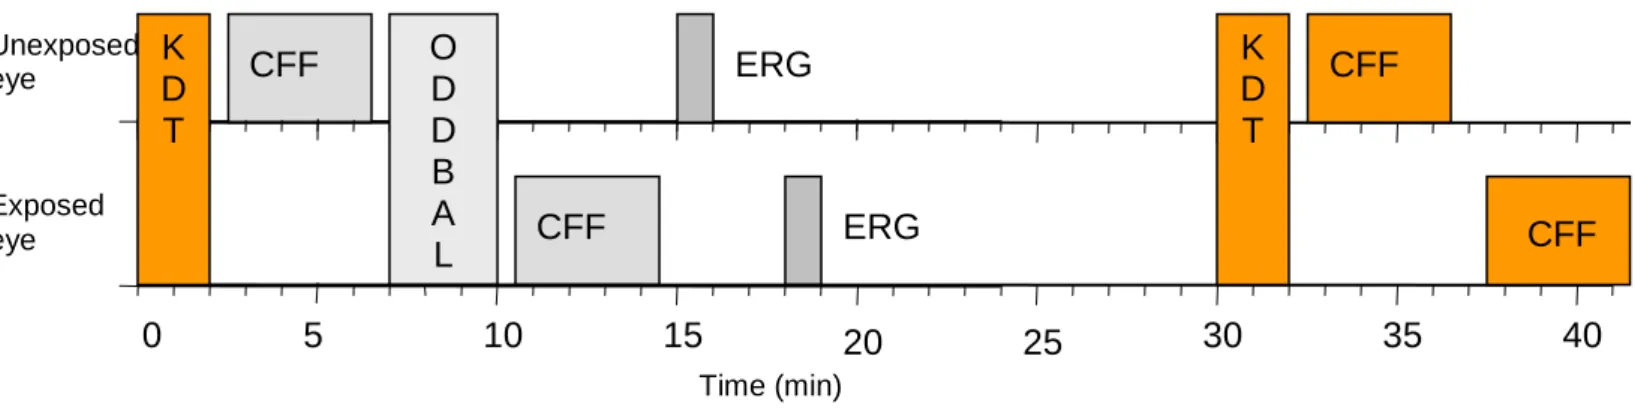
Every testing session included the auditory task (oddball paradigm), a CFF test and an ERG/VEP recording for each eye individually, and a KDT (fig 3). For every visual test and during the light pulse period, the volunteer had one eye patched, which was chosen at random. During the actual study we will have an equal number of volunteers starting with each eye and an equal number of volunteer starting in the control condition and light exposure conditions. The first eye tested remained the same throughout the experimental night.
Twice per hour, the volunteer was asked to complete the KSS. EEG, electrocardiogram (EKG), and EOG were recorded throughout the entire experiment. For the future data collection nights, saliva samples will also be collected half hourly from 21:00 to 08:00. These samples will be assayed for melatonin in order to confirm that the light exposure is effective in suppressing synthesis.
The first testing session was carried out at 21:00 and repeated every hour afterwards until the light pulse (fig. 4).
Based on published alertness, performance (e.g. 11, 13) and ERG (67) data, we decided to apply a one hour light pulse at 02:30, in order to have the greatest effect on vigilance and alertness. The ERG was shown to be affected by a light pulse at 23:00 (67), but because the b-wave latency remains high until at least 04:00 in control condition, it should also be affected by a light pulse at 02:30. In the control condition, the volunteer was seated and reading.
Tests resumed at 03:35, and were repeated every hour until 08:00.
Light pulse: The light boxes used were supplied from OUSIDE IN Ltd (Cambridge) to the
specification of the laboratory (light source = Sylvania CF – LE55W/835, 27916 energy saver Lynx for 10,000lux, Striplight 221mm lamp switched, double insulated 30W for the background lighting). Neutral density filters were used to reach the light intensity of 1000 lux.
Behavior of the volunteers relative to the experimental light source (e.g. blinking, moving gaze, other activity during exposure) was shown to greatly affect the amount of photons reaching the retina or the area exposed and the effect of light on melatonin production and thus on circadian rhythms in general (2).
Hence, the volunteer was seated, very close to the light box (~10 cm) with one eye patched and was asked to 1) fix his gaze within the light source and not to look at its side, 2) avoid blinking excessively, and 3) undertake no other activity (e.g. reading). Routine measurements of the light irradiance were performed with a Macam photometer (Linvingstone, UK) at the observer eye level.
Figure 3: Diagrammatic representation of each test session. Time (minutes) is shown on the horizontal axis.
CFF: Critical Flicker Fusion test; ODDBALL: oddball paradigm tests; ERG: Electroretinogram; KDT: Karolinska Drowsiness Test.
CFF O ERG D D B A L CFF ERG K D T 5 0 10 15 20 25 Unexposed eye Exposed eye
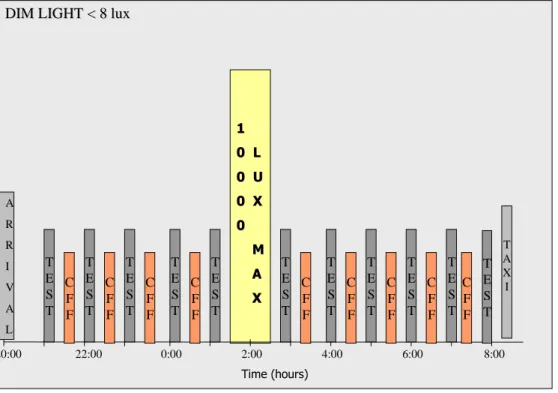
20:00 22:00 0:00 2:00 4:00 6:00 8:00 D IM L IG H T < 8 lux D IM L IG H T < 8 lu x T A X I A R R I V A L T E S T T E S T T E S T T E S T T E S T T E S T T E S T T E S T T E S T T E S T T E S T 1 L 1 L 0 U 0 U 0 X 0 X 0 0 T im e (hou rs)
Figure 4: Diagrammatic representation of the experimental protocol. Time of the day is shown on the
horizontal axis.
RESULTS OF THE PILOT STUDIES
Two pilot studies were carried out with the same volunteer, one in control conditions, one with a bight light pulse at 02:30. The protocol of the pilot studies differed slightly from the experimental protocol described above. The volunteer fitted all the participant requirements with the exception of age and vision. He was slightly above the age limit and did not have perfect vision without glasses. He was allowed to wear his glasses with which he had good close vision. The P300 wave was not looked at because the experimental equipment synchronizing the sound source and the EEG recorder was not ready.
For both nights the right eye was the first eye tested (for the CFF test end the ERG). Some data of the first pilot, realized in control conditions, are not presented in this manuscript because of their poor quality. A few things were improved for the second pilot study in order to collect better data.
The bright light pulse (1000 lux) of 1 hour was given at 02:30 to the left eye in the second pilot study.
KSS
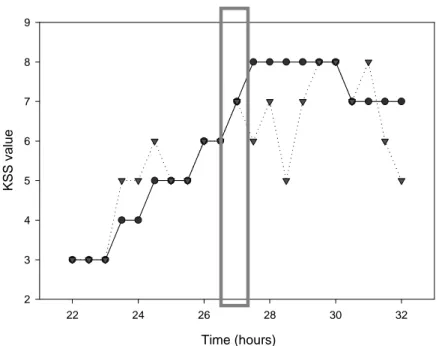
The volunteer evaluated his alertness level on the Karolinska sleepiness scale every half hour starting at 22:00 (fig.5). As the volunteer tended to get more tired, the KSS level increased in both conditions. However, in the second pilot study, although the volunteer did not find it very alerting, the light pulse seems to have slightly decreased the value on the KSS and thus increased the alertness level.
Time (hours) 22 24 26 28 30 32 K S S v a lu e 2 3 4 5 6 7 8 9
Figure 5: Evolution of the KSS in the two pilot studies. First pilot study (control condition): solid line with
circles; Second pilot study (bright light pulse condition): dotted line with triangles; Grey rectangle: bright light pulse position in the second pilot study. KSS values were taken every half hour between 22:00 (22h) and 08:00 (32h).
CFF Test
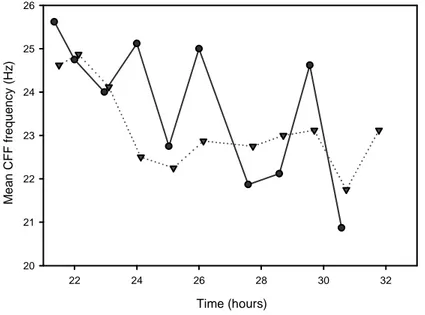
Overall in the control condition, the CFF threshold for both eyes showed a decrease at the beginning of the night (fig.7) to reach a lower level for the rest of the experiment. However, a few facts could be pointed out.
The CFF test appeared to be very sensitive to the level of activity of the volunteer prior to the test. Indeed, the values obtained from the first eye tested (the right eye) were a lot higher than the left eye when the volunteer and the investigator were talking (see value at 24h on fig.7) or when the volunteer was moving a little on his chair (see value at 26h on the graph) just before the test. Once, the volunteer was accidentally seated 15 cm closer to the
CFF box, and the CFF value increased substantially compared to the previous test or to the other eye (see at 29.6h for the right eye on fig.7). The value of the last test of the right eye was a non-value and was taken out of the graph.
Time (hours) 22 24 26 28 30 32 M e a n C F F f re q u e n c y ( H z ) 20 21 22 23 24 25 26
Figure 7: Critical Flicker Fusion threshold evolution during the first pilot study. Left eye: dotted line with
triangles; Right eye: solid line with circles. Tests at 21:30 (21.5h); 22:00 (22h); 23:00 (23h); 00:00 (24h); 01:00 (25h); 02:00 (26h); 03:35 (27.6h); 04:35 (28.6h); 05:35 (29.6h); 06:35 (30.6h); 07:35 (31.6h).
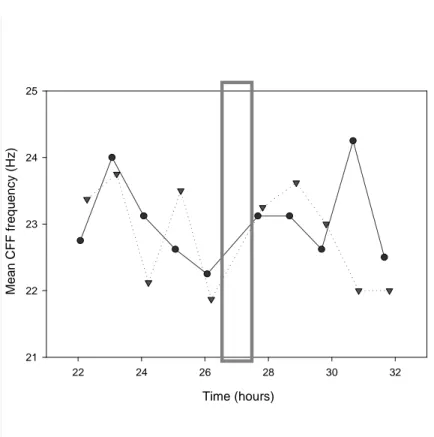
Hence, a few modifications were made for the second pilot involving the bright light pulse; the volunteer was asked to be inactive 5 minutes prior to the start of the test (no talking, no moving around). The results between the two eyes showed more consistency except for one point (25h, left eye).
As in the first pilot, the CFF thresholds decreased at the beginning of the night. They seemed to be affected by the light pulse (fig.8). CFF threshold increased for both eyes after the light pulse and, although this might be a coincidence, the increase was slightly higher for the exposed eye (left eye). In the last part of the night the volunteer became very tired, the variations around the mean CFF value began to increase and values were not very reliable.
Time (hours) 22 24 26 28 30 32 M e a n C F F f re q u e n c y ( H z ) 21 22 23 24 25
Figure 8: Critical Flicker Fusion threshold evolution during the second pilot study. Left eye: dotted line with
triangles; Right eye: solid line with circles; Grey rectangle: light pulse. Tests at 22:00 (22h); 23:00 (23h); 00:00 (24h); 01:00 (25h); 02:00 (26h); 03:35 (27.6h); 04:35 (28.6h); 05:35 (29.6h); 06:35 (30.6h); 07:35 (31.6h).
Reaction Time
Time (hours) 22 24 26 28 30 32 R e a c ti o n t im e ( m s ) 300 400 500 600 700 800 900Figure 6: Reaction time evolution in an oddball paradigm. The volunteer was asked to press a button as soon
Tests at 22:00 (22h); 23:00 (23h); 00:00 (24h); 01:00 (25h); 02:00 (26h); 03:35 (27.6h); 04:35 (28.6h); 05:35 (29.6h); 06:35 (30.6h); 07:35 (31.6h).
In both conditions, variations around the mean RT were great and RT did not show a clear decrement throughout the night (fig.6). The light pulse does not seem to have affected RT.
ERG
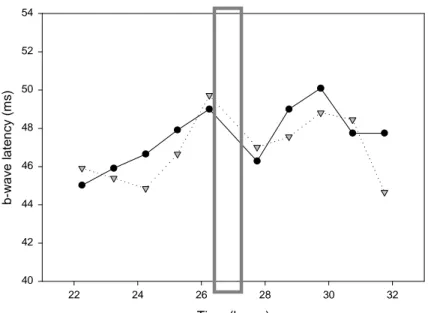
During both pilot studies, the ERG recordings obtained were generally good. However, the determination of the latency of the a- and b-waves was sometime hard to do and values were not very consistent. We only had time to smooth the curve for the second pilot study by the time this manuscript is submitted. This eased the determination of the latency and gave more consistent values. Only the b-wave latency has been envisaged yet (fig.9). Time (hours) 22 24 26 28 30 32 b -w a v e l a te n c y ( m s ) 40 42 44 46 48 50 52 54
Figure 9: b-wave latency variation in the second pilot study (bright light pulse condition). Left eye: dotted line
with triangles; Right eye: solid line with circles. Grey rectangle: bright light pulse position. Tests at 22:00 (22h); 23:00 (23h); 00:00 (24h); 01:00 (25h); 02:00 (26h); 03:35 (27.6h); 04:35 (28.6h); 05:35 (29.6h); 06:35 (30.6h); 07:35 (31.6h).
Both eye showed values in the range of what had been reported in previous studies (1, 60, 61), but the light pulse does not appear to have affected the values of the b-wave latency
as it did in previous studies. The b-wave latency decreased after the light pulse for both eye, seems to be slightly lower for the exposed eye (left eye).
VEP
The flash VEPs data have not been analyzed because of the lack of time at the time this manuscript is submitted.
KDT
The KDT data have not been analyzed because of the lack of time at the time this manuscript is submitted.
DISCUSSION
The principal aims of this study are to test if a single eye light exposure modifies CFF thersholds and to correlate CFF changes with previoulsy reported changes in ERG b-wave latency. We could not consider the secondary aspects of the study at the time this manuscript is submitted.
After compleeting our protocol with one volunteer, it appears that a 1-hour light pulse of 1000 lux at 02 :30 on one eye did affect both CFF and ERG values, although the effects are not very important.
It also appears that the effect of the bright light pulse we used might be greater on the exposed eye compared to the unexposed eye both for the b-wave latency and the CFF threshold. This suggest that the local effect of light on the retina could be separated from the central effect of light on the CNS by assessing visual performance with the CFF test.
In addition, even though only one volunteer has been tested so far and thus no statistical analysis has been performed, it seems that the ERG b-wave latency and the CFF thresholds are negatively correlated. Indeed, keeping in mind that the activity of the volunteer right before the CFF test biased some of the values, when the b-wave latency increased at the beginning of the experiment, CFF thresholds decreased and when the latencies decreased after the light pulse CFF thresholds increased.
Hankins et al. (67) also showed a bilateral effect of light on the ERG b-wave latency and suggested it might be the result of plasma melatonin decrease and thus of an effect of light on the CNS. The reason why we only obtained a slight difference between the unexposed and the exposed eye might be that with our bright light pulse we mostly elicited a central response and that a brighter single eye light pulse is required to obtain a clear ipsilateral decrease.
Hence it seem that both of our main hypothesis are met with our protocol. However, even though the results are good and very encouraging, they could be of better quality and the changes induced by the single eye light exposure could be greater. This is why, we decided to make a few modifications to our protocol.
First, the conditions the volunteers are in before running the CFF test need to be standardized. Hence, we placed the KDT right before the CFF to always have the same period of total inactivity before the evaluation of the first eye. That way we should get more consistent results between the two eyes. We also decided to carry out the CFF tests every half-hour to get rid of some of the variations in the results we will collect. Figure 10 sumarizes the changes we made to our test battery.
Figure 10: Diagrammatic representation of each test session in the modified protocol. Time (minutes) is shown
on the horizontal axis. CFF: Critical Flicker Fusion test; ODDBALL: auditory tests; ERG: Electroretinogram; KDT: Karolinska Drowsiness Test. Modifications from the original protocol are in color.
In addtion, the intensity of the light pulse has been underestimate. The volunteer did not find the light pulse alerting and the effect on the KSS and ERG values are not very important compared to other study (11, 67). Thus, we will use a brighter light pulse of
CFF O ERG D D B A L CFF ERG K D T 5 0 10 15 20 25 Unexposed eye Exposed eye 30 35 CFF CFF K D T 40 Time (min)
maximum 10,000 lux in order to have a greater effect on alertness and especially on the ERG b-wave latency. We also decided to use HF 3305 PHILIPS light boxes. Their manipulation is more convenient and the tubes it is equiped with are enriched in the 480 nm range that has been showed to be more efficient in eliciting ERG latency changes (67) as well as other NIF responses (8, 16, 29).
Finally, because some volunteers might get too tired at the end of the night, as it happened in the second pilot study with our unique volunteer, we decided to advance the light pulse one hour earlier. That way we avoid having too few good observations after the light pulse.
Figure 11 show on overall view of the protocol we will use in the data collection experiment.
20:00 22:00 0:00 2:00 4:00 6:00 8:00
DIM LIGHT < 8 lux DIM LIGHT < 8 lux
T A X I A R R I V A L T E S T T E S T T E S T T E S T T E S T T E S T T E S T T E S T T E S T T E S T 1 1 0 L 0 L 0 U 0 U 0 X 0 X 0 0 M M A A X X Time (hours) T E S T C F F C F F C F F C F F C F F C F F C F F C F F C F F
Figure 11: Diagrammatic representation of the experimental protocol after the modifications. Time of the day
is shown on the horizontal axis. Modifications from the original protocol are in color.
By doing these changes to our protocol we believe that we will be able to clearly show the effect of a single eye bright light exposure on visual performance and reach the objectives of our study.