CO
2valorization by means of Dielectric Barrier Discharge
H Machrafi1,*, S Cavadias2, J Amouroux21
Thermodynamics of Irreversible Phenomena, Allée du Six-Août, 17, B-4000 Liège, Belgium
2
Laboratoire de Génie des Procédés Plasmas et Traitements de Surfaces, 11, rue Pierre et Marie Curie, F-75005 Paris, France
E-mail: H.Machrafi@ulg.ac.be
Abstract. As atmospheric pollution is causing several environmental problems it is incumbent to reduce the impact of pollution on the environment. One particular problem is the production of CO2
by many transport and industrial applications. Instead of stocking CO2 and instead of being a
product, it can be used as a source. The case considered is the CO2 reformation of methane
producing hydrogen and CO. It is an endothermic reaction, for which the activition barrier needs to be surpassed. This can be done efficiently by the method of Dielectric Barrier Discharge. The process relies on the collision of electrons, which are accelerated under an electrical field that is created in the discharge area. This leads to the formation of reactive species, which facilitate the abovementioned reaction. This study is performed using a Matlab program with the Reaction Engineering module in COMSOL (with an incorporated kinetic mechanism) in order to model the discharge phase. Then COMSOL (continuity and Navier-Stokes equations) is used to model the flow in the post-discharge phase. The results showed that both a 2D and 3D model can be used to model the chemical-plasma process. These methods need strongly reduced kinetic mechanism, which in some cases can cause loss of precision.
1. Introduction
Reducing the pollution that is caused by industry and transport has been investigated widely and a part of many efforts that have been made is spent for reducing the emission of CO2. Of many ways, depending on the applications, this paper considers CO2 as a main source in order to reform methane by means of Dielectric Barrier Discharge (DBD). This implies that CO2 is thus used as a source product instead of being rejected into the atmosphere. The study concerns modeling work that is inspired by an experimental set-up (prepared in the laboratory LGPPTS), which is presented in figure 1. The length of the reactor is 120 mm with a diameter of 30 mm, having a 2 mm thick glass wall. The high voltage electrode is 2 mm thick and has a diameter of 26 mm, being consisted out of stainless steel. A gap of 2 mm is allowed between the glass wall and the electrode. The electrode that stands for the ground electrode is a wire sheet of 20 mm width and 2 mm thick, wrapped around the glass tube at the height level of the electrode as is depicted in figure 1. A peak to peak alternative voltage from 5 to 30 kV is supplied by a high voltage generator. The discharge is filamentary. This experimental set-up is taken as the basis for the modeling.
Figure 1: The DBD reactor
The overall reaction that is of interest is given by CO2 + CH4 2 CO + 2 H2 H° = 258.9 kJ/mole.
This, also called the CO2 reforming of methane, is an endothermic reaction, needing energy to surpass its activation barrier. This energy is provided by electrons that are energetic enough to initiate this process by decomposing CO2 into CO and O radicals, as is also suggested by [1] and used in [2]:
CO2 + e- CO + O• + e-
This initiation reaction is also considered by [3]. The following reaction is also proposed by [1]: CO2 + e- C + 2O• + e
-The carbon atom is observed to deposit on to the electrode surfaces, therefore leaving only electrons and oxygen radicals for the reformation of methane into H2. This reaction sequence is proposed by [1], supported by experiments in a plasma environment, to proceed as follows:
CH4 + O• •CH3 + •OH •CH3 + O• H2CO + H•
The H2CO is unstable in cold plasma and gives finally CO and H2: H2CO + (e-/O•/H•/•OH) HCO• + (H•/•OH/H2/H2O)
HCO• + (H•/•O/•OH /•CH3) CO + (H2/•OH/H2O/CH4)
Having set out the main kinetic pathways, this work can be divided in four steps. Before, introducing these steps, the idea is to introduce CO2 at the bottom of the reactor through Gas Inlet A (figure 1) and CH4 through Gas Inlet B. The first step is a 3D COMSOL model, with only the Navier-Stokes equations, in order to determine the velocity fields. A convection-diffusion model is also added in order to look to the diffusion characteristics and to see whether the carbon could have the possibility to deposit on the electrodes. The second step is to use a 2D model with the complete kinetic model (based on the kinetic pathways, discussed earlier and shown later on), so that the concentrations before entering the post-discharge region can be estimated. Since only few reactions can be considered for the 3D model, for computing memory limits, the third step is to reduce the kinetic model having a reasonable agreement with the initial one, using Reaction Engineering Lab in COMSOL. The last step is to use the 3D model, with only the post-discharge region, having the concentrations of the essential species that are calculated by the 2D model.
2. Hydrodynamics, convection and diffusion in the DBD reactor 2.1 Modeling flow in the 3D reactor
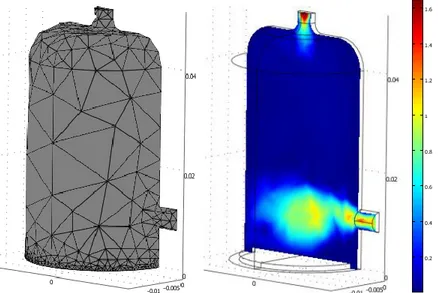
The 3D model as is used in the modeling work is presented in figure 2 with the subdomains, boundaries and mesh.
Figure 2: The mesh of the DBD reactor model
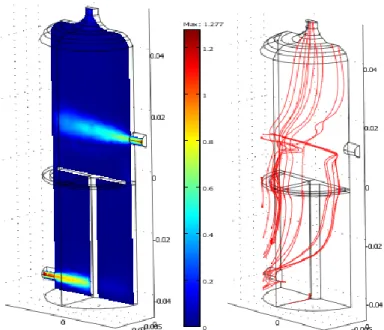
CO2 is let trough at the bottom entrance of the reactor and goes through the discharge region between the reactor wall and the high voltage electrode. The CO2 flow then encounters the CH4 flow that is allowed to enter at the top entrance of the reactor (to the right), 10 mm above the electrode in the post-discharge area. The flow rates for CO2 and CH4 are 1 l/min. This corresponds to respectively 1.3 m/s and 1 m/s (normal to the boundary). The velocity and pressure fields are then calculated by the “Incompressible Navier Stokes” model (ns). Figure 3 shows a “slice” of the velocity field and streamlines at the level of the entrances. The value that is corresponding to the discharge region (around the inlet stream) is not zero but equals around 0.021 m/s. The streamlines show in the discharge region a stable velocity value in contrary to the post-discharge region. This allows using the velocity 0.021 m/s as an inlet velocity for the 2D and 3D model reactors.
2.2 The convection and diffusion in the 3D reactor
The purpose is to find out the convection and diffusion behavior of the two basic constituents CO2 and CH4 in the geometry of the present reactor. A convection and diffusion model (chcd) is added to the “ns” model. A 1:1 ratio (CO2:CH4) between the concentrations of these components is chosen of 1mol/m3. Figure 4 shows the concentrations of CO2 and CH4 obtained from solving for the convection-diffusion equations for these components. Figure 4 shows about the same diffusion characteristics for the two constituents. The deposit of carbon on the electrode would not be inevitable in these circumstances.
Figure 3: Velocity field (m/s) and streamlines for the 3D reactor model
Figure 4: CO2 (left) and CH4 (right) concentrations (from 0 (blue) to 1 (red) mol/m3) in the 3D reactor model
3. The 2D reactor model 3.1 The kinetic model
The kinetic model has been composed out of the reactions proposed in the introduction of which the reaction rates were found in the literature. Since the electrons could also decompose methane the following equations are also proposed [4,5]:
CH4 + e- •CH3 + H• + e- CH4 + e- •CH2 + H2 + e- CH4 + e- •CH2 + 2H• + e-
CH4 + e- •CH + H• + H2 + e- CH4 + e- C + 2H2 + e-
The deposition of carbon will be neglected and not considered in our case and it is assumed that the only electron interaction that is allowed concerns CO2 and CH4. Table 1 shows the kinetic model [5-7] in question. Further CO2/CO/O2/O reactions [8] are included in table 1 describing the neutral interactions between these species. The kinetic mechanism contains 29 reactions and 15 species (T in [K], R in [kcal/(mol*K)]).
Table 1: Kinetic model of CO2 reforming of methane (*Reaction rate in [cm6 molecule-1 s-1]). Number Reaction Reaction rate [cm3 molecule-1 s-1] References
1 CO2 + e- CO + O• + e- 2*10-9 [6] 2 CH4 + e- •CH3 + H• + e- 4.5*10-8 [5] 3 CH4 + e- •CH2 + H2 + e- 7.3*10-9 [5] 4 CH4 + e- •CH + H• +H2 +e- 3.7*10-9 [5] 5 CH4 + O• •CH3 + •OH 1.15*10-15*T1.56*e(-4275/T) [7] 6 •CH3 + O• H2CO + H• 1.33*10-10 [7]
7 H2CO + O• HCO• + •OH 3*10-11*e(-1552/T) [7]
8 H2CO + H• HCO• + H2 3.65*10-16*T1.77*e(-1511.5/T) [7]
9 H2CO + •OH HCO• + H2O 1*10-11 [7]
10 HCO• + H• CO + H2 1.98*10-11*T0.25 [7]
11 HCO• + •O CO + •OH 5*10-11 [7]
12 HCO• + •OH CO + H2O 1.67*10-10 [7]
13 HCO• + •CH3 CO + CH4 8.3*10-11 [7]
14 CO2 + CO2 → CO + O + CO2 4.39*10-7*e(-128.6/RT) [8] 15 CO2 + CO → CO + O + CO 4.39*10-7*e(-128.6/RT) [8] 16 CO2 + O2 → CO + O + O2 3.72*10-10*e(-119.6/RT) [8] 17* CO+ O + CO2 → CO2 + CO2 6.54*10-36*e(-4.3/RT) [8] 18* CO+ O + CO → CO2 + CO 6.54*10-36*e(-4.3/RT) [8] 19* CO+ O + O2 → CO2 + O2 6.54*10-36*e(-4.3/RT) [8] 20 O+ CO2 → CO + O2 7.77*10-12*e(-33/RT) [8] 21 CO+ O2 → CO2 + O 1.23*10-12*e(-25.2/RT) [8] 22 O2 + O2 → O + O + O2 8.14*10-9*e(-118.6/RT) [8] 23 O2 + O → O + O + O 2.00*10-8*e(-114.9/RT) [8] 24 O2 + CO → O + O + CO 2.40*10-9*e(-118/RT) [8] 25 O2 + CO2 → O + O + CO2 2.57*10-9*e(-111.5/RT) [8] 26* O + O + O2 → O2 + O2 6.80*10-34 [8] 27* O + O + O → O2 + O 2.19*10-33*e(4.5/RT) [8] 28* O + O + CO → O2 + CO 2.75*10-34 [8] 29* O + O + CO2 → O2 + CO2 2.75*10-34*e(-128.6/RT) [8]
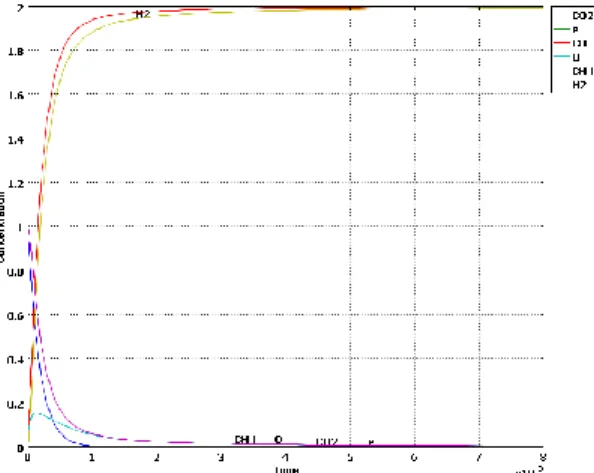
Running this kinetic mechanisms in Reactor Engineering Lab with a 1 mol/m3 initial concentration for both CO2 and CH4 gives the results in figure 5, where all the concentration profiles are shown.
Figure 5: Concentrations as function of the time from the kinetic model of the CO2 reforming of methane (table 1)
It can be seen that the main products are CO and H2, followed by H and O radicals. This result suggests that it would be rather sufficient for the 3D reactor model to consider, next to the electrons, only the H and O radicals as active species in order to model the CO2 reforming of methane.
3.2 The necessity of a 2D reactor model
Due to the large velocity field gradients, running the 3D model with the kinetic mechanism becomes not feasible. Two steps can be considered. The first step is to reduce the dimensional aspect of the modeling to 2 instead of 3. This is possible due to the axial symmetry of the reactor domain. Simulating the discharge region with a 2D reactor model allows to give a modified 3D reactor model (see later on) input values so that only the post-discharge model needs to be evaluated by the 3D reactor model. The kinetic mechanism in the discharge region concerns only the reactions and product emanating from the reaction between CO2 and the electrons. Therefore, these reactions are taken from table 1 (reactions 1 and 14 to 29). The second step is using a strongly reduced mechanism for the reformation of methane by active species coming from the discharge region. The first step is considered in this section and the step in section 4. Figure 6 presents the mesh of the 2D reactor model (which is a “slice” of the 3D reactor model from figure 2).
Figure 6: The mesh of the 2D reactor model
Note that in figure 6, the mesh has been turned 90 degrees. So the left vertical line represents the inlet (where the CO2 enters), though a bit differently. The middle (small part) is where the electron source is introduced. The right part represents the post-discharge region. The same type of “ns” and “chdh” models are used for respectively the Navier-Stokes and convection-diffusion equations. As said before, the inlet boundary limit in the discharge region should be 0.021 m/s. Since the inlet is not exactly the same, the velocity has been changed (it appeared to be 0.0027 m/s), in order to obtain the value of 0.021 m/s at the inlet of the discharge region.
3.3 Reduction of the kinetic mechanism
In order to render the 2D calculation more feasible with sufficient precision, the kinetic mechanism for the discharge region (reactions 1 and 14 to 29 in table 1) is somewhat reduced by eliminating the reactions that have relatively low reaction rates in combination with relatively low product concentrations. The remaining reactions are given by reactions 1, 14 and 15 of table1, containing 3 reactions and 4 species. The CO and O• profiles calculated by this kinetic mechanism showed good quantitative agreement, so that it is not necessary to present the figures. These 3 reactions are then introduced into the 2D reactor model, of which the results are presented in the next section. It should be noted, though, that a too strong reduction of a kinetic mechanism can lead to less precise representation of the chemistry. One of the main objectives is to investigate the feasibility of such a process and the general trends. Therefore, it is considered acceptable using such a reduced mechanism.
3.4 Concentrations of the active species in the discharge region
Before any modeling can be made, it is important to calculate the electron density in the discharge region, since this influences considerably the kinetics, the electrons being energetic initiators of the chemical process. A 1D Matlab program (developed in the laboratory LGPPTS) serves for calculating the concentration of electrons and ions. It is mainly based on solving non-linear equations of conservation for electrons and ions and the Poisson equation for the electric potential. This model predicts an electron density of 1014 cm-3. This electron density is implemented in the 2D reactor model by entering in the subdomain a constant source term for the electron production. In the left domain, an initial CO2 concentration of 1 mol/m3 is maintained. Figure 7 shows the velocity field and the concentrations of the electrons, the H radicals and the O radicals.
Figure 7: From left to right: the velocity field (0 – 0.0236 m/s), the electron concentration (0 – 2.297*10-3 mol/m3), the O radicals concentrations (0 – 1 mol/m3) and the CO concentration (0 – 1 mol/m3)
For the 3D reactor model, the values for the input at the discharge region are taken to be 0.0236 m/s, 2.297*10-3 mol/m3, 1 mol/m3 and 1 mol/m3 for respectively the velocity field, the electron concentration and the O and CO radicals concentration.
4. The CO2 reforming of methane
4.1 Reduction of model
The same reduction procedure is done for the methane part of table 1 (reactions 2 to 13). This gives a kinetic mechanism, described by reactions 2, 3, 6, 8, 10 and 13 of table 1, containing 6 reactions and 9 species. Figure 8 shows the results of running this mechanism together with the one in section 3.3 in Reaction Engineering Lab. Good agreement can be found between the reduced model and the initial model.
Figure 8: Concentrations as function of the time from the kinetic model of the CO2 reforming of methane (table 2)
4.2 The 3D modeling of the post-discharge region
The 3D model in question corresponds to the upper half of the reactor depicted in figure 2 above the discharge region. The values found previously in the discharge region give therefore the inlet boundary limits for the velocity (0.021 m/s) and the concentrations of the electrons and CO:O radicals (respectively 2.297*10-3 and 1:1 mol/m3). The boundaries, subdomains and mesh of this reactor are shown in figure 9. The velocity field is also represented using the same “ns” and “chdh” models as before. This model is then run with the inlet conditions presented above (note that the inlet velocity of the CH4 was set to 1 m/s).
Figure 9: Mesh of the 3D post-discharge region model 4.3 Results of the 2D reactor model
The reduction of the mechanism in the previous section is not enough for implementation into the 3D reactor model. Therefore, the model had to be reduced further by eliminating the reactions that contain constituents with lower concentrations where one reaction is faster than the subsequent, the former having
a constituent as a product, which is the source for the latter (Quasy-Steady-State-Assumption). Then the remaining reactions that follow one pathway (CH4CH3CH2OCHOCO+H2) are regrouped to one overall reaction leading from CH4 directly to CO and H2, taking the reaction rate of the initiation reaction (reaction 2). The reduced mechanism, consisting now of 2 reactions and 6 species (electrons included), is shown in table 2. Figure 10 shows the concentrations of the remaining species.
Table 2: Reduced mechanism.
1 CO2 + e- CO + O• + e- 2*10-9
2+6+8+10 CH4 + O• + e- CO + 2H2 + e- 4.5*10-8
As figure 10 shows, the quantitative values do not agree well. This is just the problem with implementing kinetic mechanisms in 3D codes. However, qualitatively, the values are acceptable and the order of magnitude does not differ much with that of Figs. 5 and 7. Furthermore, such a drastic (loosing precision) reduction is necessary in order to use this kinetic model into the 3D reactor model, of which the results are presented in figure 11. The purpose of this 3D reactor model is, therefore, not to give precise values, but rather investigate the global characteristics and potentials of CO2 reforming of methane in such a reactor.
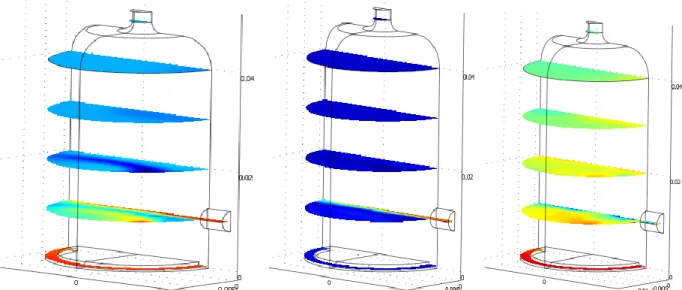
First, the values of the CH4 concentrations were, except for the boundary entrance limit, not significant. Therefore, its results are not presented. It can be seen that hydrogen and CO are mainly formed at the level of the entrance, though more hydrogen is formed (note that the CO concentration was already 1 mol/m3 when leaving the discharge region). It seems that the reactor aerodynamics favor the formation of hydrogen over CO. The concentration of the O radical is also at its highest around the entrance of the reactor, when not considering the O radical concentration at the exit of the discharge region. Moreover, due to the latter situation, it appears that the peak concentration (disregarding the discharge region exit) of the O radical is shifted from the entrance level towards the reactor wall. This corresponds also with the peak concentration of CO. Hydrogen does not seem to be present significantly at that spot, since it comes only from methane, resulting into the formation of hydrogen at the entrance level. CO, however, is formed at both the entrance level and towards the wall. These results represent well (qualitatively) the kinetic mechanisms, having hydrogen formed from the interaction between the O radical, electrons and methane, while CO also has a source near the reactor wall (discharge region exit).
Figure 10: Concentrations as function of the time from the reduced kinetic model of the CO2 reforming of methane (table 3)
Figure 11: Concentrations of (from left to right) CO (max. 1.296 mol/m3), H2 (max. 2.592) and O• (max. 1.244 mol/m3), using the 3D post-discharge reactor model. The red color shows the maximum concentrations and the blue color stands for 0 mol/m3.
5. Conclusions
The CO2 reformation of methane in a Dielectric Barrier Discharge reactor can be modeled quite satisfactorily in a 3D model, provided that the kinetic model is strongly reduced to an extent that the precision decreases. For more kinetic precision, a 2D model offers acceptable results. The aerodynamic flow, convection-diffusion characteristics are shown in the discharge region. For more successful 3D modeling, a higher computer performance is needed.
References
[1] Malik A, Jiang X Z 1999 The CO2 Reforming of Natural Gas in a Pulsed Corona Discharge Reactor, Plasma Chem. Plasma Proc., 19 4.
[2] Kraus M, Egli W, Haffner K, Eliasson B, Kogelschatz U, Wokauna A 2002 Investigation of mechanistic aspects of the catalytic CO2 reforming of methane in a dielectric-barrier discharge using optical emission spectroscopy and kinetic modeling, Phys. Chem. Chem. Phys., 4 668–675.
[3] Eliasson B, Kogelschatz U, Xue B, Zhou L M 1998 Hydrogenation of Carbon Dioxide to Methanol with a Discharge-Activated Catalyst, Ind. Eng. Chem. Res. 37 3350-57.
[4] Oumghar A, Legrand J C, Diamy A M, Turillon N 1995 Methane Conversion by an Air Microwave Plasma, Plasma Chem. Plasma Proc., 15 1.
[5] Kline L E, Partlow W D, Bies W E 1989 Electron and chemical kinetics in methane rf glow- discharge deposition plasmas, J. Appl. Phys, 65 (1).
[6] Eliasson B, Egli W, Kogelschatz U 1994 Modelling of dielectric barrier discharge chemistry, Pure & Appl. Chem., 66 1275-86.
[7] Marinov N M, // Int. J. Chem. Kinet. 1999. Vol.31. P.183-220. [8] Fridman A, Plasma Chemistry, Cambridge University Press, 2008.


![Table 1: Kinetic model of CO 2 reforming of methane (*Reaction rate in [cm 6 molecule -1 s -1 ])](https://thumb-eu.123doks.com/thumbv2/123doknet/6210110.160516/5.918.102.807.325.938/table-kinetic-model-reforming-methane-reaction-rate-molecule.webp)