A Novel Wireless Ring-shaped Multi-site Pulse
Oximeter
Mémoire
Alireza Avakh Kisomi
Maîtrise en génie électrique
Maître ès sciences (M.Sc.)
Québec, Canada
Résumé
Ces dernières années, la supervision continue des signes vitaux des patients a été un sujet d'intérêt de plusieurs travaux de recherche surtout pour ceux qui souffrent de maladies chroniques ou qui travaillent dans des environnements hasardeux. Dans la pratique médicale moderne, le niveau d'oxygène dans le sang est un des signes vitaux primaires tels que la pression artérielle, la fréquence cardiaque, la température corporelle et le rythme respiratoire. L'oxymétrie de pouls est une technique populaire non-intrusive qui permet de diagnostiquer des problèmes liés aux systèmes respiratoire et circulatoire. Pour cette raison, elle est largement utilisée dans les soins intensifs, les salles d'opération, les soins d'urgence, la naissance et l'accouchement, les soins néonatals et pédiatriques, les études du sommeil et les soins vétérinaires. Or, pour l’oxymètre de pouls, une acquisition précise des signaux est importante pour assurer la fiabilité des mesures de la saturation d'oxygène artériel (SaO2). Dans ce cas, le positionnement des capteurs joue un rôle important car la complexité de la structure du tissu du doigt peut rendre l'effet de l'emplacement de la source lumineuse imprévisible sur la mesure du SpO2. Si tel est le cas, un faible nombre de capteurs autour du doigt pourrait perturber la trajectoire des rayons de lumière et corrompre les mesures. Les oxymètres de pouls conventionnels utilisent une pince à doigts contenant les capteurs qui utilise un seul ensemble de LED et photodétecteur (PD). En plus de l'inconvénient des pinces à doigts, le placement du capteur n'est pas corrigé et sera affecté par des artefacts de mouvement. Dans ce mémoire, nous présenterons un oxymètre qui utilise six ensembles de diodes électroluminescentes et de photo-détecteurs, répartis uniformément en anneau autour du doigt, ce qui permet d'identifier le meilleur chemin de signal, immunisant ainsi l'acquisition du signal à l'effet de position de l'anneau. En outre, pour éliminer les fils de la station de base, ce système utilise un émetteur-récepteur radio ce qui supprime les inconvénients de l'attachement. Dans cette étude de conception de preuve de concept, un prototype de cet oxymètre en anneau est réalisé avec des composants commerciaux à faible consommation de courant et le tout est montés sur une carte électronique flex-rigides qui communique avec un hôte distant par
Abstract
Continuous health monitoring for patients with chronic diseases or people working in high-risk environments has been an interesting topic of research in recent years. In modern medical practice, the blood oxygen level is one of the vital signs of the body alongside blood pressure, heart rate, body temperature, and breathing rate. Pulse oximeters provide early information on problems in the respiratory and circulatory systems. They are widely used in intensive care, operating rooms, emergency care, birth and delivery, neonatal and pediatric care, sleep studies, and in veterinary care. Proper signal acquisition in a pulse oximetry system is essential to monitor the arterial oxygen saturation (SaO2). Since the tissue of finger has a complicated structure, and there is a lack of detailed information on the effect of the light source and detector placement on measuring SpO2, sensor placement plays an important role in this respect. Not enough sensors placed around the finger will have an adverse effect on the light path so high signal quality may become impossible to achieve. The conventional Pulse Oximeters use a finger clip, which uses only one set of LEDs and photodetector (PD). In addition to the inconvenience of the finger clips, the placement of the sensor is not fixed and will be affected by motion artifacts. In this thesis, we present a ring-shaped oximeter that uses six sets of light emitting diodes and photodetectors, uniformly distributed around the finger to identify the best signal path, thus making the signal acquisition immune to ring position on the finger. In addition, this system uses a radio transceiver to eliminate the connection wires to a base station which removes the inconvenience of the tethering and reduce the motion artifacts. In this proof of concept study, this novel ring oximeter is implemented with commercial low power consumption off-the-shelf components mounted on a rigid-flex board that connects to a remote host for signal processing and oxygen level calculation.
Table of content
Résumé ... iii
Abstract ... iv
List of Figures ... viii
List of Tables ... xi
List of Acronyms ... xii
List of Symbols... xiv
Acknowledgment ... xv
1 Introduction ... 2
1.1 Pulse Oximetry ... 3
1.2 Challenges in Pulse Oximetry Design ... 3
1.3 Goal of the Thesis ... 4
1.4 Contribution ... 5
1.5 Structure of the Thesis ... 5
2 Literature Review on Pulse Oximetry Methods ... 8
2.1 Introduction... 8
2.2 Basics of Pulse Oximetry... 9
2.2.1 Physiological Basics ... 9
2.2.2 Photoplethysmography ... 11
2.3 Methods for the Measurement of Oxygen Saturation... 12
2.3.1 Light Absorbance Principles ... 12
2.3.2 Light Absorbance in Pulse Oximetry ... 13
2.3.3 Validity of Beer’s Law in Pulse Oximetry ... 20
2.4 Pulse Oximetry Design Overview ... 21
2.4.4 Filters ... 33
2.4.5 Signal Processing Unit ... 36
2.5 Existing Challenges and Problems ... 37
2.5.1 Sources of errors ... 37
2.5.2 Challenges ... 47
3 Ring Shape Pulse Oximeter Design ... 51
3.1 Methodology ... 51
3.2 Principles of Proposed System ... 53
3.3 Photosensor ... 54
3.4 Analog Front End ... 57
3.5 LED Driver ... 59
3.6 Multiplexers ... 60
3.7 Digital to Analog Converter ... 61
3.8 Power Management Unit ... 62
3.8.1 Battery ... 63
3.8.2 Low Drop-Out Regulator ... 63
3.8.3 RLC Filter... 63
3.9 Microcontroller Unit ... 63
3.9.1 Analog to Digital Converter ... 64
3.9.2 UART ... 64 3.9.3 SPI ... 65 3.9.4 Programming ... 65 3.10 Transceiver ... 65 3.11 Rigid-Flex PCB Design ... 66 3.12 Algorithm ... 69
4.1 Quality of signal ... 72
4.2 Algorithm ... 75
4.3 Power Consumption ... 77
5 Discussion and Conclusion ... 79
References ... 82
Appendix A: Ring Pulse Oximeter Microcontroller Code ... 89
Appendix B: Ring Pulse Oximeter MATLAB Code ... 110
List of Figures
Figure 1 Oxygenated and deoxygenated hemoglobin molecules [5]. ... 9
Figure 2 two PPG signal measured by the proposed system. ... 11
Figure 3 Beer’s law showing light absorption through a uniform substance [5]. ... 12
Figure 4 Extinction coefficient of deoxygenated hemoglobin (Hb) and oxygenated hemoglobin (HbO2) [5]. ... 14
Figure 5 Photoplethysmography signal acquired from a living tissue [5]. ... 16
Figure 6 Beer's law in pulse oximetry [5]. ... 17
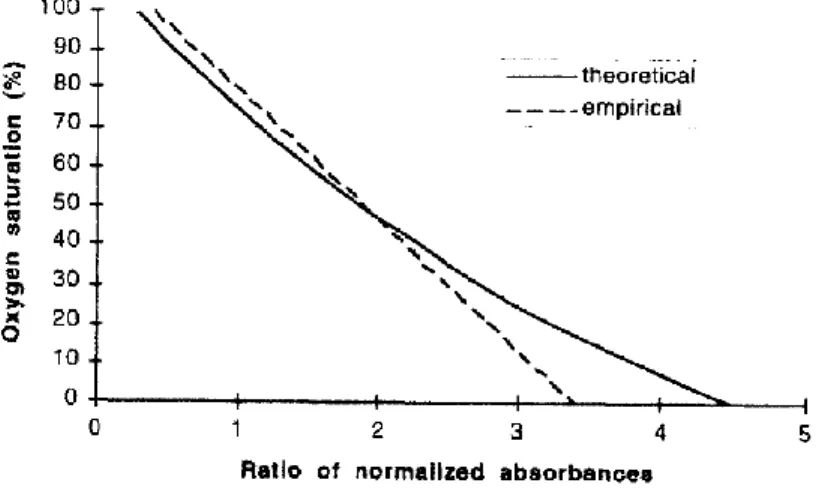
Figure 7 The calibration curves for a pulse oximeters [5]. ... 18
Figure 8 A PPG waveform with its AC and DC [5]. ... 19
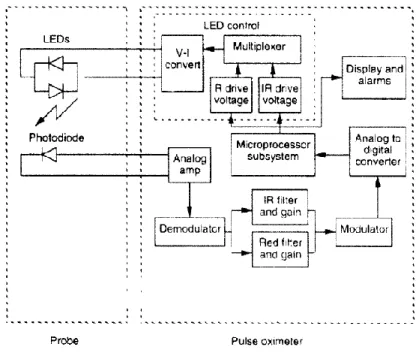
Figure 9 Block diagram of a typical pulse oximeter system. The arrows show the flow of data [5]. ... 21
Figure 10 The mechanical design and distribution of optical components over the flexible PCB: two photo-diode and four LEDs are mounted [23]. ... 24
Figure 11 Dislocation of ring sensors due to an external load. (a) Traditional single-body design under external force. (b) New isolating ring sensor under external force [28]. ... 24
Figure 12 Construction of isolating ring [28]. ... 25
Figure 13 Principle of reflection pulse oximetry illustrating the optical sensor and the different layers of the skin [31]. ... 25
Figure 14 Photo-diode performance under different conditions (a) Photo-diode output in complete darkness and constant light illumination, (b) Calculated and measured photo-diode output, (c) Photodiode output for Red and IR LED [32]. ... 26
Figure 15 Illustration of the developed electronic patch with ring shaped photodetector [33]. ... 27
Figure 16 Prototype reflectance sensor configuration showing the relative positions of the rectangular-shaped PDs and the LEDs [34]. ... 27
Figure 17 PPG signal amplitudes in different conditions [34]. ... 28
Figure 18 A transmittance probe on the left and a reflectance probe on the right. ... 29
Figure 21 Analog front end circuit with analog filters ... 34
Figure 22 Two stage analog front end circuit ... 35
Figure 23 One stage analog front end circuit ... 36
Figure 24 Power consumption comparisons [28], [29]. ... 38
Figure 25 Comparison of SpO2 recording from sensor location with annotated activities [50]. ... 40
Figure 26 Patient with reflective PPG sensor sealed into an individually customized ear mold. The reflective sensor element is placed at the inner tragus. The sensor is connected to the sensor interface device via a cable which is taped for artifact reduction[51]. ... 41
Figure 27 Functional principle of the micro-optic sensor. Since it works in reflection mode, special precautions for the avoidance of direct crosstalk from LED to p-i-n diode have been taken [44]... 42
Figure 28 Auditory canal sensor [37]. ... 43
Figure 29 Contact lens probe [55]. ... 44
Figure 30 3D model of the sensor mounted on an artery [59]. ... 46
Figure 31 Cross-sectional view of the sensor wrapped around a blood vessel. Both stripes are fixed with ligature clips. The oxygen saturation is spectrometrically measured by the transmitted intensity of two wavelengths [57]. ... 46
Figure 32 Encapsulated silicone stripe with two embedded LEDs mounted onto a laser-structured polyimide foil before covering with black colored silicone adhesive for optical shielding [57]. ... 47
Figure 33 CAD drawing of a silicone stripe wrapped around a blood vessel acting as a platform for various embedded sensors [60]. ... 47
Figure 34. Proximal phalanx structure [62]... 51
Figure 35 Preliminary acquired signal from around the proximal phalanx, (a) IR LED, (b) red LED ... 52
Figure 36 Block diagram of the proposed ring shaped pulse oximeter ... 54
Figure 37 LED and PD connection. ... 56
Figure 38 Test prototype of the ring sensors. ... 57 Figure 39 One of the 6 sets of LEDs and PD inside the test prototype of the ring sensors.
Figure 40 AFE circuit with analog filters ... 58
Figure 41 Two stages AFE circuit with digital feedforward ... 59
Figure 42 LED driver with transistor ... 59
Figure 43 LED driver circuit ... 60
Figure 44 Multiplexers circuit ... 61
Figure 45 Digital to Analog converter circuit ... 62
Figure 46 Power management unit circuitry ... 62
Figure 47 Microcontroller connections ... 64
Figure 48 Microcontroller connector for programming ... 65
Figure 49 Nordic transceiver connections and circuitry ... 66
Figure 50 Test Setup Including Custom Prototyping Board, Microcontroller and Ring Sensor ... 67
Figure 51 Designed rigid-flex PCB connections ... 67
Figure 52 3D presentation of the ring shaped sensor ... 68
Figure 53 Top and bottom view of ring shaped sensor ... 68
Figure 54 Flowchart of the algorithm... 70
Figure 55 AC output of the red and IR LEDs ... 72
Figure 56 DC output signal of red and IR signal without tissue. ... 73
Figure 57 DC output signal of the red and the IR signals with the tissue. ... 73
Figure 58 Output signal of the system based on the algorithm in a different position of sensors. ... 76
List of Tables
Table 1 Comparison between three pulse oximetry methods... 31
Table 2 Results of testing different LEDs and PDs to choose the best set... 55
Table 3 Oxygen level measurements with a commercial pulse oximeter ... 74
Table 4 Oxygen level measurements with the proposed system ... 74
Table 5 Variance and standard deviation of oxygen level measurements ... 75
List of Acronyms
AC Alternative Current
ADC Analog-to-Digital Converter
AFE Analog Front End
BW Bandwidth
CAD Computer-Aided Design
CMOS Complementary Metal Oxide Semiconductor
CO Carbon Monoxide
COHb Carboxyhemoglobin
DAC Digital-to-Analog Converter
DC Direct Current
ECG Electrocardiogram
GFSK Gaussian Frequency Shift Keying
Hb Hemoglobin
HbO2 Oxyhemoglobin
HPF High Pass Filter IC Integrated Circuit
IO Input / Output
IR Infrared
ISM Industrial, Scientific, and Medical
LDO Low Drop-Out
LPF Low Pass Filter MCU Micro-Controller Unit
MEMS Microelectromechanical Systems MetHb Methemoglobin
MOSFET Metal Oxide Semiconductor Field Effect Transistor
O2 Oxygen
PC Personal Computer
PCB Printed Circuit Board
PD Photodetector
PI Perfusion Index
PMU Power Management Unit PPG Photoplethysmography
PSRR Power Supply Rejection Ratio
RF Radio Frequency
RLC Resistor (R), inductor (L), and capacitor (C) SaO2 Arterial Oxygen Saturation
SNR Signal to Noise Ratio SO2 Oxygen Saturation
SPI Serial Peripheral Interface SpO2 Peripheral Oxygen Saturation TIA Trans Impedance Amplifier
List of Symbols
i Current L Inductance R Resistance V Voltage C Capacitanceε(λ) Absorptivity (or Extinction Coefficient) c Medium Specific Constant
𝐼0 Incident Light I Transmitted Light T Transmittance of Light A Unscattered Absorbance d Optical Path Length
R Ratio of Normalized Absorbance
k Constant R Resistance V Voltage I Current A Gain ⁰ Degree
Acknowledgment
This thesis is dedicated to my family who always loved and supported me. Also, I want to thank my dear friends who supported me during my Master’s in Canada which was a new section of my life.
Many thanks to my supervisor, Prof. Benoit Gosselin, for his help to complete this degree, a young, brilliant, dedicated professor and head of the Bio-Microsystem’s Laboratory at Laval University. I learned a lot from his collaboration. Also, I would like to thank my co-supervisors, Prof. Amine Miled and Prof. Mounir Boukadoum for helping and guiding me to reach my potentials.
Chapter One
Introduction
1 Introduction
Continuous health monitoring for patients with chronic diseases or people working in high-risk environments has been an interesting topic of research in recent years [1]. In modern medical practice, the blood oxygen level has been considered as one of the important signs of the body functionality along with the traditional ones, such as heart rate, glucose level, blood pressure, breathing rate and body temperature. Pulse oximeters provide early information on problems in the respiratory and circulatory systems. They are widely used in intensive care, operating rooms, emergency care, birth and delivery, neonatal and pediatric care, sleep studies, and in veterinary care [2]–[4]. All these capabilities are because of the possibility of reducing the sensor size and electronic circuits and modern techniques of communication.
In modern medicine, pulse oximetry devices are ubiquitous for measuring the percentage of oxygenated hemoglobin in blood by comparing the transmission or reflection characteristics of two different wavelengths (red and infrared) of light passing through the patient’s body with a photoreceptor.
Lots of designs have been presented up to now and each one has its own advantages and disadvantages. Some papers talk about the methods of reducing power consumption, some try to receive better accuracy, some are trying to minimize the dimension of the sensors and some are trying to introduce new and more effective methods to measure the oxygen level and have better processing of the signals. Also, there are some articles talking about using the invasive method to have better and more accurate signals without any environmental bad effects.
There are different aspects in designing a pulse oximeter which should be considered, including power consumption, sensor size, and its comfortability, finding the best site to put a sensor or the best method of LED configuration and motion artifacts. All of them can be considered as a challenge for a designer. In addition, some researchers are looking for methods to have a good implantable system, which has its own advantages and difficulties.
In this thesis, we will have a total review of different part of a pulse oximetry system and the operation of the whole system. Also, we will talk about the problems which a designer should handle to have a better result. All parts of this review are prepared based on papers, application notes, and online information.
1.1
Pulse Oximetry
Pulse oximetry is a non-invasive method to measure the oxygen level of blood. This method is based on the photoplethysmography (PPG) signal, which contains information related to the blood and its components. The term of PPG refers to an optical and low-cost method to obtain the pulsatile signals demonstrating the volume change of blood in the tissue. PPG signals will be acquired by non-invasive methods to make the measurements on the surface of the skin. The PPG signals is a combination of two signals, AC and DC. The pulsatile (AC) component is caused by changes in blood volume which are synchronous with heartbeats. The non-pulsatile (DC) component with low-frequency components is caused by respiration, sympathetic nervous system activity, and thermoregulation. These changes in volume are detected by illuminating the skin surface with light sources (light emitting diode) and then measuring the reflected or transmitted light to a photoreceptor. The PPG waveform will vary in different subjects, locations, and different manners that the signal is acquired. Since the blood flow can be modulated with different physiological systems, the PPG signal can demonstrate hypovolemia, breathing, and other circulatory conditions. In pulse oximetry method, PPG signals in two different wavelengths are measured and by comparing these two signals valuable information can be obtained. Two different wavelengths of light by two LEDs are sent through the tissue and the received light by a photodetector contains the required information. The received light by the photodetector is a combination of DC and AC signals. Based on Beer-Lambert’s law about light absorption, the ratio of these two components of the received light are used to measure the oxygen level of the blood.
1.2
Challenges in Pulse Oximetry Design
Although the design of a pulse oximeter has a simple base and it is possible to design a test pulse oximeter prototype with simple components, to have a working commercial
pulse oximeter implies lots of challenges and limitations. One of the first challenges that we were facing was the size of the system. Since this design was going to be a ring shape pulse oximeter the size and placement of the components were vital and it led to a rigid-flex PCB design, which has all the required parts to have a wireless low power pulse oximetry system. The other important aspect is designing the wireless system because tethering the pulse oximeter creates some problems like producing more motion artifacts and uncomfortable attachment of the sensors to patients. This wireless system has the possibility of measuring and analyzing the acquired pulse oximetry signals. Also, a separate base station like a mobile phone or computer can be used to do further processing, data saving and displaying the final results. Battery size and its power consumption can be considered as another challenge, which should be taken care of it. Normally most of the power consumption of a pulse oximeter is in the LED driving system, which should be managed to have a minimum power consumption so that it is possible to have small size batteries.
1.3
Goal of the Thesis
In this thesis, we try to design and build a device to measure the heart beat and oxygen level of the blood. Basically, we aim to design a wireless pulse oximeter that is capable of, measuring the oxygen level using light emitting diodes and recording the photoplethysmography responses. By the term “wireless pulse oximeter”, we mean a light-weight device that is not tethered to any other devices or power source. Also, we tried to use the components with lowest power consumption. Although the power consumption is managed to be as low as possible regarding the available off the shelf components, because of using discrete LEDs the power consumption is not minimum. To achieve this goal custom designed LEDs should be used. The pulse oximeter will have embedded optical stimulating and recording circuitry and will be capable of sending the recording signals back to a base station computer in real-time.
We have tried to make this pulse oximetry tool performance as close as possible to the commercial products. In order to do so, along with a complete literature review on the subject, we worked with a local company (Oxy'nov Inc.) specialized in innovative
gathered a set of realistic criteria that were deemed desirable for this type of research tool.
The mentioned characteristics include being wireless, lightweight and having multiple stimulations and recording sensors to increase signal coverage. These characteristics make the pulse oximetry tool suitable for long term (several hours) monitoring of patients with smaller errors caused by motion artifacts.
1.4
Contribution
The design of the wireless pulse oximeter (this work) is based on the experience acquired during the design of proof-of-concept version with limited capabilities. At all stages of the design process of the new pulse oximeter, Alireza Avakh Kisomi (author of this thesis) worked alone on the project. This work presents the design process of a pulse oximetry system that is capable of measuring oxygen level and heart rate using light emitting diodes and photodetectors, which is practical to use in intensive care, operating rooms, emergency care, birth and delivery, neonatal and pediatric care, sleep studies, and in veterinary care. The advantage of this design is replacing finger clip sensors with a ring shaped designed sensors, which provides better signal coverage because of multi-site measurement. Also, this wireless design removes the tethering that causes measurement errors and inconvenience for patients.
The results of this project have been published at two conferences. The first one is a conference paper titled “A Novel Wireless Ring-shaped Multi-site Pulse Oximeter” and it was published in IEEE International Symposium on Circuits and Systems (ISCAS) Montreal, Canada, 2016. The second paper is titled “A Multi-Wavelength Spectroscopy Platform for Whole Blood Characterization and Analysis” and was published in IEEE Engineering in Medicine and Biology Society (EMBC), Florida, USA, 2016. Also, another paper focusing on the multisite sensors and intelligent algorithm of the system is planned to be submitted to a journal.
1.5
Structure of the Thesis
This multidisciplinary thesis is devoted to the design and manufacturing of a low-power, multisite, ring shaped and wireless impedance spectroscopy platform capable of being
Chapter 2 of this thesis is assigned to the literature review and understanding the basics of pulse oximetry systems. In this chapter, the physiological basis of pulse oximetry and photoplethysmography is explained. Then different measurement methods of oxygen saturation, essential system parts in a pulse oximeter and existing challenges are discussed.
Chapter 3 presents the explanation about the methodology of the whole system design. This section talks about the preliminary tests that led to designing such a system and the general idea of the multi-site pulse oximeter. In addition, the proposed system is explained in this chapter.
Chapter 4 has been assigned to system design of the pulse oximetry and explanations about all the analog and digital circuits that are used in this system. The proposed multi-site ring shape pulse oximeter is explained in detail.
Chapter 5 presents the measured results of this research project, discusses the system performance and shows the realized pulse oximeter in detail. The physical design of the pulse oximeter is also discussed in this chapter.
Finally, in chapter 6, the conclusion of this thesis is presented followed by the references and the appendices.
Chapter Two
Literature Review on
Pulse Oximetry Methods
2 Literature Review on Pulse Oximetry Methods
2.1
Introduction
Pulse oximetry is a fast, non-invasive, and common method for monitoring the oxygen saturation of patient’s blood. It was introduced in 1983 [5] and therefore is considered a newcomer in the world of medicine. Nevertheless, it is a very important vital sign of a patient in modern medical practice along with the more traditional ones, such as blood pressure, glucose level, heart rate, body temperature, and electrocardiogram (ECG) signal.
The respiratory and circulatory systems are required to deliver oxygen to the cells. The first step is ventilation so that air moves in and out of the lungs to exchange gas. Oxygen is diffused into the blood, while carbon dioxide diffuses into the lungs. The oxygenated blood circulates in the body to diffuse the oxygen to cells, and carbon dioxide is transferred to the blood that is returning to the lungs.
Pulse oximetry tries to find the possible problems in the process of transporting oxygen to the tissues. Those problems may arise because of improper gas mixtures, inadequate ventilation or diffusion, blocked airways or hoses, poor circulation, etc [5]. The most frequent use of pulse oximetry, where it is recognized worldwide as the standard of care, is in anesthesiology.
Since anesthesiologists administer narcotics to the patients to suppress the central nervous system, tissue oxygenation and, consequently, blood saturation has extreme importance to them. This stops the patient’s desire to breathe and places them in a state where they can no longer meet oxygen demands on their own. In addition, anesthesiologists administer muscle relaxants, which stop the ability to breathe and permits airways to collapse. Thus, it is necessary to restore breathing through intubation and artificial respiration.
In a sense, the anesthesiologist controls for the patient’s respiratory system, and the blood oxygen level provides the best feedback variable. In response to an oxygenation
samples give an accurate measurement of oxygen, but take about 5 minutes to process. Therefore, pulse oximetry has literally revolutionized the field of anesthesiology as a non-invasive, fast, easy-to-use, continuous, and affordable monitoring device [6].
2.2
Basics of Pulse Oximetry
2.2.1 Physiological Basics
Gasses are not solvable in blood because it is mostly made out of the water, and this prevents plasma to carry oxygen effectively in the body. Therefore, hemoglobin is an extremely important compound in the body to help plasma to be able to carry oxygen. In fact, hemoglobin helps plasma to be 65 times more effective in the transportation of oxygen.
Nearly 265 million molecules of hemoglobin, respiratory pigments, are in each red blood cell [5]. Hemoglobin is made out of four heme units and four globin units. Each base unit of hemoglobin can transport one molecule of oxygen. Accordingly, as shown in Figure 1 [5], four molecules of oxygen can be transferred by one hemoglobin molecule.
Figure 1 Oxygenated and deoxygenated hemoglobin molecules [5].
Hemoglobin, as a respiratory pigment, has different colors based on whether it carries oxygen or not. Hemoglobin becomes dark red when it is oxygenated because it absorbs most of the red light beams hitting it. On the other hand, deoxygenated hemoglobin becomes light red as a result of transmitting most of the red light beams. Henceforth,
pulse oximetry uses this feature to measure the oxygen saturation of hemoglobin [7], [8].
In other words, if we shine red light onto blood, we can estimate the level of oxygen by measuring the rate of red light transmission and comparing that with a reference value. Therefore, Infrared (IR) light can be used as a reference value because it has approximately the same transmission rate for both oxygenated and deoxygenated hemoglobin molecules [9]–[11].
Furthermore, this way of measuring oxygen helps us to defer arterial blood from venous blood and other body tissues such as bone and skin pigmentation. In fact, arterial blood pulsatile characteristic affects the waveform of reflected light signal that is different from the reflection of non-pulsatile venous blood and other tissues. Therefore, one of the main advantages of pulse oximeter over other kinds of oximeters is that it does not need absolute calibration regarding the total absorbance of tissue. We will express these statements in the form of mathematical formulas later which can help understanding the concept better.
Regarding other methods of oximetry, some methods consider the partial pressure of oxygen (PO2) while some consider oxygen saturation (So2). Some of these methods function outside of the body while some others function inside the body. Moreover, from the operation perspective, some of them perform based on chemical operations while the operation is optical in others. In chemical methods, the oxygen level in blood is measured by using chemical reactions to extract the oxygen from a sample of the blood. Chemical methods such as the galvanic electrode [12], Van Slyke method [13], the Clark electrode [12], and mixing syringe method [13] tend to be slow.
The first mass-produced CO-oximeter was released in 1966 by Instrumentation Laboratories Inc. [14] and the employed technique of CO-oximeter was based on spectrophotometry which is fundamental for all optical oximetry methods. The method examines the concentration of different kinds of hemoglobin including oxyhemoglobin (HbO2), reduced hemoglobin (Hb) and carboxyhemoglobin (COHb). In Co-oximeter,
oximeter is one the most accurate method although the accuracy is at the time of drawing samples and not all the time [12]. Other optical oximeters have also been used before.
2.2.2 Photoplethysmography
Photoplethysmography (PPG) points to an optical approach that is cost effective for acquiring the pulsatile signal that demonstrates the variation of blood volume in tissue. Non-invasive methods can measure the PPG signals on skin surface [15], [16].
The PPG signals consist of AC and DC signals. Volume change of blood results in pulsatile (AC) component, synchronous with heartbeats. The low-frequency non-pulsatile (DC) part is originated from thermoregulation, respiration, and sympathetic nervous system functions. These components present invaluable information about the body cardiovascular system, however, the basis of them are not fully known [15]. These volume changes are determined by illuminating the skin surface with emitting diode source and computing the reflected or transmitted light to the photoreceptor. The acquired PPG signal will alter in different matters, locations, and manners. Various physiological systems can modulate the blood flow, hence the PPG signal can illustrate hypovolemia, breathing, and other circulatory conditions [17]. Figure 2 shows two different PPG signals that are measured by the proposed system of this thesis.
Figure 2 two PPG signal measured by the proposed system.
Recently a demand for portable, cost efficient, and easy to use technology for clinical setup and primary care got great attention. The obtainable low cost and light weight components and available advanced computer based signal analysis are the aspects that should be studied to meet the requisition. There is a broad span of products from medical instruments companies that apply PPG technique to evaluate blood pressure, cardiac
output, peripheral vascular-related disorders, oxygen saturation, and autonomic function[15].
One of the important variables that should be calculated from PPG is Perfusion Index (PI). Perfusion index is the ratio of the pulsatile component (AC) to the non-pulsatile static component (DC) in the blood passing through the patient's peripheral tissue [18]. Perfusion index acts as an indicator of the pulse strength at the sensor site. The PI's values vary from 0.02% for very weak pulse to 20% for extremely strong pulse [19]. The PI should be used as a tool for optimal placement of the sensor, not as an indicator for accurate SpO2 [20].
2.3
Methods for the Measurement of Oxygen Saturation
2.3.1 Light Absorbance Principles
This section explains the significant physical theorems that underlie the pulse oximeter operation by studying the fundamentals of light absorption in materials.
Beer-Lambert’s or Bouguer’s law defines the attenuation of monochromatic light proceeding in through a homogenous medium consisting of absorbing substance. Figure 3 demonstrates the traveling of monochromatic incident light through matter and its exponential intensity decrease with distance by its partial absorption.
where, 𝜀(𝜆) stands for the absorptivity (or extinction coefficient) of the material at a particular wavelength. c is a medium specific constant parameter representing the absorbing substance concentration, and d is the optical path length through the matter. The concentration, c, is normally measured in 𝑚𝑚𝑜𝑙𝐿−1, and the extinction coefficient
is expressed in 𝐿𝑚𝑚𝑜𝑙−1𝑐𝑚−1.
In each single material, the atoms of all molecules oscillate in definite patterns. The frequencies of light passing through a medium that are close to the vibrational frequencies of the substance are absorbed. The unique spectrum corresponding to each substance could be graphed by extinction coefficient at different wavelengths.
Other essential terms to be defined are transmittance (T) of light as the ratio of transmitted light (I) to the incident light (𝐼0)
𝑇 = 𝐼
𝐼0= 𝑒
−𝜀(𝜆)𝑐𝑑 (2.2)
and unscattered absorbance (A) as the negative natural logarithm of the light transmittance.
𝐴 = − ln 𝑇 = 𝜀(𝜆)𝑐𝑑 (2.3)
The superposition property of Beer's law lets the principle of substance absorption in medium valid for more than one substance such that the total absorption 𝐴𝑡 is calculated by adding each substance contribution independently (superposition).
𝐴𝑡 = 𝜀1(𝜆)𝑐1𝑑1+ 𝜀2(𝜆)𝑐2𝑑2+ ⋯ + 𝜀𝑛(𝜆)𝑐𝑛𝑑𝑛 = ∑𝑛𝑖=1𝜀𝑖(𝜆)𝑐𝑖𝑑𝑖 (2.4) where 𝜀𝑖(𝜆), 𝑐𝑖 and 𝑑𝑖 are the extinction coefficient, concentration, and optical path
length through the matter, respectively. Hence, the concentration of different absorbing substances in a uniform medium could be found out when the extinction coefficients of the substances are known and the absorbance of light is measured at n various wavelengths.
2.3.2 Light Absorbance in Pulse Oximetry
In order to illustrate the blood oxygen saturation phenomena, the basics of light absorbance measurement in pulse oximetry are described in this section.
The main element present in human blood which absorbs light at the same wavelengths as pulse oximetry is Hemoglobin. Depending on the wavelength of the incident light and its chemical binding, Hemoglobin may behave differently when absorbing light. In a healthy adult, functional Hemoglobin, namely oxygenated (𝐻𝑏𝑂2) and reduced
hemoglobin (𝐻𝑏) is the most common type of Hemoglobin in blood. The percentage of oxygen saturation (𝑆𝑂2) can be stated as:
𝑆𝑂2 = 𝐻𝑏𝑂2
𝐻𝑏+ 𝐻𝑏𝑂2 =
𝐶𝐻𝑏𝑂2
𝐶𝐻𝑏+ 𝐶𝐻𝑏𝑂2 (2.5)
Using equation (2.5), the relation between the concentration of Hb and 𝐻𝑏𝑂2, and oxygen saturation (𝑆𝑂2) can be displayed accordingly.
Figure 4 Extinction coefficient of deoxygenated hemoglobin (Hb) and oxygenated hemoglobin (HbO2) [5].
𝐶𝐻𝑏𝑂2 = 𝑆𝑂2× (𝐶𝐻𝑏 + 𝐶𝐻𝑏𝑂2) , 𝐶𝐻𝑏 = (1 − 𝑆𝑂2) × (𝐶𝐻𝑏 + 𝐶𝐻𝑏𝑂2) (2.6) The arterial blood’s saturation is constant throughout the arterial system. The oxygen saturation of arterial blood is termed as SaO2, which has a normal operating range above 90% for a healthy adult.
The extinction coefficients of reduced hemoglobin (Hb) and oxyhemoglobin (HbO2) at the wavelengths in the desired range for pulse oximetry [9], [21], [22] are depicted in
significantly higher light absorbance than HbO2. Both Hemoglobin types indicate the same extinction coefficients at the 805 nm point. However, the transparency of Hb to light from the infrared (IR) region is somewhat higher than HbO2.
In pulse oximetry, the most preferred wavelengths are 660 nm for red and 940 for infrared. One of the major reasons for such choice is that light absorption varies considerably at 660 nm due to the large variation of extinction coefficients of Hb and HbO2. This holds even when having slight variations of oxygen saturation. Another reason could be the availability of LEDs in the mentioned wavelengths that contribute to more cost effective commercial oximeters. Another reason that is worth mentioning is the better robustness achieved in such wavelengths as shifts in the peak wavelength of the LEDs caused by temperature or fabrication (a variation of ±15 nm is typical) will not lead to huge errors thanks to the flatness of absorption spectra in the neighborhood of selected wavelengths.
The total light absorption of the blood can be achieved based on Beer’s Law (considering d as the same optical path length for Hb and HbO2):
𝐴𝑡= 𝜀𝐻𝑏𝑂2(𝜆)𝑐𝐻𝑏𝑂2𝑑𝐻𝑏𝑂2 + 𝜀𝐻𝑏(𝜆)𝑐𝐻𝑏𝑑𝐻𝑏
(2.6)
→
𝐴𝑡 = [𝜀𝐻𝑏𝑂2(𝜆) × 𝑆𝑂2+ 𝜀𝐻𝑏(𝜆) × (1 − 𝑆𝑂2)](𝐶𝐻𝑏 + 𝐶𝐻𝑏𝑂2)𝑑 (2.7) Several elements may absorb light when passing through the biological tissue, e.g. finger or earlobe. Among all the different absorbers, skin pigmentations, bones, and the arterial and venous blood are the main ones that absorb light in the desired region. The light absorption and transmission of a living tissue in time are illustrated in Figure 5. Since the light absorption amount and arterial blood pulsation are related (Figure 5), pulse oximeters can benefit from arterial pulsation.
Figure 5 Photoplethysmography signal acquired from a living tissue [5].
To illustrate, the diameter of arteries enlarges with the raising of the amount of pressure as more blood is carried during systole than diastole. Such phenomena, however, is specific to arteries only. During systole, the light absorption in tissue with arteries boosts as optical path length d in arteries enlarges thanks to the presence of more absorbing substances (Hemoglobin). Such variation in total absorption eases distinguishing between the absorption caused by venous blood, a constant amount of arterial blood, and other non-pulsatile parts like skin pigmentation (DC component of the total absorbance) and the absorption caused by the pulsatile part of the arterial blood (AC component). The AC component of the light absorption is usually no more than 0.5-2% of the DC component. The transmitted light’s signal which changes in time is known as the plethysmography (or photoplethysmography) signal [1], [9], [10], [15], [23], [24]. As Figure 5 and Figure 6 denote since the diameter of arterial vessels are minimal (𝑑𝑚𝑖𝑛)
during diastole, the absorbance of arterial hemoglobin is also minimal with a peak in transmitted light.
𝐼𝐻= 𝐼0𝑒𝑥𝑝 [−𝜀𝐷𝐶𝑐𝐷𝐶𝑑𝐷𝐶] × exp [−(𝜀𝐻𝑏𝑐𝐻𝑏+ 𝜀𝐻𝑏𝑂2𝑐𝐻𝑏𝑂2)𝑑𝑚𝑖𝑛] (2.8)
𝜀𝐷𝐶(𝜆), 𝑐𝐷𝐶 and 𝑑𝐷𝐶 represent the DC light absorbers from the pulsating arterial blood
vessels. The diameter of arterial vessels grows to its maximum during the systole while the transmitted light also reaches a low peak (𝐼𝐿). The maximum diameter is represented by (𝑑𝑚𝑎𝑥)
The aforementioned properties are illustrated in Figure 6. In different wavelengths, LEDs emit different intensities or may have a different sensitivity or absorbing characteristics of the DC components. With this regard, in order to compare the light intensities of different wavelengths, we first have to normalize the measured quantities. By normalizing 𝐼𝐿 with respect to 𝐼𝐻, we get ∆𝑑 = 𝑑𝑚𝑎𝑥− 𝑑𝑚𝑖𝑛
𝐼𝐿
𝐼𝐻
= exp [
−(𝜀𝐻𝑏𝑐𝐻𝑏 + 𝜀𝐻𝑏𝑂2𝑐𝐻𝑏𝑂2)∆𝑑]
(2.10)Figure 6 Beer's law in pulse oximetry [5].
We calculate the natural logarithm of the normalized signal as equation (2.10) shows to find the total absorbance of the AC component in the light pathway. The new constant light level and the ratio, R, of these normalized absorbance is represented by the transmitted light during diastole. The absorbance is considered in the red and IR wavelengths and shows the light absorbers in the arteries.
𝑅 = 𝐴𝑡,𝑅 𝐴𝑡,𝐼𝑅 = −ln (𝐼𝐿,𝑅/𝐼𝐻,𝑅) −ln (𝐼𝐿,𝐼𝑅/𝐼𝐻,𝐼𝑅) (2.10) → 𝑅 = (𝜀𝐻𝑏(𝜆𝑅)𝑐𝐻𝑏+𝜀𝐻𝑏𝑂2(𝜆𝑅)𝑐𝐻𝑏𝑂2)∆𝑑𝑅 (𝜀𝐻𝑏(𝜆𝐼𝑅)𝑐𝐻𝑏+𝜀𝐻𝑏𝑂2(𝜆𝐼𝑅)𝑐𝐻𝑏𝑂2)∆𝑑𝐼𝑅 (2.11)
Here we assume that the optical path lengths are the same for the red and infrared lights. The ratio of normalized absorbance R is then calculated as follows
(2.11) (2.6) → 𝑅 = [𝜀𝐻𝑏(𝜆𝑅)(1−𝑆𝑂2)+𝑐𝐻𝑏𝑂2(𝜆𝑅)𝑆𝑂2](𝑐𝐻𝑏+𝜀𝐻𝑏𝑂2)
[𝜀𝐻𝑏(𝜆𝐼𝑅)(1−𝑆𝑂2)+𝑐𝐻𝑏𝑂2(𝜆𝐼𝑅)𝑆𝑂2](𝑐𝐻𝑏+𝜀𝐻𝑏𝑂2)
→ 𝑅 = 𝜀𝐻𝑏(𝜆𝑅)+[𝑐𝐻𝑏𝑂2(𝜆𝑅)−𝜀𝐻𝑏(𝜆𝑅)]𝑆𝑂2
It is worth mentioning that R is independent of the optical length (diameter of the blood vessels), the intensity of the incident light and the constant amount of light absorption by certain parts of the tissue.
Lastly, we have an equation, (2.12), which is formed to calculate the blood oxygen saturation (𝑆𝑂2) by the measured R.
𝑆𝑂2=𝜀 𝜀𝐻𝑏(𝜆𝑅)−𝜀𝐻𝑏(𝜆𝐼𝑅)𝑅
𝐻𝑏(𝜆𝑅)−𝜀𝐻𝑏𝑂2(𝜆𝑅)+[𝜀𝐻𝑏𝑂2(𝜆𝐼𝑅)−𝜀𝐻𝑏(𝜆𝐼𝑅)]𝑅× 100% (2.13)
To illustrate, the oxygen saturation of the arterial blood (𝑆𝑎𝑂2) can be assessed using
the R of equation (2.13) and the extinction coefficients of Figure 4. 𝑆𝑂2 =0.81−0.18𝑅
0.73+0.11𝑅× 100% (2.14)
Figure 7 illustrates the correlation of parameters from the calibration.
Figure 7 The calibration curves for a pulse oximeters [5].
As discussed earlier, we find the minimum and maximum values of the light intensities of red and IR wavelengths (𝐼𝐿,𝑅, 𝐼𝐻,𝑅, 𝐼𝐿,𝐼𝑅, 𝐼𝐻,𝐼𝑅), find the minimum over maximum ratio and calculate the logarithm of the ratio is counted as R as shown in equation 2.15
𝑅 = 𝐴𝑡,𝑅
𝐴𝑡,𝐼𝑅=
−ln (𝐼𝐿,𝑅/𝐼𝐻,𝑅)
−ln (𝐼𝐿,𝐼𝑅/𝐼𝐻,𝐼𝑅) (2.15)
However, we will show in this section that we can approximate this standard calculation method and extract R by means of using the AC and DC components of the transmitted light signals [5], instead of looking at their minimum and maximum values. Figure 8 illustrates the AC and DC components of a typical waveform of the transmitted light intensity through a tissue.
Figure 8 A PPG waveform with its AC and DC [5].
We have decomposed and approximated the maximum (peak) and minimum (valley) values of this signal as:
𝐼𝐷𝐶 =𝐼𝐻+𝐼𝐿 2 , 𝑖𝑎𝑐 = 𝐼𝐻− 𝐼𝐿 ⇒ 𝐼𝐿 = 𝐼𝐷𝐶− 𝑖𝑎𝑐 2 , 𝐼𝐻 = 𝐼𝐷𝐶+ 𝑖𝑎𝑐 2 (2.16)
Then, we have used the natural logarithm of 𝐼𝐿
𝐼𝐻 according to the standard approach to
calculate R as follows: ln (𝐼𝐿 𝐼𝐻) = ln ( 𝐼𝐷𝐶−𝑖𝑎𝑐/2 𝐼𝐷𝐶+𝑖𝑎𝑐/2) = ln ( 1−𝑖𝑎𝑐/2𝐼𝐷𝐶 1+𝑖𝑎𝑐/2𝐼𝐷𝐶) (2.17)
Since the time-varying (ac) component of the transmitted light signal through the human tissue does not exceed 0.5-2% of its average, we can approximate x as
𝑥=𝑖𝑎𝑐 2𝐼𝐷𝐶 ,|𝑥|≪1 → ln (𝐼𝐿 𝐼𝐻) = ln ( 1−𝑥 1+𝑥) ≃ ln(1 − 𝑥) 2 = 2 ln(1 − 𝑥) ≃ −2𝑥 = −𝑖𝑎𝑐 𝐼𝐷𝐶
(2.18)
The error in the approximation above is negligible, even in the very improbable case of
𝑖𝑎𝑐
𝐼𝐷𝐶= 5%, which will cause an error of 0.02. Now, R can be obtained as
𝑅 = 𝐴𝑡,𝑅
= ln (𝐼𝐿,𝑅/𝐼𝐻,𝑅)
= 𝑖𝑎𝑐,𝑅/𝐼𝐷𝐶,𝑅
2.3.3 Validity of Beer’s Law in Pulse Oximetry
Beer’s law physically states that the sum of transmitted and absorbed light signals is equal to the incident light signal. However, incident light passing through a human tissue does not split solely into absorbed and transmitted portions; there are parts of the light that are reflected at the surface or scattered in the human tissue. Beer’s law does take such parts into account [5].
Although the scattering phenomenon highly increases the absorbance of light, the arterial oxygen saturation level of the blood can still be read by pulse oximeters with enough accuracy for clinical use under normal circumstances. This capability comes from the fact that most of the commercial pulse oximeters use a calibration curve which is obtained based on empirical data, mainly because mathematical modeling of the light scattering problem under different conditions in a complex medium such as human body presents a lot of complications. This calibration is performed using in vitro data. A large set of data is gathered containing information about the ratio R between the normalized absorbance calculated by the pulse oximeter (obtained in clinical studies) and the actual arterial oxygen saturation 𝑆𝑎𝑂2 obtained by the CO-oximeter, which is a very accurate
measurement method. The reader can look up tables or equations that are used to find the relationship between the two above-mentioned variables for a pulse oximeter reading.
As an example, equation (2.14) which is a theoretical calibration curve obtained based on Beer’s law can be modified to [25]
𝑆𝑝𝑂2= 𝑘1−𝑘2𝑅
𝑘3−𝑘4𝑅 (2.20)
where 𝑆𝑝𝑂2 is the saturation of the arterial oxygen measured using the pulse oximeter.
The constants used in equation (2.20) are determined through clinical studies in order for the curve to acquire a best fit into the in vitro measured data. Polynomial expressions are frequently used as empirical calibration curves as well, as follows
Figure 7 demonstrates a representative 2nd-order polynomial calibration curve employed in pulse oximeters. A 1st-order polynomial of the form
𝑆𝑝𝑂2= 110 − 25 × 𝑅 (2.22)
is suggested in the literature [5] as well, as a possible simple approximation for the calibration curve.
In general, obtaining the correlation between various pulse oximeter measurements (𝑆𝑝𝑂2) is sufficient if proper initial calibration is performed. Usually, less than 3% discrepancy will be observed provided that 𝑆𝑎𝑂2 is above 70% [26], [27].
2.4
Pulse Oximetry Design Overview
The block diagram of a typical pulse oximeter system is illustrated in Figure 9 [5]. As we see in this figure, a microprocessor system is the core of the pulse oximeter and, thus, most of the signal processing is performed in the digital domain. This section gives a brief description of the major parts of a pulse oximeter.
Figure 9 Block diagram of a typical pulse oximeter system. The arrows show the flow of data [5].
2.4.1 LEDs and Photoreceptor
yet diminutive enough to fit in a small probe. It is also desirable for the light source at each desired wavelength to have a very narrow emission spectrum, which minimizes error in the measurement of blood oxygen saturation. Fortunately, light-emitting diodes (LEDs) fulfill all the requirements for the light source in a pulse oximeter.
Indeed, one of the improvements of the pulse oximeter over earlier oximeter is the use of LEDs as the light source. The LEDs transmit large intensities of light proportional to the amount of drive current. The LED control block in Figure 9 controls the timing of the LEDs and, in some advanced pulse oximeters, the amount of drive current. The timing of the pulsations is critical because the photodiode cannot distinguish between different wavelengths of light. The pulse oximeter relies on the microprocessor system to synchronize the pulsation of the LEDs with the samples taken by an analog-to-digital converter (ADC) so that the absorbance detected by the photodiode can be attributed to the correct LED.
Normally, a 660 nm red LED and a 940 nm IR LED are used in pulse oximetry, for reasons described before. The typical radiated power of these two LEDs is 1 mW at about 20 mA of DC drive current. LEDs normally are not very efficient, meaning that the majority of the power dissipated by an LED becomes heat. LED power consumption is, in fact, an important consideration since it normally constitutes a large portion of the overall power requirement of the sensor. While most of the pulse oximeters are used in a stationary clinical environment where power is readily available from the nearest wall outlet, some are portable units used in a variety of emergency medical situations or continuous home monitoring. It is therefore essential that LED power dissipation be minimized while still providing adequate radiated power for pulse oximetry.
To minimize the number of wires in each probe (and hence cost), the LEDs are wired in a parallel arrangement with polarities reversed, as shown in Figure 9. This means that while one LED is ON, the other one is under reversed bias. The typical LED has a reverse breakdown voltage (3-5 V) that is larger than the forward voltage of most LEDs (0.9-2.5 V). Thereby, there is no danger of breaking down the LEDs in this arrangement.
The other important practical consideration is that LED drive signals are usually pulsed (chopped). This is mainly to save power dissipation of LEDs. The duty cycle of the pulse varies between 1.5-50% depending on the manufacturer of the oximeter.
Most LEDs have an ON-OFF (or vice versa) switching time of about 100-500 ns which is much faster than their drive chopping frequency (typically in the 0.1-10 kHz range). On the other hand, the photodetector is the main input device of the pulse oximeter system (light sensor) and is normally a silicon photodiode. The use of a single photodiode guarantees that the optical path for both the red and IR light is the same which is an important condition for proper calculation of oxygen saturation. When the p-n photodiode is used in the photoconductive mode, a highly linear relationship exists between the intensity of incident light and the output photocurrent over a span of up to 7 decades. The sensitivity, however, varies significantly with incident light wavelength. The spectral response is determined by the material and the doping used for fabrication and the physical depth of the p-n junction. Therefore, it is important to make sure that the photodiode works properly with the wavelengths of interest to pulse oximetry. When selecting a photodiode, other properties such as junction capacitance and dark current also need to be considered.
The configuration of the LEDs and photodetector can be changed based on the place where the sensors will be used for data acquisition. The transmission mode is very suitable for thin part of the body like finger, earlobe, and feet (for infants), which the light can travel through the tissue and be received on the other side. For this method, a clip to hold the sensors or ring shape sensors are used. Now we introduce some of the LED and photodetector sensor designs presented in different systems and articles. In [23], another ring shape sensor is presented. As it is claimed by the author, in the design of this ring three main aspects have been considered including the comfort for the user, optical properties and safety issues. This ring can be opened during placement operation and then can be locked by pulling a band after placing. Also, two series of LEDs and photoreceptor have been used. The design is shown in Figure 10.
Figure 10 The mechanical design and distribution of optical components over the flexible PCB: two photo-diode and four LEDs are mounted [23].
In the reflection mode, although the quality of the signal is lower, we can have the sensors in every part of the body because both LEDs and photoreceptors are on the same side which means there is no need to use on thin parts of the body.
In [28]–[30], a ring shape sensor is proposed which contains an outer ring covering an inner ring, as shown in Figure 11 and Figure 12. The LEDs and photoreceptor are placed on the inner ring and the outer ring is for coating, and as it is claimed, this structure will reduce the external pressure on the ring and will prevent dislocation of LEDs and photoreceptor, so it can be very reliable against motion artifact. Also, because of the coating, the ambient light has low effect on the signals.
Figure 11 Dislocation of ring sensors due to an external load. (a) Traditional single-body design under external force. (b) New isolating ring sensor under external force [28].
Figure 12 Construction of isolating ring [28].
In [31], the sensors are used in reflection mode and the backscattered signal from the surface of the skin is measured, as shown in Figure 13. It is shown that the pulsatile component of the signal can be amplified by heating the area of the skin. Furthermore, to achieve better signal to noise ratio (SNR), the active area of the photoreceptor has been increased. Also, optimizing the distance between the LEDs and the photoreceptor will improve the SNR.
Figure 13 Principle of reflection pulse oximetry illustrating the optical sensor and the different layers of the skin [31].
In [32], the sensors are in reflection mode, and the diode size has been considered to reduce the overall power consumption. This paper talks about the advantages which were achieved by using a photoreceptor with the larger active area. The results are presented in Figure 14.
(a)
(b)
(c)
In the experiments, it has been demonstrated that by increasing the area of the photoreceptor, it is possible to reduce the overall power requirement.
One of the other ways to increase the area of the photoreceptor is to use a ring shape photoreceptor introduced in [33]. In this work, as it is shown in Figure 15, a ring shaped photodiode has been developed for a wearable reflection pulse oximeter. For continues measurement of signals of a human body, a temperature sensor has been integrated into the chip containing the photodiode.
Figure 15 Illustration of the developed electronic patch with ring shaped photodetector [33].
In [34], the potential of power saving in the design has been considered. Also, the differences between the signals of wrist and forehead have been studied. A new design, Figure 16, for sensors is presented which consists of two LEDs as light sources and two series of six photoreceptors that each series of detectors are arranged in two circular configurations around the LEDs called inner and outer sensors.
Figure 16 Prototype reflectance sensor configuration showing the relative positions of the rectangular-shaped PDs and the LEDs [34].
During measurements, the signals are acquired from near (N), far (F) and the combination of near and far (N+F) photoreceptors. The PPG signals have been measured for two different LED current ((a) R: 8.5 mA and (b) IR: 4.21 mA).
Figure 17 PPG signal amplitudes in different conditions [34].
As we can see, near sensors have a better signal level in comparison to far sensors but the total signal of both near and far is stronger. Also, we can obtain stronger signals from the forehead.
2.4.2 Probes
The probe of a pulse oximeter typically consists of the two (red and IR) LEDs and the photodiode. There are two different types of probes, transmittance and reflectance, which are shown in Figure 18. As the names indicate, a transmittance pulse oximeter measures the amount of light that passes through the tissue, as in a finger probe, to
amount of light reflected back to the probe. Both types use the same technology, differing only in relative positioning of the LEDs and the photodiode.
Figure 18 A transmittance probe on the left and a reflectance probe on the right.
In transmittance probes, the photodiode is placed in line with and facing the LEDs. The trade-off between the applied pressure to the tissue and the detected light determines the distance between the detector and the LEDs. If this distance is too large, the amount of transmitted light decreases, as it is seen from Beer’s law. If it is too small, the force exerted by the probe is significant and the blood under the tissue, where the probe is placed, may clot due to external pressure applied. In a clip type probe, this distance is usually between 10-15 mm [5]. Normally, transmittance probes are placed on the patient’s finger, toe, ear, or nose in adults or on the foot or palms in the infants. One important biological reason behind the selection of these body locations for the probing is that the body will decrease blood flow to these parts before more vital organs, so the physician can take notice of a problem in the oxygen delivery system before it is too late.
The idea of using light reflection instead of light transmission in oximetry was first described in [35]. In reflectance probes, the LEDs and the photodiode are placed on the same side of the skin surface, as displayed in Figure 18. Normally, these types of probes are placed on the forehead or temple where there are large and smooth bones under the skin which can reflect a large amount of LED light.
Studies have been performed to compare these two types of probes and optimize their design to enhance the performance of a pulse oximeter [34], [36]. However, it is known that, in general, the basic advantage of transmittance probes over their reflectance
counterparts is the intensity of the light detected by the photodiode. As the amount of light passing through thin tissue is greater than the amount of light reflected and as the light passing through the tissue is concentrated in a particular area whereas the reflected light is usually distributed over a relatively large area surrounding the LEDs, the intensity of detected light is larger for transmittance probes. Consequently, having fixed all the other parameters, a transmittance pulse oximeter often performs more accurately and robustly than a reflectance oximeter. The major disadvantage of transmittance probes is that the sensor application is limited to the peripheral parts of the body such as the finger. Reflectance probes can be placed on virtually any place on the body where we can expect light reflection due to tissue.
Some of the pulse oximeter probes are reusable, while some are disposable. The main advantage of the reusable probes is the low per use cost involved because we use the same probe over and over. However, reusable sensors require cleaning between patients to minimize the risk of cross contamination.
In addition to the mentioned signal acquisition modes, there is another light path which was proposed in [37], [38] that should be used in auditory canal and the expression “Circummission pulse oximetry” was suggested for it. In this method, the optoelectronic components face outside the canal and away from each other, using a semi-circle path for light to travel through the tissue.
The best operation of a pulse oximeter is the time when all the light passes through the tissue. However, because of the wrong size of the probe, not applying the probe in the right way or misalignment of the sensors, some part of the light passes by the side of the artery (shunting). This reduces the strength of the signal and causes some error in the pulse oximeter’s results.
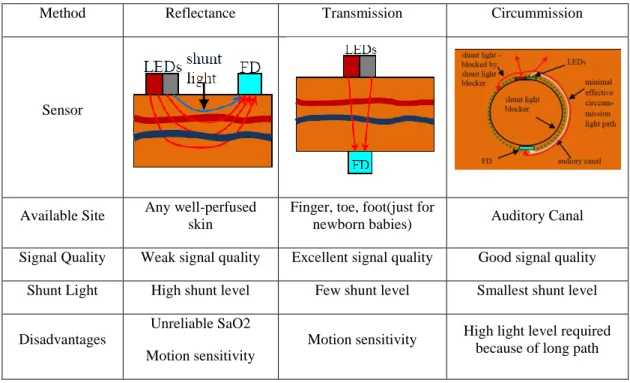
The shunt light level is high in reflection mode and it will be decreased by using the transmission mode. Based on [37], [38], the shunt level is decreased by using the presented method in their papers. Table 1 shows a comparison between the 3 mentioned methods, [37]. As it is shown, the quality of the signal is good in circummission method
Table 1 Comparison between three pulse oximetry methods.
Method Reflectance Transmission Circummission
Sensor
Available Site Any well-perfused
skin
Finger, toe, foot(just for
newborn babies) Auditory Canal
Signal Quality Weak signal quality Excellent signal quality Good signal quality
Shunt Light High shunt level Few shunt level Smallest shunt level
Disadvantages
Unreliable SaO2 Motion sensitivity
Motion sensitivity High light level required
because of long path
2.4.3 Front End Amplifier
One of the most important parts of a pulse oximetry system is the transimpedance amplifier (TIA) which affects the whole system noise sensitivity and speed. The main role of this part of the system is to convert the current, produced by the photodetector, to voltage. Different topologies for TIA have been proposed up to now. The most popular topology is the shunt feedback which is a voltage inverting amplifier and a feedback resistor. The feedback resistor affects the dynamic range of the TIA that is defined as the ratio of maximum to minimum photocurrent which can be properly sensed[39]. A good TIA should have a good performance against the noise which means a good signal to noise ratio (SNR), it should also have small input impedance. Figure 19 shows a conventional TIA topology which uses an ideal op-amp [39].
The photodetector is modeled as a current source which is parallel with a capacitance. And a resistor is used in the feedback loop, which determines the gain of the amplifier. The output gain is,
𝑉𝑂𝑈𝑇 = 𝐼𝐼𝑁𝑅𝐹
→ 𝐺𝑎𝑖𝑛 = 𝑉𝑂𝑈𝑇
-A IIN CD
Vout
PD
RF
Figure 19 TIA topology based on an ideal op-amp [39].
In this circuit, it is considered that the whole current passes through the feedback resistor and it means that the input current of the amplifier should be very small so that it could be ignored.
The research in the field of TIA can be categorized into three groups. First, the papers that are using a precise amplifier with a resistor as a feedback loop, so there is no design of TIA. A shunt feedback resistor with an amplifier is used and the operation of the TIA is based on the design of the op-amp. In these cases, the op-amp should have a very high gain and very small input current noise.
Second, the TIA design for photoplethysmography signals. These designs are very suitable for different current and frequency ranges used in PPG signals but there is a problem that the DC part of the signal is rejected and there should be some modification in these circuits because for measuring the oxygen level the ratio of DC and AC is required. These circuits should be designed in a way that makes the measurement of the DC component possible. In other words, after separating the AC and DC instead of rejecting the DC it can be measured to do the calculation [40]–[42].
Third, the high-frequency TIA designs that the current range is completely different from the desired frequency for pulse oximetry, for example, the maximum input current is 1 mA that is not practical to be used for pulse oximeters [39].
For the shunt-feedback TIA amplifiers, a large feedback resistor is used in order to minimize its contribution to the input referred noise current achieving a good noise
𝑖𝑛𝑜𝑖𝑠𝑒,𝑅𝐹= 4𝑘𝐵𝑇
𝑅𝐹 (2.24)
Then, a high open-loop inverting amplifier gain A is required to provide enough bandwidth (BW) [1].
𝐵𝑊 ∝ 𝐴
𝑅𝐹𝐶𝐷 with 𝐴 ≫ 1 (2.25)
In [24], as shown in Figure 20, an innovative design is proposed which uses a MOSFET as a feedback loop. The advantage of this design is that the output of the TIA has a direct relation with the ratio of AD and DC component of the signal. Also, a three stage amplifier with controllable gain is used to have an overall gain for the TIA. In this design, the power consumption of the whole system is also reduced.
A Q
II CD
Vout VDD
Figure 20 The proposed trans impedance amplifier [24].
2.4.4 Filters
Filter circuits in an analog front end can be considered as the most important parts, since they are used to remove noise, and separating DC and AC components. Based on the signal acquisition method and the quality of the signal, different types of filters can be used in the analog front end including low pass filters (LPF), high pass filters (HPF) and notch filters.
LPF is used to remove high-frequency noises in the environment which can be caused by many different reasons and have various types. Also one of the conventional types of noise is 60 Hz (or 50 Hz) noise, which is made by the local power line frequency. In
some cases, using a notch filter is the best way to eliminate this type of noise. Moreover, DC and AC components of the signal should be separated in some systems, and an HPF filter can be the solution to remove the DC components. At the end of the AFE circuit, an amplifier stage can be used to set the level of the signal to a suitable value for ADC. These amplifiers should be low power and low noise and in some designs, the amplifiers can be an LPF too.
Although there should be some filters to remove the noise to have a clear signal, the existing noise can be decreased by some post-processing algorithms in the microcontroller unit. In [2], a small size and low-cost pulse oximeter appropriate for wearable applications is presented that produces unfiltered PPGs ideal for emerging diagnostic algorithms. This design is distinguishable from conventional systems because of its filter free embodiment which employs only digital subtraction on the signal as a signal compensation mechanism [2].
Figure 21 Analog front end circuit with analog filters
Based on the type of filtering different circuitry can be proposed to be used as the AFE. The analog front end is designed for amplification, conversion, filtering, and separation


![Figure 13 Principle of reflection pulse oximetry illustrating the optical sensor and the different layers of the skin [31]](https://thumb-eu.123doks.com/thumbv2/123doknet/6254261.162889/40.918.262.680.619.998/figure-principle-reflection-oximetry-illustrating-optical-sensor-different.webp)

![Figure 17 PPG signal amplitudes in different conditions [34].](https://thumb-eu.123doks.com/thumbv2/123doknet/6254261.162889/43.918.270.676.210.698/figure-ppg-signal-amplitudes-in-different-conditions.webp)

![Figure 20 The proposed trans impedance amplifier [24].](https://thumb-eu.123doks.com/thumbv2/123doknet/6254261.162889/48.918.282.678.456.729/figure-proposed-trans-impedance-amplifier.webp)
