HAL Id: dumas-00793156
https://dumas.ccsd.cnrs.fr/dumas-00793156
Submitted on 21 Feb 2013HAL is a multi-disciplinary open access archive for the deposit and dissemination of sci-entific research documents, whether they are pub-lished or not. The documents may come from teaching and research institutions in France or abroad, or from public or private research centers.
L’archive ouverte pluridisciplinaire HAL, est destinée au dépôt et à la diffusion de documents scientifiques de niveau recherche, publiés ou non, émanant des établissements d’enseignement et de recherche français ou étrangers, des laboratoires publics ou privés.
High speed rail contribution to sustainable mobility
Thomas Baron
To cite this version:
Thomas Baron. High speed rail contribution to sustainable mobility. Business administration. 2009. �dumas-00793156�
0
THOMAS BARON
Mémoire de stage de fin d’études – Septembre 2009
M
ASTER
2
T
RANSPORTS
U
RBAINS ET
R
EGIONAUX
DE
P
ERSONNES
S
TUDY ON
H
IGH
S
PEED
R
AIL
CONTRIBUTION TO
S
USTAINABLE
M
OBILITY
2
Fiche bibliographique
[Intitulé du diplôme]
Master Professionnel Transports Urbains et Régionaux de Personnes (TURP) [Tutelles]
- Université Lumière Lyon 2
- Ecole Nationale des Travaux Publics de l'Etat (ENTPE) [Titre]
La contribution de la grande vitesse au développement durable [Sous-titre]
[Auteur]
Thomas BARON
[Membres du Jury (nom et affiliation)] Patrick BONNEL, LET ENTPE Aurélie JEHANNO, SYSTRA Conseil Guillaume MARTINETTI, SYSTRA Conseil [Nom et adresse du lieu du stage]
SYSTRA Conseil 93, rue de la victoire 75009 Paris
[Résumé]
Dans un contexte de changement climatique et d’augmentation de la mobilité avec des contraintes budgétaires croissantes, seuls les projets respectant les piliers du développement durable (économique, social et environnemental) pourront être envisagés. Il s’agit donc de montrer aux autorités décisionnaires en quoi la Grande Vitesse ferroviaire répond par rapport aux autres modes de transport concurrents à ces critères. L’étude comprend une analyse multicritère pour comparer l’impact des lignes à grande vitesse avec ses concurrents selon des aspects environnementaux, économiques et sociaux. Ensuite une présentation du bilan carbone comme nouvel outil d’évaluation des projets de transport dans le domaine environnemental est donnée. [Mots clés] Grande Vitesse Développement durable Bilan Carbone Diffusion : - papier : [oui/non]* - électronique : [oui/non]*
(* : Rayer la mention inutile)
Confidentiel jusqu'au : 01/09/2012 [Date de publication] Septembre 2009 [Nombre de pages] 106 [Bibliographie (nombre)] 4
3
Publication data form
[Entitled of Diploma]
Master Degree Diploma in Urban and Regional Passenger Transport Studies [Supervision by authorities]
- Université Lumière Lyon 2
- Ecole Nationale des Travaux Publics de l'Etat (ENTPE) [Title]
High Speed Rail contribution to Sustainable Mobility. [Subtitle]
[Author]
Thomas BARON
[Members of the Jury (name and affiliation)] Patrick BONNEL, LET ENTPE
Aurélie JEHANNO, SYSTRA Conseil Guillaume MARTINETTI, SYSTRA Conseil [Place of training]
SYSTRA Conseil 93, rue de la victoire 75009 Paris
[Summary]
In a context of climate change, increase in mobility and growing budgetary constraints, projects that fit with the pillars of sustainable development will be the only to be envisaged. This study aims to demonstrate to authorities the advantages of High Speed Rail as a comparison with other transport modes within the framework of sustainable development. The study contains a muti-criteria comparison of High Speed Rail with its main concurrent for environmental, economical and society aspects. Then a presentation of a carbon balance methodology as a new tool to evaluate transport projects in the fields of environment.
[Key Words] High Speed Rail
Sustainable Development Carbon Balance
Distribution statement : - Paper : [yes / no]*
- Electronic : [yes / no]*
(* Scratch the useless mention) Declassification date : 01/09/2012
[Publication date] September 2009
[Nb of pages]
4
Remerciements
Je tiens à adresser mes remerciements à ma tutrice de stage, Aurélie JEHANNO, ainsi qu’à ses collègues Dan PEPION et Guillaume MARTINETTI pour leur encadrement leur disponibilité, et leurs conseils avisés.
Je remercie également toute l’équipe de SYSTRA Conseil pour leur accueil chaleureux et leur aide tout au long du stage. Je remercie notamment son directeur Hubert METGE et son adjointe Nadège BOURGIS pour m’avoir fait confiance en retenant ma candidature.
Je souhaite également remercier mes interlocuteurs des départements Génie Civil et Ouvrages d’art et Equipements et Systèmes de Transport de SYSTRA pour l’ensemble des données qu’ils m’ont fournies et pour le travail conséquent accompli pour cela.
Je remercie Messieurs Bruno FAIVRE D’ARCIER et Patrick BONNEL responsables du master Transports Urbains et Régionaux de Personnes pour m’avoir permis de concrétiser mon orientation professionnelle et pour leurs précieux conseils.
Enfin, je tiens à remercier l’ensemble de la 17ème promotion du master TURP pour l’année passée, et
5
SOMMAIRE :
REMERCIEMENTS...4
PRESENTATION DU STAGE ET DE L’ENTREPRISE ...7
1 Présentation de l’étude ...7 2 Les Origines de SYSTRA...8 3 SYSTRA aujourd’hui...8INTRODUCTION... 10
HIGH SPEED RAIL AND SUSTAINABLE DEVELOPMENT... 11
1 High Speed Rail Definition ...11 2 High speed Rail Development worldwide...12 3 High Speed Rail and Sustainability ...13 3.1 Definition of sustainability... 13 3.2 Implications for the transport sector and High Speed Rail... 13I. HIGH SPEED RAIL AND THE ENVIRONMENT ... 15
1 Insertion in the environment...16 1.1 Impacts on Natural Habitat ... 16 1.2 Impact on the fauna ... 17 2 Impact on pollution and global warming...18 2.1 Energy consumption... 18 2.2 Air pollution and Global Warming ... 20 2.3 Global warming ... 23 3 Impact on habitat and living conditions ...24 3.1 Assessment of Noise pollution impact for society... 24 3.2 Transport modes contribution to noise pollution ... 27 3.3 Solutions to contain noise burden... 30 3.4 Particular disturbances due to High Speed Rail... 34 4 Conclusion ...35II. HIGH SPEED RAIL AND THE ECONOMY ... 36
1 What are the costs of High Speed Transport ...37 1.1 Infrastructure costs ... 37 1.2 Rolling stock and operating costs ... 406 2 How High Speed Rail can be funded?...43 2.1 Different types of funding sources ... 44 2.2 Main trends of transport funding... 44 2.3 Modal comparison of funding experiences ... 45 3 High Speed Rail contribution to the Economy ...48 3.1 High Speed Rail and the concurrence... 48 3.2 Impact on economic activity and regional development ... 51 3.3 High Speed Rail externalities ... 57 4 Conclusion ...59
III. HIGH SPEED RAIL AND THE SOCIETY... 61
1 Safety ...62 1.1 A modal comparison of fatality rates ... 62 1.2 Safety and railways... 65 2 Social Equity...67 2.1 Affordability... 67 2.2 Ethic and prices... 70 2.3 Territorial equity... 72 3 Social mutations...75 3.1 Impacts on living conditions ... 75 3.2 Changes in social structures ... 76 3.3 Impacts on mobility ... 76 4 Conclusion ...77LE BILAN CARBONE, UN OUTIL D’EVALUATION DES PROJETS DE TRANSPORTS.... 79
1 Une nouvelle méthode d’évaluation...79 1.1 Définition du Bilan Carbone... 79 1.2 Intérêt de la démarche dans les processus d’évaluation et dans le cadre de l’étude... 81 1.3 Une nécessaire adaptation aux projets de transport ... 82 2 Présentation de la méthodologie de l’étude ...85 2.1 Définition de l’étude... 85 2.2 Méthodologie utilisée... 86 3 Conclusions et remarques personnelles ...92CONCLUSION GENERALE ... 93
TABLE DES ILLUSTRATIONS ... 94
ANNEXES ... 96
7
Présentation du stage et de l’entreprise
Le présent mémoire a pour objet de présenter le travail accompli durant les 6 mois de stages que j’ai effectués au sein de Systra Conseil. Ce stage s’est déroulé dans le cadre du programme du Master 2 Transports Urbains et Régionaux de Personnes (TURP) de l’Université Lyon II et de l’Ecole Nationale des Travaux Public d’Etat (ENTPE).1 Présentation de l’étude
L’étude que j’ai réalisée traite de la contribution de la grande vitesse ferroviaire à la mobilité et au développement durable. Elle a été réalisée pour le compte de l’Union Internationale des Chemins de fer (UIC). L’UIC est une association internationale qui représente les entreprises du monde ferroviaires au niveau international. Crée en 1922, elle regroupe aujourd’hui pas moins de 199 entreprises dans le monde. L’UIC défend les intérêts de ces compagnies à travers notamment une action de lobbying assez forte. Par ailleurs, la contribution de l’UIC en termes de publications sur différents thèmes inhérents au monde ferroviaire est assez importante et son important réseau d’adhérents lui permet d’obtenir des informations des entreprises dans le domaine ferroviaire à travers le monde.
L’objet de l’étude pour le client a été de démontrer la supériorité de la grande vitesse ferroviaire sur les mondes concurrents autoroutiers et aériens à travers 2 volets :
• Une étude comparative des avantages des lignes à grande vitesse selon les critères du développement durable. Ce travail qui constitue l’essentiel du présent mémoire est donc un travail de recherche. Il a pour objectif de rassembler les enseignements contenus dans les différentes publications qui ont été publiées sur le sujet.
• La réalisation d’un bilan carbone permettant notamment de connaitre l’impact d’une ligne à grande vitesse durant son cycle de vie en termes d’émissions de gaz à effet de serre. Le bilan carbone comprend également des éléments de comparaison entre les différents projets de LGV auxquels a participé SYSTRA, ainsi qu’une comparaison avec un projet aéroportuaire et un projet autoroutier. L’étude se terminant bien après la rédaction de ce mémoire, les résultats définitifs ne sont pas encore disponibles. Ainsi la partie consacrée au bilan carbone a pour vocation principale d’expliquer le concept et l’intérêt du bilan carbone dans les processus d’évaluation de projets d’infrastructure, ainsi que d’exposer la méthodologie qui a été utilisé pour la réalisation de l’étude.
Au-delà des objectifs liés à la réalisation de l’étude pour le commanditaire, celle-ci présentait un important intérêt en termes de développement interne dans l’entreprise. Elle a notamment permis de mobiliser des connaissances au sein des différentes entités de SYSTRA et de développer des méthodes et des connaissances pour un type d’étude qui est appelé à se développer dans le futur.
8
2 Les Origines de SYSTRA
Le groupe SYSTRA S.A. est né en 1992 de la fusion des filiales d’ingénierie créées, d’une part, par la SNCF en 1957 (SOFRERAIL, Société d’études et de réalisations ferroviaires) et d’autre part, par la RATP en 1961 (SOFRETU, Société d’études et de réalisations de transports urbains).
A l’origine, ces deux sociétés d’ingénierie ont été conçues l’une et l’autre pour diffuser le savoir-faire de leurs maisons-mères sur les marchés extérieurs et apporter une assistance technique aux réseaux étrangers qui le souhaitaient. Leur travail portait soit sur la modernisation ou la réhabilitation de lignes existantes, soit pour la création de lignes nouvelles utilisant des technologies de pointe. Elles ont rapidement acquis une reconnaissance internationale, grâce à leur double expérience de concepteur et d’exploitant. La complémentarité de leurs techniques et de leurs ressources humaines, autant que la nécessité pour chacune d’acquérir une dimension internationale suffisante par le volume de leur chiffre d’affaires pour rejoindre la classe des grandes ingénieries, a amené les deux sociétés à ce rapprochement, mettant ainsi fin à une concurrence tout en conservant la spécificité des cultures techniques respectives : ingénierie des transports urbains et ingénierie ferroviaire et interurbaine.
3 SYSTRA aujourd’hui
Le groupe SYSTRA est un des premiers groupes internationaux d'ingénierie des transports, avec ses six principales filiales : MVA Consultancy au Royaume-Uni, MVA Hong-Kong et Asie, Systra Consulting aux États-Unis, Canarail au Canada, Systra SOTECNI en Italie et Sotec Ingénierie en France (Toulouse).
Le groupe compte environ 1800 salariés pour un chiffre d’affaires consolidé de 226,9 millions d’euros en 2007. Ses activités couvrent toutes les compétences du domaine des transports urbains et ferroviaires : train à grande vitesse, tramway, transport combiné, ferroviaire conventionnel de fret et de voyageurs, dessertes de banlieue, réseaux express régionaux, métro, bus à haut niveau de service (BHNS), systèmes guidés automatiques, systèmes routiers guidés.
Systra intervient à tous les stades de la mise en œuvre d’un projet, de la conception à la réalisation et compte 50 ans d’expérience dans plus de 140 pays et 350 villes. Parmi ses principales références, on peut citer :
• Les métros de Mexico, Santiago du Chili, Caracas, Le Caire, Alger, Manille, Shanghai, Shenzhen, Canton, New Delhi, Bombay, Bangalore…
• Les tramways de Bordeaux, Saint-Etienne, Marseille, Orléans, Rouen, Nice, Nantes, Lille, Toulon, Brest...
• Le tram-train de Mulhouse, de l’île de la Réunion…
• Les systèmes routiers guidés sur pneus à Caen, Rouen, Clermont-Ferrand, Nancy… • Les métros automatiques de Lille, Orlyval, Toulouse, Rennes, Taipei, Dubaï, Turin,
9
• Les liaisons à grande vitesse Londres-Tunnel sous la Manche, Corée, Taiwan…
• La réorganisation ou création de lignes ferroviaires au Vietnam, au Monténégro, en Bulgarie, en Pologne, au Venezuela…
• Les plans de transport du Caire, de Tunis, Belgrade, Pékin, de Bahreïn…
Mon stage s’est déroulé au sein de Systra Conseil qui s’appelait Planification des Transports jusqu’au mois d’avril 2009. Avant cette période le département était rattaché à la direction de l’ingénierie au même titre que les départements Génie Civil et Ouvrages d’Art (GCOA), Equipements et Systèmes de Transport (EST) et management de projets.
Figure 1 Organigramme du Groupe SYSTRA S.A
Source : SYSTRA
Quatre régions complètent cette organisation matricielle : ¾ La région Amériques, Moyen-Orient, Afrique (AMA) ; ¾ La région Asie Pacifique (APA)
¾ La région Europe ; La région France. ¾
10
Introduction
ans un contexte de changement climatique et d’augmentation de la mobilité, ainsi que de contraintes budgétaires croissantes, les projets respectant les piliers du développement durable (économique, social et environnemental) semblent devoir être privilégiés. Le développement du réseau ferré à grande vitesse a souvent été présenté par les pouvoirs publics comme un moyen de promouvoir un mode de transport performant et durable. Le TGV est notamment considéré comme ayant un meilleur impact environnemental que les modes routiers et aériens. Le projet de réalisation de 2000 kilomètres de lignes à grande vitesse à l’horizon 2020 dans le cadre du Grenelle de l’environnement en est une bonne illustration.
La décision d’investir dans une infrastructure à grande vitesse est une décision qui peut avoir des conséquences importantes en termes d’aménagement du territoire et d’utilisation des ressources publiques. Il faut également rappeler qu’une ligne à grande vitesse, dans l’absolu, a un impact environnemental négatif. Les oppositions récentes des écologistes, les coûts élevés de la grande vitesse, ou encore l’expérience mitigée de la grande vitesse sur certains territoires ont montré que les résultats et les avantages supposés de la grande vitesse ferroviaire doivent être analysés avec attention. D’autre part, pour définir les choix qui doivent être faits dans le cadre d’un développement durable, il ne suffit pas de lister les avantages ou les coûts supposés de la grande vitesse. Ces éléments doivent être mesurés en comparaison d’autres scénarios ou choix possibles.
Dans ce cadre, on peut se demander dans quelle mesure la grande vitesse ferroviaire peut apporter une contribution au développement durable, et dans quelle mesure elle constitue une alternative préférable aux modes routiers ou aériens concurrents.
Afin de répondre à cette question, la méthode utilisée consistera en une analyse multicritère selon les trois piliers du développement durable du transport ferroviaire à grande vitesse, du transport routier et du transport aérien. L’analyse devra dans la mesure du possible se baser sur des comparaisons internationales pour décontextualiser l’analyse. Après avoir exposé la problématique de la grande vitesse et des transports dans le cadre du développement durable, l’analyse portera successivement sur les trois piliers du développement durable : l’environnement, l’économie et les aspects sociaux.
Dans une deuxième partie, la présentation d’une méthodologie de bilan carbone permettra de comprendre le fonctionnement de ce nouvel outil d’évaluation des projets de transport, ainsi que son intérêt dans le cadre du développement durable et ses éventuelles limites pour l’analyse.
11
High Speed Rail and Sustainable
Development
s it was ignored by most of people two decades ago, the concept of sustainable development has taken an important place in public debates and communication of enterprises. Nevertheless, its application in concrete policies is less obvious. Thus it is important to understand what is a sustainable development, and to what extent it has implications in transportation policies and high speed rail development.
1 High Speed Rail Definition
First, it must be noted that this study only deals with “classical” High Speed Rail” operated on rail tracks. Magnetic Levitation Systems (MAGLEV) are not considered here because of their little development over the world.
Contrary to popular belief, giving a clear definition of what is High Speed Rail has proved to be a complicated exercise. The most common idea is that High Speed Rail can be defined as trains operating at very high speed thanks to technical specificities from both tracks and rolling stock. High Speed Rail, according to this general acceptance can be defined as a maximum speed of at least 250 km/h (this figure can be very different from a country to another). Nevertheless this definition doesn’t allow understanding major differences in High Speed services related to variable commercial speed, or differences in operating with conventional rail.
Indeed, commercial speed on High Speed Lines can be far lower than the maximum speed that can be reached on it according to several factors:
• In many cases, trains are operating on conventional rail segments
• Speed can be limited for safety reasons (near urban areas, or on viaducts and in tunnels) • Commercial speed is closely related to the number of served stations.
According to these elements, High Speed Lines functions and performances can be completely different. High Speed Rail development worldwide has shown that its concept could be adapted to various local contexts. A comprehensive definition was developed by the UIC with the following requirements:
• High Speed means operations with maximum speed over 250 km/h
• Special trains that differ from conventional rolling stock by an increased power/weight ratios and several characteristics, such as aerodynamics, reliability, safety, etc.
• Special dedicated lines which can sustain operations over 220 km/h1
• Upgraded conventional lines that enable to operate up to 220 km/h
1 Speed around 200-220 km/h are considered to be the threshold between conventional and high speed rail
12
• A special in cab signaling system, since traditional line side signals are inefficient over 200 km/h
These technical characteristics are broad enough to define the different lines over the world. But more than a specific transport mode, High Speed Rail has to be addressed as a complex system with the following components that differ from conventional railways:
• Infrastructure • Rolling Stock • Signalling Systems • Maintenance Systems • Management • Station Emplacement • Operation Rules • Marketing • Financing • …
In a customer oriented approach, High Speed Rail can be seen as a service more than a technical system. From this point of view, using High Speed Rail refers to several performance indicators, such as commercial speed, frequency, accessibility, comfort, “freedom”; total time travel; price, safety, etc.
2 High speed Rail Development worldwide
Early developments of High Speed Rail took place in Japan in 1964 with the launch of the first “Shinkansen” line that linked Tokyo to Osaka. Important expansion of the High Speed Line network has followed and today Shinkansen network represent 2 304km.
The second high speed line to be launched was inaugurated in Europe for the Rome – Firenze line in 1977, followed by the “LGV Sud Est” in France in 1981. Europe had to become the main contributor to High Speed Rail development in the following decades.
Today, most of the high speed rail network is located in Europe and Japan but it also had development in other countries such as South Korea, Taïwan and China At the beginning of 2008, the worldwide network of lines in operation at 250 km/h or more represented a total of 9 780 kilometers. High Speed Rail is due to have important expansion over the world in the following year with lines in construction or projects in all continents.
The construction of high speed rail networks have complied with 4 main objectives:
• To overcome the limited capacity of conventional railways that were facing a growing demand. This is particularly true for the Shinkansen network but also the KTX network in South Korea and Taiwan.
• To stimulate railway companies that were losing influence on transport markets or that had to prepare to concurrence. This is the case for the introduction of the TGV in France and the German Inter City Express (ICE).
13
• To increase speeds on conventional lines whereas huge investments on infrastructure and use of “classic” material wouldn’t have allow to do so. This reason can mainly be advanced for the Inter City Express (ICE) German network.
• To improve accessibility to remote regions. This is the case for the Sanyo Shinkansen between Osaka and Fukuoka, but also for the AVE line Madrid Seville in Spain.
3 High Speed Rail and Sustainability
3.1 Definition of sustainability
In 1987, a report published by the World Commission on Environment and Development (that was to be called Brundtland report) described sustainable development as a “development that meets the needs of the present without compromising the ability of future generations to satisfy their own needs”. According to the Aalborg Charter, sustainable development aims “to achieve social justice, sustainable economies and environmental sustainability”. This refers to the three pillars of sustainable development that are economics, environment and society.
Numerous interpretations of these definitions have been developed and reflected in political debates. Main approaches of sustainability through its pillars can be described as follow:
• In the fields of economics, sustainability can be seen as an optimal use of resources thanks to efficient markets that enable to improve well being for society. As social fallout in terms of equity comes naturally from optimal allocations in markets, less emphasis has to be made on those problems. Concerning the limits of sustainability due to natural resources two main visions of sustainability exists. Followers of “weak sustainability” explain that scarce resources can be substituted by capital investments. Followers of a “strong sustainability” consider that there is a stock of natural capital that has to be maintained.
• According to ecological aspects, natural resources depletion limits capacities of the environment. In return, it implies limits for economic development.
• Social vision of sustainability emphasizes on distribution of wealth and social inclusion into the economic process that are not to come automatically from economic activity.
3.2 Implications for the transport sector and High Speed Rail
Transport development and acceleration of speed has been one of the driving forces of the evolution of our economic system since the beginning of industrial revolution. As a consequence, it is reckoned that transportation systems have a great importance in economic performance, use of natural resources and social transformations. Thus, transports are often at stake when speaking of sustainable policies. These are some of the implication of the transport sector in Sustainable development:
14
• From an environmental point of view, the increase of mobility, passenger and freight road vehicles, and air transport is designed as to be one of the main contributors to global warming, natural resources depletion and increase in urban annoyances. On the contrary, railways are supposed to offer important advantages compared to air and road transports. Even if its absolute impact on environment is negative, it has been assumed that promotion of modal shift to rail was an effective way to promote environmental sustainability. High Speed Rail as an efficient competitor with air and road transport is supposed to bring many advantages.
• Transports are supposed to support the economic growth by accelerating exchanges. In return, industry, trade and increasing incomes generate traffic and increase use of transport and car ownership. A shadow effect of this mechanism is that traffic increase generates negative external effects (congestion, accidents…) for the Economy. High Speed Rail is supposed to provide both performance to accelerate exchanges and solutions to recede to external effects. On the other hand, supposed benefits of HSR for the Economy have to be balanced by its important costs and the related difficulties to fund it.
• Social aspects of sustainability mainly refer the repartition of economic and environmental fallout of transports to the population. Inclusion of people in the process of sustainable development is a determinant factor to carry out transport policies.
In order to precise those elements, the following multicriteria analysis will compare contribution of the different High Speed Transport systems to the three pillars of development considering different factors.
15
I. High Speed Rail and the Environment
mpacts of human activity on the environment have become gradually an important concern of national and international policies over the last decade. As growing awareness of threats is rising among public opinion, political debates are balanced between the necessity and emergency to take measures and the reluctance to change our economic model.Since our way of life appears to be unsustainable, it raises many issues about transports and the related policies that should be carried out in the forthcoming years. Indeed, increasing mobility and reduction of time travel has been a driving force of growth and the related changes in lifestyles. In return, it also had a spectacular impact on resource depletion, environment changes and pollution. According, to this simple relation, impact of High Speed Transport Systems on the environment could raise many concerns. Nevertheless, characteristics and effects of the different transportation systems on the environment can be very different. Therefore, transport policies orientations will have a dramatic effect on the achievement of a sustainable mobility in the forthcoming years.
High Speed Rail is believed to have a better impact on the environment than its main contenders that are road and air transport. However, High Speed Rail, like all transport modes has shadow effects on the environment such as habitat fragmentation, wildlife damages, pollution and disturbances for inhabited areas. Comparison with other modes for these elements is very dependent of the considered scope, and deep investigations are necessary to draw firm conclusions about High Speed Rail environmental contribution to achieve environmental sustainability. The underlying issue of this reflection can be exposed as follow: is High Speed Rail more environmentally friendly than other transportation systems and to what extent can it bring benefits to make compatible sustainability and high speed mobility?
In order to come up with an answer to those problems, the following topics should be analyzed through a modal comparison of high speed transports:
• The impact of transport on Natural habitat
• The consequences of modes in energy consumption, pollution and global warming • Disturbances for inhabited areas
To give an overall vision of environmental balance of High Speed Rail and the other modes, an evaluation grid will summarize the results of the different elements integrated into the scope of the study.
16
1 Insertion in the environment
Intrusion of transport infrastructure in the environment can have heavy consequences on land intrusion, natural habitat destruction and on ecosystems. Aftermaths for environment are different according to the considered mode of transport.
1.1 Impacts on Natural Habitat
Transport infrastructure impacts on ecosystems correspond to different mechanisms that have to be understood in order to assess possible implications for natural habitats. The range of the possible effects varies with land occupancy.
The ecological network is a concept based on the assumption that it is vital to (re)establish interconnectivity between natural and semi-natural values to counteract physical fragmentation, which is a result of a strong intensification of land use over the last decades. This fragmentation threatens the viability of ecosystems and species populations and thus is threatening nature and biodiversity.
Habitat fragmentation is designed as the major cause of biodiversity depletion at international scale (Convention on Biological Diversity, Rio 1992). The habitat segmentation process causes cascade of adverse effects like: loss of biotope, parceling due to barrier effect and reduction in habitat quality. Habitat fragmentation mainly affects biodiversity by reduction in the amount of available habitat for plants and animals. Plants and other sessile organisms are usually directly destroyed around the infrastructure areas. Mobile animals (especially birds and mammals) retreat into remnant patches of habitat leading to crowding effects and increased competition. Area is the primary determinant of the number of species in a fragment. The minimal area for species is defined by access to food resources, breeding site and undisturbed area. The minimal area for a common hare is 30 hectares. When hare biotope is reduced, the population density automatically depletes. With isolated areas of 30 ha, the population cannot be maintained any more without outside contributions. Furthermore, a degrading effect on one element of the food chain may unhinge the complete ecosystem (or species in interaction with it). This cumulative effect is known as the domino theory.
At a local scale, habitat fragmentation generates additional effects:
• Effects of building up (soil properties modification, microclimatic changes, water permeability alteration),
• Effects of drainage and water logging (fluctuations of water balance, lowering of the water table),
• Effects of pollution from transport (e.g. grease, phytosanitary products, heavy metals, introduction of exotic plant species, etc.). Habitat modification influences the composition of flora (and obviously fauna). This process generally supports ordinary species with the profit of demanding species and replaces indigenous vegetation by disturbance tolerant species.
As impacts are depending on the total amount of land occupied by the infrastructure, it is important to compare it in order to establish modal comparisons.
17
Tableau 1 Land Take by infrastructures
Source: UIC, ADP, BAA
High Speed Rail has a far less important land take than motorways. It must also be noted that parallel routes can make a significant decrease of land take than motorways and high speed rail tracks taken separately. Concerning the comparison with airports, effects on the environment are quite different since it is not a linear infrastructure. It is also very different according to the airport size, but also the local context. Nevertheless many airports have a higher land take than whole high speed lines. For instance a high speed line of 500 km takes 1600 hectares against 2000 for the Lyon Saint Exupéry Airport.
1.2 Impact on the fauna
Thus, High Speed Lines seem to have the less important impact on natural habitat, but also landscape intrusion. Consequences for the fauna also depend on facilities for animal passages. Increasing importance is given to those passages for linear infrastructures. There are no strong differences from this point of view for new High Speed Lines and highways. Advantage of HSL in this domain comes from the fact that most of the motorway network has been built when such considerations were less important.
High speed transportation systems have also an impact on fauna towards accidents and collision. As HSL are fenced collision mainly concern birds and small animals. In the case of motorway, mammals can also be killed. But continuous traffic plays a role of barrier for animals whereas trains are less predictable for them. Collisions with birds are also an important concern for airports. In all these cases, impact on fauna is limited2.
2 According to the DGAC, about 800 collisions with birds are reported each year for all French airports. For the
Madrid Seville a study showed that the annual kill was 36,5 kills/km (57% of birds, 40% mammals and 3% of reptiles and amphibians. It must be noted that important parts of the line was not fenced at that time.
Direct Land Take by Infrastructure
2,5 ha/km 1,3 ha/km
+ Indirect Land Take by Infrastructure
9,3 ha/km 3,2 ha/km International Airports Roissy CDG 3200 ha Heathrow 1117 ha National Airports Orly 1528 ha Gatwick 683 ha Regional Airports Lyon St Ex 2000 ha Nice 370 ha
18
2 Impact on pollution and global warming
The transport sector plays an important role in pollution, resource depletion and global warming. It is the most important contributor to emissions of pollutants gases and substances in the atmosphere. Nevertheless the contribution of the different transport systems to this result is very different.
2.1 Energy consumption
Energy consumption of transport has soared over the last century. Petrol remains the most consumed primary energy in the world and represents 36% of the total energy consumption. Transport sector is the main consumer of petrol with an increasing contribution. In 2002, transport was responsible of 50% of petrol consumption in the world. Road transport is the main responsible of this evolution since it represents 90% of passenger transport and 75% of goods transport in the world. Nevertheless, Air transport consumption has experienced a spectacular increase in energy consumption over the past decades.
Figure 2 Energy Consumption of transports (2001)
Source: IEA, IFP assessment
Comparison of energy efficiency by transport modes reveals that High Speed Rail is the more efficient transport mode, even compared with conventional rail. This can be explain by better load factors and and more important capacity since High Speed Rail energy consumption is significantly higher than for Conventional rail. Plane is the less efficient transport mode, with more than 8 times less passenger kilometers per unit of energy than High Speed Rail.
Of course those figures are deemed to change with technology evolution. New high speed trains have designs that reduce drag and a higher capacity with the use of double deck carriages, as well as lighter materials. All those elements reduce energy consumption of high speed trains (for instance the new AVG of Alstom is supposed to need 15% less energy than a TGV). Concerning cars, a tendency to produce larger and heavier vehicles implies an increase in energy consumption that has to be balanced with technological efforts to increase efficiency of engines. Concerning aviation, use of lighter materials and more aerodynamic designs can reduce energy consumption.
19
Figure 3 Energy efficiency of transports
Source: UIC
Transport modes can also be indirect contributor to energy consumption since they participate to territory structures. Land occupancy and urban sprawl are partly generated by road transport since it enables progressive increase in distances between activities and housing. It is the main factor of energy consumption of territories as shown in the following graph. Cities that have been built later relies more on road transport and have higher energy consumption. On this sense, infrastructures like railways contribute to fix urban structures with positive impacts on energy consumption.
Figure 4 Energy Consumption and urban density
Source: SYSTRA from UITP Millennium Cities Database, 2001
Energy consumption causes resources depletion issues as well at it has a direct relation with air pollution and global warming. Electricity production and transport represent respectively 41% and 21% of CO² emissions over the world. Energy consumption from oil or electricity for transports implies necessarily a production of air pollutants and CO².
20
2.2 Air pollution and Global Warming
Emissions of air pollutants are dominated by road transport, excepted for SOx emissions. Road transport accounted for 46% of total air pollutants emissions in 2004 in Europe. Air and rail emissions are comparatively very limited. Figures show that global emissions of pollutants decreased in the European Union mainly thanks to regulation. But rail transport is the only mode for which all pollutants emissions have decreased between 1994 and 2004. Technical improvements in road transport enabled to reduce every pollutant emissions but CO² emissions because of traffic growth. On the contrary, all air transport emissions increased in the same period. Rail transport contribution to air pollution is comparatively better than this of road and air transport. Regarding these trends, performance comparison of modes has to be made.
2.2.1 Air Pollution
Even if environmental debate often focuses on Global Warming, air pollutants are a main source of concern for both environment and public health. Transports are an important contributor to emissions of acidifying substances, ozone precursors and particulates. Therefore, many policies were carried out that enabled to reduce air pollutant emissions in Europe in spite of increasing traffics.
Air pollutants consequences on environment and health are the following according to the European Environment Agency:
• Acidification of soils and waters because of sulphur oxides, nitrogen oxides and ammonia into the atmosphere with serious impact on ecosystems and materials.
• Formation of ground level ozone because of non methane volatile organic compound (NMVOC), nitrogen oxides (NOX), carbon monoxide (CO) and methane (CH4). This cause
adverse effects on human health and ecosystems.
• Airborne particulate matter (PM) provokes respiratory problems, and is a big issue particularly in important cities.
There is a major difference between emissions from High Speed Rail and road and air transport. Indeed, cars and plane produce air pollutants and CO² with their engine, whereas high speed trains hardly emit pollutants since they are running with electricity3. Thus, high speed rail emissions depend
on the origin of electricity production, and so, on the electricity mix choices that were made by countries.
21
In order to compare the impact of High Speed Rail, car and plane on air pollution, several simulations have been done thanks to the EcoPassenger Tool developed by UIC and IFEU. 3 typical journeys have been chosen to illustrate the diversity of situation of high speed rail operations4.
Figure 5 Comparison of air pollutants emissions for different typical routes in Europe
Paris – Brussels Madrid – Seville Rome – Florence
Trip distance in HSR 421 km 470 km 237 km
Emissions from electricity mix
Low (important part of
nuclear production) Intermediate High (important part of fossil energy)
Load factor 75%
HSR Car Plane HSR Car Plane HSR Car Plane
Energy consumption/pass (HSR base 100) 100 174 322 100 294 394 100 267 467 Nitrogen Oxides/pass (HSR base 100) 100 1858 2294 100 579 559 100 761 916 Particulate Matter/pass (HSR base 100) 100 1198 523 100 276 103 100 312 145 Non Methane Hydrocarbons/pass (HSR base 100) 100 1674 3389 100 1333 1857 100 442 875
Source: EcoPassenger
Results for the different cases are given to the next page. Several conclusions can be made from it: • High Speed Rail emissions are way inferior to those of road and air transport, even with a non
favorable electricity production with the chosen hypothesis.
• Important differences can exist between High Speed Services depending on the used electricity mix. Emissions of a Rome Florence trip are 3,8 times more important for Particulate Matter and Non Methan Hydrocarbons than a Paris Brussels trip, and 2,4 times for Nitrogen Oxides.
4 Load factors for high speed rail and trains are the average load factors that are really observed in reality
22
Figure 6 Energy consumption and air pollution for typical routes in Europe
23
2.3 Global warming
Global warming is believed to be the main cause of climate change at a global scale. Transport as the main contributor of greenhouse gases (with electricity production) are determinant in order to set up new mitigation policies for greenhouse gases pollution. As it appears that technological progresses will not be sufficient to contain the increase in emissions, technological choices in transport policies can be part of a solution. Transport performance in GHG emissions depends on the same factors than air pollutants. In order to assess it, the same examples of typical routes have been chosen to compare the respective impact of transport systems.
Figure 7 CO² emissions for typical routes in Europe
Source: EcoPassenger
According to the EcoPassenger carbon assessment tool, a Paris Bruxelles trip emits 4,2kg of carbon dioxide in Thalys Train against 33,1 kg by car and 59 by plane. On the other hand, emissions for a Rome Florence trip is 12,6 kg of CO² per passenger for high speed rail, 33 for car and 58,3 for plane. This difference in results underlines that carbon emissions for transport closely rely on several factors:
• Load factor assumptions can have an important impact on carbon emissions per passenger kilometer. Load factors for High Speed services are extremely variable (70% for the TGV, and 40% for the ICE) and can be much inferior to those of low priced airlines.
• Energetic mix used plays an important role since it determines the emissions from the electric train power. High speed services in France produce significantly less CO² emissions than in Germany or Italy because of the importance of nuclear energy production. So, it conveyed the idea that TGV was almost a non polluting transport system. Nevertheless, this doesn’t take into account fuel rods extraction and waste storing.
• Feeders can influence total emissions for journeys. Most of the time, car journeys use one mode (door to door), whereas trains and plane journeys need additional transport with car or public transports for instance.
24
Even if substantial differences can be observed for High Speed Rail according to those factors, High Speed operation still emits less CO² than cars or planes. However, this comparison doesn’t take into account several elements, including the impact of construction and the variable impact of modal switch.
3 Impact on habitat and living conditions
Transports have heavy consequences on living condition in inhabited areas. They are a main source of annoyance for people that often complain of this. The main disturbance is noise, but transport causes also specific disturbances.
3.1 Assessment of Noise pollution impact for society
For the last decades, noise has become one of the main concern related to transports in developed countries, especially in large built up areas. It is considered as one of the main sources of pollution and has non negligible impacts on life quality, welfare and even health. Like other transport systems, high speed rail causes noise disturbance and vibrations. In order to assess the impact of high speed rail on noise and vibrations disturbance, it is important to precise the importance of noise burden for population and to understand the effect of noise on health.
3.1.1 People exposure to noise
Noise, as a main factor of pollution, is difficult to assess since it is a perception closely influenced by several factors that can be related to transport modes (noise duration, sound frequency, sound range…) or not (distance of housing with the infrastructure, people sensitivity and opinions…).
Among the factors related to noise sources, duration and frequency play an important role in noise exposure, regardless to the noise level in decibels. A sporadic noise has a rather different effect on people than a constant noise. Hearing systems react differently depending on the frequency strength (“Noise frequency is the number of vibration per second of the air in which the sound is propagating,
and it is measured in Hertz”, WHO)
There is also an obvious relation between noise level and the distance with noise sources. According to the ADEME, each doubling of distance enables to reduce the sound level by 3dB(A) for linear sources of noise such as roads and railways. Several noise sources increase noise level but not as an addition of the respective sound levels. For instance, 2 cars that produce 60dB(A) separately only produce 63dB(A) together (Soberco environment).
Two measures of noise are generally admitted: the maximal noise pressure noted dB(A) that represent the noise perceived instantaneously and the equivalent level LAeq that described a fluctuant noise during a period as equivalent as an instantaneous noise produced with the same energy.
People exposure to noise is extremely variable according to the context in both urban and rural areas. Within the European Union, 80 million of people (22%) are exposed to noise level over 65dB(A) and 8% to levels over 70dB(A) which can have many implications on health and welfare. 45% of Europeans (170 millions) are living in areas without acoustic confort, and 30% are exposed to noise
25
levels over 55dB(A) by night (LAMBERT Jacques, Le bruit en Europe: colloque du conseil national du bruit, Le bruit des transports en Europe: exposition de la population, risques pour la santé et coût
pour la collectivité, INRETS, 2000).
Transport as the main contributor to environmental noise has an important role in noise pollution. Contribution from road, rail and air transport are different, as shown in the following charts. It presents the number of people affected by noise in Europe by mode for cities over 250 000 inhabitants.
Figure 8 People exposure to noise in Europe for cities over 250 000 inhabitants
Source: The European Topic Center Land Use an Spatial Information, 2008
Road noise has an overwhelming importance compared to air and rail transport. In cities over 250 000 inhabitants, 55% of people are exposed to noise over 55dB(A) against less than 5% for rail and less than 3% for air transport. During the night, 17% of people are exposed to road noise over 60dB(A) which can have consequences on health. Nevertheless, importance of the road network and traffic must be taken into account.
Noise pollution from transport and other sources have serious consequences over people condition and social welfare. Those adverse health effects have to be explained in order to understand the impact of transport noise pollution on people
3.1.2 Health adverse effects
Harmful effects of noise over people result from both occupational and environmental noises such as transport noise. They can be mainly described as negative effects on organism, impairment of capacities and psychological reactions. As they are often caused by combined factors, it is difficult to draw firm causal conclusions between a noise source and adverse health effects. Nevertheless, it can be assumed that the transport sector, as a main factor of noise pollution, has impacts on hearing condition.
Several adverse health effect of noise can be defined according to the World Health Organization (WHO):
26
• Noise-induced hearing impairment. According to the WHO, « hearing impairment is typically defined as an increase in the threshold of hearing ». This can be considered as a severe social handicap.
• Interference with Speech Communication
• Sleep disturbance. Environmental noises can lead to difficulties in falling asleep, awakenings and a degraded quality of sleep. This can have serious consequences on health since uninterrupted sleep is necessary for a good physiological and mental condition. Sleep deprivation causes increased blood pressure, increased heart beat, breathing difficulties… • Cardiovascular and physiological effects. People exposed to high level noise for extended
periods have more risks for myocardial infarction. Noise exposure has an impact on hormonal system that cause increased blood pressure, increased heart rate and vasoconstriction.
• Mental health effects. Noise can contribute to mental disorders. This influence can be assessed by several symptoms: headaches, changes in mood, stress, anxiety, nausea, complaints, social conflicts, but also neurosis, psychosis and hysteria.
• Effects of noise on performance. According to the type of noise and the work being done, noise can produce task impairment and increase the number of mistakes (Smith, 1990). Noise can hamper comprehension, reading, problem solving and memory.
• Effects of Noise on Residential Behavior and Annoyance. Noise has an indirect effect on social behavioral. It can make people change their habits (closing window, turning TV and radio to louder levels, complaining to authorities…) or even contribute to worsen neighborhood relations (unfriendliness, residential mobility, drug consumption, accident rates, changes in mood…).
Those effects are difficult to quantify since they can have many origins. Some people such as children or older people with hearing impairment are more vulnerable for instance. Moreover, they do not really enable to make a sharp difference between discomfort and health condition reactions. The following chart presents several thresholds for harmful effects. They correspond to noise levels in dB but they also depend on the different aspects of noise that were previously described (noise frequency, duration…). Nevertheless, it seems that physiological risks threshold is reached for prolonged exposure to noise Levels of about 65-70dB.
Figure 9 Noise consequences for Health
27
3.2 Transport modes contribution to noise pollution
Noises generated by transport can have many characteristics depending on interactions between transport modes and their environment and are constantly changing as a result. Effects of noise emissions are closely related to those differences. In order to understand the contribution of transport modes to noise burden for people, it is important to explain how they generate noise and the difference between the different modes.
3.2.1 Different noises for different transports
Transport contribution to noise pollution is extremely variable according to transport modes. As shown in the following table, noise levels reached for air, road and rail transport are very different but they are all strong enough to possibly have a significant impact on health. Figures show that air transport is the noisiest, followed by rail and road transport. Nevertheless, they are measured close to noise sources. Frequencies of traffic and distances are to be taken into account. For instance noise emissions close to a busy highway is about 80dB(A), but it is about 65dB(A) 180 meters away from a highway with an average traffic.
Tableau 2 Daily Noises
Noise sources Acoustic pressure (dBA)
Normal talking (indoor) 45-55
Idling car, at 7,5m 45-55 Car, 50km/h, at 7,5m 60-80 Heavy truck, 50km/h, at 7,5m 80-95 Motorcycle, 50km/h, at 7,5m 75-100 Boeing 737 in flight at 5km 85 Freight train, 100km/h, at 7,5m 95-100 TGV Duplex, 250km/h, at 25m 88 TGV Duplex 300km/h, at 25m 92
Jet Plane Taking off over 100 tons, at 100m 110-115
Possible hearing traumatism > 120
Source : STANNERS, BOURDEAU., L’environnement de l’Europe, l’évaluation de Dobris,
Edition Earthscan, NOEMIE, DGAC
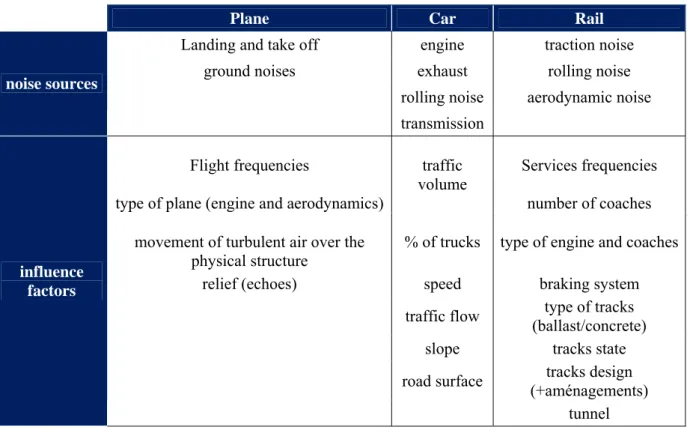
Road traffic can be considered as a constant noise (even if traffic flows change according to the hour), whereas train and plane noises are sporadic noises. Thus, people perception for the different modes is different regardless to the noise level. More generally, impact of noise emissions from air, road and rail transport depends on the way those modes generate noise. The following table gives a list of noise sources and influencing factors of noise for air, road and rail.
28
Tableau 3 Transport noise sources and influencing factors
Plane Car Rail
Landing and take off engine traction noise
ground noises exhaust rolling noise
rolling noise aerodynamic noise
noise sources
transmission
Flight frequencies
type of plane (engine and aerodynamics)
traffic volume
Services frequencies number of coaches movement of turbulent air over the
physical structure
% of trucks type of engine and coaches
relief (echoes) speed braking system
traffic flow (ballast/concrete) type of tracks
slope tracks state
road surface (+aménagements) tracks design influence
factors
tunnel
Plane noise emissions are mainly generated during landing and taking off. So concerned people are located nearby airports and along land and take off corridors. Ground noises such as taxiing aircraft, engine tests and transport links to the airport are also experienced by people living close to very large airports. Air noise is mainly influenced by flight frequencies and characteristics of aircrafts (engine and aerodynamics). As air noise spreads over large areas, relief can also have an impact (echoes in the mountains for instance).
Road noise is generated by running engine and transmission, exhaust and contact between tires and road surface. Under 50km/h, mechanical noises (engine, transmissions and exhaust) are dominant, but for higher speeds, rolling noise prevails. It is dominated by low frequency noises. Traffic characteristics (volume, speed, and congestion) have an important impact, but the type of vehicles is also at stake. Trucks are noisier than cars especially for mechanical noises which are very important in urban area. The following charts shows that in urban areas, at 50km/h, car noise emissions represent less than 50% of road noises whereas they count for nearly 85% of the fleet share. Road surface (mainly the type of used concrete) can have a substantial impact on noise emission level.
Rail noise is caused by traction, rolling and aerodynamics. Traction noise is generated by engine and auxiliary equipments such as compressors, generators or ventilation. Rolling noise is generated by contact between rails and the wheels, but also some echoes from some structure elements, such as metallic bridges. The importance of these sources depends on speed as shown in the following chart. Under 50 km/h, traction noise is dominant, then rolling noise is more important. Aerodynamics prevails for speed over 300km/h (so it is specific to high speed trains). Other noise sources can exist like curve squeal or brake screech that are very annoying for people because they have high frequencies (whereas other rail noises are mostly low frequency noises).
29
Figure 10 Eurostar Noise: Variation with Speed
Source : ARUP
Factors that can influence noise emissions are affected by services, train types and equipments, and also track design and environment. Frequency of services increases the occurrence of noise events. Traction noise is more important for diesel trains than for electric trains and the number of coaches increases noise emissions as well. Cast iron tread braked wheels have a higer surface roughness and are noisier than disk braked wheels. Rail pad stiffness affects rolling noise too. Concrete slab tracks are noisier than ballast tracks. Beside noise emissions, other effects are experienced such as ground vibrations and sonic booms outside tunnels. Sonic booms are waves propagating at tunnel exits that can be strong enough to disturb people in urban areas (by rattling windows for instance).
Differences in noise emissions induce a different perception for exposed people. Annoyance from transport noise does not impact the same activities with the same importance according to the transport mode.
3.2.2 Rail noise advantage over other modes
Recent studies comparing annoyance for transport systems revealed that rail noises are less annoying than road and air noises with identical sound levels. Explanations for this result are to be found both in acoustic and non acoustic factors.
30
Figure 11 Transport mode annoyance differential
Source: UIC
Non acoustic factors are paramount in people reaction toward transport noise:
• People situation (for instance in housing protected by double glazing) change noise exposure regardless to noise source strength and distance.
• Individual factors impact people perception (age, dependency toward transports, noise sensitivity, fear of transports…).
• Social factors that design social groups’ behavior toward noise (expectations, protests, life style…).
For instance, fear of air crashes may increase people’s sensitivity to aircraft noise, as well as fear of flight increase in the future.
Acoustic factors also explain a preference for rail noises. Nevertheless, it depends on the period of time (day or night), of the sound level and of the kind of annoyance considered (hampered activities or behavior annoyance). Rail advantage increases with the sound level. It is more important by night than by day, and in urban areas compared to rural areas. One of the main explanations is that rail traffic is more regular and predictable than road traffic, especially by night. On the contrary, rail sound seems to be slightly more annoying than road noise for outdoor leisure or talking because train passages can last long.
3.3 Solutions to contain noise burden
Transport noise influence over health has led to research implementation to contain it. Several solutions exist to reduce noise emissions for each mode of transport .
31
3.3.1 Possible implementations per mode
Up to now, noise evolution in transport has been characterized by two opposing trends: increasing traffics, and nominal reduction in noise emissions from planes, cars and trains. Transport trends indicate that traffics should still increase in the forthcoming years, making noise problems worse. In this context, solutions to contain noise community concern are being developed for each transport system, but noise decrease potentials are different. The following tables give the main solutions for each mode.
Tableau 4 Possible implementations to reduce transport noise
plane car rail
1) reducing noise at source : 1) reducing noise at source 1) traffic planning aircraft technology (engine and
aerodynamics) car technology (exhaust, engine…) speed restrictions 2) land use planning quieter tyres rerouting of trains planning permission 2) maintenance and control retiming of trains zoning land 3) quieter road surface 2) land use planning 3) changes to operationnal
procedures 4) noise barriers 3) technical measures at sources noise preferential routes 5) traffic regulation use of vehicles with smooth wheels managing thrust speed restriction rail tuned absorbers concentrating/sharing noise trucks forbidding low noise locomotive
steeper descent angles 4) noise barriers
ways of improvement
5) maintenance
Decrease in aircrafts noise emissions has been impressive. Today, noise level along runways is about 9 times inferior than in the 70’s. The surface exposed to 85 dB(A) is 2,2 km² for an Airbus A320, whereas it was 7 km² for a Douglas DC10. Nevertheless, it did not compensate for the sharp and constant increase in air traffic. Attempts to reduce air noise focused on engine and aerodynamics with great achievements but today, technological solutions to reduce noise at source appears to be more limited. Thus other solutions to enhance the situation mainly consist in managing land use areas (forbid construction in the most exposed areas, provide insulation) and in changing operational procedures (pilots should use throttle so that they limit engine noise during take off, or choose steeper descent angles for landing to shorten landing distances over dense areas). These measures appear to be difficult to set up with the increasing aerial traffic and population.
Road transport noise also increased in the past decades in spite of substantial reduction on engine noise (about 8dB(A) for cars and 11dB(A) for trucks according to HEIFERT Helmut, bruit de la
circulation routière: nouvelles connaissances et possibilities de reduction, l’actualité des routes en
béton, 2006), exhaust and tires. In addition to these improvements, significant noise reduction can be obtained for rolling noise by using quieter concrete surfaces. Noise barriers, speed limitation and access restrictions for noisy vehicles can be used to protect people in exposed areas.
32
Many noise mitigation methods are being developed for railways. The European Union carried out works on evaluating ways to reduce noise for rail, air and road transport within the framework of working groups and the Environmental Noise Directive. UIC evaluated those measures :
• Solutions from operation such as reduction of speed or redirection of traffic redirection are not really compatible with a performant transport system, especially for High Speed Rail. On top of that, noise level for a day is quite insensitive to small decreases of train passages.
• Land use planning to separate railway and new infrastructure in residential areas would be difficult to introduce.
• Some of the most efficient measures consist in having a smoother contact between rail and wheels to reduce rolling noise. Several technical implementations are possible to achieve this goal. Use of disk braked wheels that are smoother, and so quieter than cast iron breaked wheels should emit 10 dB(A) less. During maintenance operations, rail grinding can make a smoother rolling contact, especially with smooth wheels. Other techniques include wheels treatment and lubrication or use of steerable axes that can help to eliminate curve squeals. • Use of dampers should reduce rolling noise. It has been assessed that tuned absorbers attached
to wheel and rails should reduce noise total rolling noise respectively to 2 and 3 dB(A). • Use of sound barriers is a traditional solution to protect environment from noise. New lineside
noise barriers that absorb noise are more efficient thant reflective barriers. Secondary glazing can be fitted to buildings. Tunnel can also isolate housing from noise emissions even if it is an expansive solution. A more original solution consists in using bogie shrouds on the rolling stock associated with low height barriers along the track.
• Improvements in locomotive sound emissions are mainly efficient for low speed when engine noise dominate.
So, in spite of the increase in traffic volumes, rail seems to have many possibilities to reduce or at least contain noise burden for people.
33
Japan example
As the first country to introduce high speed rails, Japan early took measures to tackle noise pollution resulting from Shinkansen railways. In 1975, the Environment Agency established new environmental standards directive for High speed services. It fixed a limit for noise level at 70dB(A) for residential areas and 75dB(A) for areas with common industrial and commercial activities, and a clear methodology for measurement was created. The directive granted railways a period of time to comply with these new standards. Then railways adopted solutions to reduce noise that proved to be efficient, as shown in the following charts.
Figure 12 Relative importance of Shinkansen noise sources and reuslts of noise
countermeasures
Source : Japan Railway & Transport Review, December 1999
As speed increased with new Shinkansen trains, noise levels augmented at some periods and noise sources contribution changed. Specific measured was adopted and in 1997, Shinkansen trains were quieter than those in 1982. Specific attention to aerodynamics and pantograph noise contributed to contain noise in spite of the speed. Spark noise and concrete structure noise almost disappeared.34
3.4 Particular disturbances due to High Speed Rail
High speed rail produces several disturbances in the vicinity of inhabited areas that are particular to rail transport or even to high speed operations. Nevertheless their impact is not a main concern as mitigation measures exists.
3.4.1 Vibrations
Trains provoke vibrations around rail tracks by impact of the axles on it. Vibrations are caused by the kinetic energy created by those impacts and increase with the speed of train and the weight of axles. Several influence factors can be described:
• Suspension system on the train can absorb more or less of the vibration energy. • Interaction between rail and axles depends on the rail irregularities and grinding.
• Rail tracks rigidity since their deformation depends on the vibrating soil characteristics. For instance, more rigid slab track generate less vibrations than ballasted tracks.
Vibrations generated by trains are composed of two elements:
• Repeated pulses that correspond to the repeated impact of axles on the tracks. This corresponds to high frequency vibrations (30Hz to 80Hz) and represents the maximum peak in vibrations that is transmitted mainly near the tracks.
• A continuous vibration that corresponds to track deformations. This generated low frequency vibrations (< 10Hz) and depends on the train speed and length. The energy created by this source of vibration is low.
As a consequence, vibrations generated by high speed rail are more important than for conventional passenger trains but inferior to those of freight trains. It mainly represents annoyance risks even if physical damages at very close distance to tracks.
3.4.2 Sonic booms
Japanese experience also enabled to point out specific disturbance sources such as sonic booms generated by high speed trains passing through long tunnel on slab track (ballasted tracks generate less vibrations). This problem was first discovered in 1975 with the San’yo Shinkansen trial runs that resulted in protest from residents nearby the track. The sound explosion is caused by compression waves expulsed from tunnel exits. When a high speed train enters a tunnel, sound waves propagate through the tunnel at the speed of sound and are then expulsed at tunnel exit strongly enough to provoke vibrations at doors and windows. Several solutions were found to solve this problem such as tunnel portal hood to reduce the pression wave, shelters with slits between adjacent tunnels, inclined or vertical shafts to bypass compression waves, or aerodynamic nose shapes fo trains to minimize micropressure waves. Outside Japan, sonic boom problems have also been encountered in Germany for the construction of two tunnels on the Nuremberg-Ingolstadt line where solutions from Japanese experience has been applied.