HAL Id: hal-01879564
https://hal.archives-ouvertes.fr/hal-01879564
Submitted on 24 Sep 2018
HAL is a multi-disciplinary open access archive for the deposit and dissemination of sci-entific research documents, whether they are pub-lished or not. The documents may come from teaching and research institutions in France or abroad, or from public or private research centers.
L’archive ouverte pluridisciplinaire HAL, est destinée au dépôt et à la diffusion de documents scientifiques de niveau recherche, publiés ou non, émanant des établissements d’enseignement et de recherche français ou étrangers, des laboratoires publics ou privés.
Evaluation of the LoRa® technology and assessment of
its relevance in optimal district heating management
Mohamed Mabrouk, Pierrick Haurant, Laurent Toutain, Bruno Lacarrière
To cite this version:
Mohamed Mabrouk, Pierrick Haurant, Laurent Toutain, Bruno Lacarrière. Evaluation of the LoRa® technology and assessment of its relevance in optimal district heating management. ECOS 2018 - 31st International Conference on Efficiency, Cost, Optimization, Simulation and Environmental Impact of Energy Systems, Jun 2018, Guimaraes, Portugal. �hal-01879564�
Evaluation of the LoRa® technology and
assessment of its relevance in optimal district
heating management
Mohamed Tahar Mabrouk a, Pierrick Hauranta, Laurent Toutainb, Bruno
Lacarrièrea
a IMT Atlantique, Department of Energy Systems and Environment, GEPEA, F-44307 Nantes, France, mohamed-tahar.mabrouk@imt-atlantique.fr
b IMT Atlantique, Department of Energy Systems and Environment, GEPEA, F-44307 Nantes, France, pierrick.haurant@imt-atlantique.fr
c IMT Atlantique, IRISA, 2 rue de la Châtaigneraie, 35576 Cesson Sevigné, France, laurent.toutain@imt-atlantique.fr
d IMT Atlantique, Department of Energy Systems and Environment, GEPEA, F-44307 Nantes, France, bruno.lacarriere@imt-atlantique.fr
Abstract:
One of the more promising paths towards integrating new and renewable energy sources and enhancing the efficiency of energy systems is deploying more smart and interconnected energy networks with distributed energy generation. This is the case of district heating networks which are becoming more decentralized and where consumers are becoming prosumers. In such 4th generation heat networks a suitable management of the generation facilities is essential to optimize cost and environmental impact. The decision making requires a complete vision on the state of the grid at each instant. For this purpose, communication solutions are vital tools to exchange information from and towards substations. Technologies like LoRa® and SIGFOX are suitable candidates especially when renovating existent networks. These solutions are already used for many applications related to the Internet of Things (IoT) and require in-depth study of their suitability for monitoring district heating networks.
In this paper, we focused on Lora® technology which has the strength of being easy to deploy at low cost and in an unlicensed band but has, in the same time, some limitations like duty cycle and transmission losses. At a first stage, fundamental concepts of LoRa technology are introduced. The limitations of this technology are also recalled and taken into account to simulate the transmission losses of measurements when using LoRa. In a second step, the modelling tool HeatGrid is used to simulate the optimal management of a district heating network using such altered or incomplete information. HeatGrid is a pseudo-dynamic model based on oriented graph formalism and linear programming that simulates optimal use of multi-sources district heating. The tool optimizes heat production mix at each time step by minimizing exploitation costs. This approach enables to test the potential of LoRa® technology in optimal management of heat sources.
Keywords:
Smart Heat Grid, Information and Communication Technologies, Signal transmission, DH modelling and optimization, LoRa®
1. Introduction
The development of new low energy or positive energy buildings and the enhancement of the efficiency of all the components of district heating networks makes the cities’ heat density decrease [1]. Consequently, the interest and competitiveness of conventional district heating systems tends to decrease [2,3]. The development of 4th generation district heating (4GDH) is an answer for these evolutions. This new generation is characterized by lower temperatures, massive integrations of renewable energy systems and storage, and a ‘smart’ dimension [4].
The use of low temperatures in district heating follows the historical trend [4,5]. They are more efficient and can supply heat to lower heat density area [6,7]. For example, low temperatures district heating working with temperatures of 60°C allows thermal losses of 75 % less than standard district heating [5]. Besides, using low temperature levels in district heating systems permits a diversification of heat sources and allows connecting low temperature renewable heat production units with lower operating costs. Finally, the densification of urban centers and the possibility to increase network’s heat density by connecting low energy buildings makes the low temperature district heating more competitive.
The ‘smart’ dimension of 4GDH is reflected by new strategies of planning and control. These strategies aim to manage the peak loads and the shifts between production and consumption. They also aim to optimize the use of production and storage capacities. The idea is to develop new tools for improving the district heating efficiency, allowing a massive integration of renewables and intermittent heat units to be done as well as the synchronization between heat demand and production. In that view, possible actions are numerous: the thermal inertia of buildings or the thermal inertia of the district heating network itself can be used to smooth the demand [8-10]. Storage units can be implemented as buffers to shift production and demand [11-15]. The distribution of heat can be improved by calculating and supplying exactly the amount of energy needed to fit the demand. In that case, the demand variations have to be anticipated thanks to demand forecast [12] or indirectly thanks to weather forecast [4]. In addition, usual control strategies that are based on control curves which link the heat consumption to the inside and/or outside temperatures can be improved [16-20].
Smart making is a holistic approach that aims to increase the efficiency of a global process by managing and controlling the interactions between all its sub-systems. This approach is particularly adapted to energy systems and is now possible thanks to:
▪ new decentralized energy systems development
▪ new technological advances (Information and communication technologies, renewable energy systems, Storage);
▪ new control algorithms development;
▪ the advent of new energy strategy and planning policies that take care of sustainability.
The development of smart grids started with electrical networks, since early 2000. It allows a massive integration of distributed renewable energy systems to the electrical networks. Which were traditionally supplied by centralized and totally controllable productions systems through unidirectional energetic flow. Smart grids permit the integration of smaller intermittent production utilities, in multilateral and bidirectional energetic flows. In that way, demand and storage can be managed to make smart grids more flexible and reliable [21]. In the same way as electrical networks, district heating smart networks should enable a more proactive interaction between connected users (producers, consumers or prosumers), in order to supply sustainable, cheap and reliable energy [22]. Measured based control and management is a key concept for making energy grids smarter. It needs the implementation of information and communication technologies (ICT). Used solutions must guarantee interoperability between the sub-systems of the system and privacy of data. The bidirectional information throughput must be high to insure a real time or quasi real time control and a high quality service [23-25].
Concerning district heating, the ICT is applied in some cases for smart metering or demand management [26,27]. They are also used to synchronize production and consumption, particularly in case of high penetration rate of fatal production unities. However, a more global and systematic use of ICT is required for a fine control of the systems that tends to a usage close to smart grids.
The lack of ICT infrastructure in current district heating systems [28] and the high cost of some technologies remain obstacles for their massive deployment. However, the last advances of new low energy and low cost wireless technologies that need only basic infrastructure permit envisaging an internet of energy [22] : an equivalent to internet of things turned to the energy networks [28]. Güngör [29] see in the development of smart energy grids an important opportunity of wireless ICT development. However wireless ICTs have some limitations regarding their throughput and their non-negligible transmission losses. The aim of this work is to assess the impacts of these limitations on district heating functioning and how it can affect the energy efficient of these systems in the management of the different production plants. LoRa technology seems to be a suitable candidate for DH monitoring and management because of its low cost infrastructure and modest subscription.
Besides, the very low power consumption of this technology make it possible to use terminals with very long battery lifetime.
2. Constraints in using LoRa® technology
Regarding the implementation of LoRa technology to district heating systems, the aim is to transmit the power demands of each substation in a real time fashion in order to optimize heat production. In this paper, we will consider a DH networks monitoring system which collects the energy consumption at the primary side of each substation and send it to a centralized management system. In this case, the messages transmitted from each substation will contain three measurements: the inlet and outlet temperatures (respectively Tin(t) and Tout(t)) and the mass flow ṁ(t) in the primary circuit. These data
will allow calculating the power demand Pd(t) :
Pd(t) = ṁ(𝑡)(Tin(t) − Tout(t)) (1)
Sending such a set of measures cost 12 bytes whereas 2 to 13 bytes of non-mandatory information about the transmitted packet can be added to the message (Table 1).
Table 1. Contents of transmitted messages
Information Size Comments
Identification 2 to 4 bytes
Time 4 bytes With a resolution of 1 second - Facultative
Acknowledgment of receipt 5 bytes Non-mandatory
Data 4 bytes/measure
12 bytes/object
Good resolution Can be optimized Total 2 to 13 bytes of transmission information
12 bytes de mesures
LoRa® Transmission capacities
LoRa technology is a long range radio communication technology with a low energy consumption. It is based on a simple channel hopping communication model. It simplifies the network architecture and allows a massive deployment and is low-cost. Due to its characteristics this technology seems well adapted to the challenges of district heating smart making.
Legal duty cycle
LoRa® is limited by a duty cycle, which means that each device must be silent after each transmission for a minimum period 𝑇𝑠. This period is a function of the duty cycle denoted by 𝑑, the transmission time, known as Time On Air, denoted by 𝑇𝑎 as shown by eq. 2 [30]:
𝑇𝑠= Ta(
1 𝑑− 1)
(2) The maximum duty cycle of the EU 868 ISM band is legally fixed to 1% which results in a maximum transmission time of 36 s/h in each for each device [30].
Collision effect, capture effect and transmission losses
When multiple terminals try to transmit packets to the same base station simultaneously it is assumed by default that all transmitted signals fail to be received due to the collusion. However, capture effect may take place [31]. In fact, the strongest received signal may be successfully received despite the presence of interfering signals. The difference in power levels of signals is a result of propagation phenomena such as near-far effect shadowing and fading.
For this reason, the more often terminals transmit packets the more these packets are likely to be lost. This phenomenon is quantified by a normalized load defined by [32]:
𝐿 = 𝑝𝜆𝑚 𝜆𝑏
(3)
Where 𝜆𝑚 is the density of terminals, 𝜆𝑏 is the density of base stations and 𝑝 is the transmission probability of each terminal. This probability can be seen simply as the ratio of emission time over the total time which is in our case equal to the duty cycle 𝑑. A recent study shows that networks using macro diversity capability and in pure ALOHA must stay below a normalized load level of 15% per sub-channel in order to keep the loss rate below 10%. LoRa networks use generally 3 sub-channels which rises this load ratio to 45% [32].
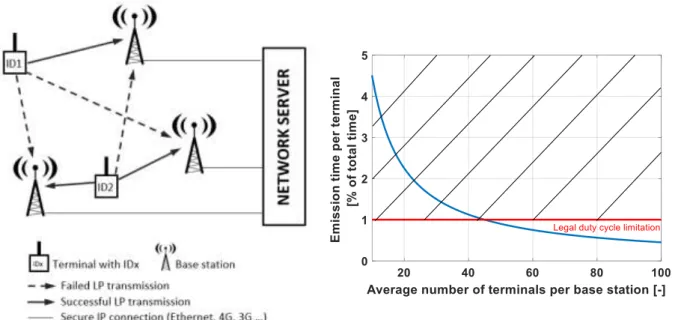
Fig. 1 shows the emission time per terminal as a function of the average number of terminals per base station. It demonstrates that if this number of terminals is higher than 45, the emission rate is more constrained by the network losses than by the legal duty cycle limitation.
Fig.1. LoRaWAN network architecture with Macro Reception Diversity transmission
technique
Fig. 2. Allowed emission time per terminal to limit transmission losses to 10%
3. Methodology
In this paper, we consider that the DH grid is monitored by sensors that measure the mass flow rate, the inlet temperature and the outlet temperature at the primary side of each substation’s heat exchanger. The measurements are then transmitted by terminals in each substation using LoRa technologies to base stations which are connected to a centralized management system by a secure IP connection. Terminals use macro diversity method to send packets to the base stations as described in [32].
DH networks modelling and optimization
DH modelling using demand time-series at each substation and optimization of the distributed energy production are two tools used in this work to compare the optimal energy production at the different utilities with and without losses when transmitting the monitored heating demands from the substations to the centralized management system.
HeatGrid is a tool for simulation and optimization tool of the district heating grids [33,34]. It has been used here as an emulator of district heating. It is a pseudo dynamic tool which can simulate the optimal
time behaviour of multi-source district heating of any dimension, from request signals implemented as input. It is based on the formalism of oriented graphs where the nodes are consumers, prosumers or sources and the edges represent pipes. Sub models are implemented to calculate temperatures and flow rates in the network and to model the heat generation and storage of energy systems. This tool optimizes energy generation in the network based on the linear programming formalism (LP). It enables to calculate the optimal energy mix that minimizes the operational cost.
4. Case study
The aim here is to consider a network topography in which a lack of information would have an impact on the strategic choices of the energy production units. A district heating with a backup that supplies extra heat to a consumer located at the end of the network can illustrate this issue. Indeed, the loss of information can have a consequence on the use of the backup system: it can be maintained turned on when there is no need and on the opposite turned off when there is need.
In this context, a synthetic realistic district heating topology has been implemented (Fig. 3). It is composed by 4 consumer nodes supplied by three heat productions units (Tab. 2): two head units (Node N1 and N2) and an additional unit as backup (Node N6). This backup is turned on when needed
to provide heat at node N7, a huge consumer at the end of the district heating network.
Table 2. Types, capacities and cost of generation units
Node Energy source Capacity [MW] Cost [€/kW]
N1 Biomass 7 0.01
N2 Gas 30 0.04
N6 Gas 27 0.05
Fig.3. Topology of the district heating network
The heating demands of the consumption nodes N3, N4 and N5 are those of the district heating of
Malakoff in Nantes, France. The hourly profiles Pdh(t) have been obtained from monthly
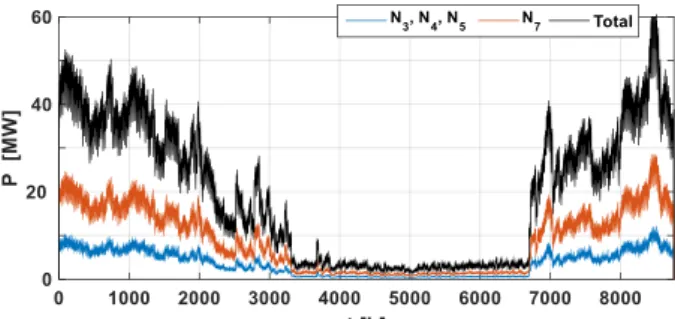
measurements given by the operator, disaggregated with heating degree-days [35]. The demand at node N7 is 2.5 times higher than those at the other nodes (Fig. 4).
Fig. 4. Heat demand at the different nodes of the district heating, and total consumption.
Intra-hour noisy signals Pdmn(t) have been performed from hourly consumptions for each
consumption node thanks to a random noisy procedure. It has been applied to produce more realistic consumptions minute wise profiles. Indeed, a simple interpolation generates a smooth signal, too
foreseeable. (missing data due to transmission constraints could be determine by using a simple linear interpolation)
5. Results
Reference case
This first test is undertaken using the entire set of heat demand data, without transmission losses: we consider it as the reference (ideal) case. The demands and the characteristics of the three production units, their optimal behaviours are calculated (Fig. 5) and summed up in load duration curves (Fig. 6).
It can be noticed that the expected merit order is always respected:
1. the biomass unit N1 generates a less expensive heat but is limited to 7 MW. This unit supplies
the base load: it generates heat all the year round and is sufficient to fulfil the demand in summer (Fig. 5). The rest of the year, supplement gas boilers (N2 and N6) are used.
2. The gas boiler at node N6 is used as a backup systems: it generates heat only when the two
other units are used at their maximal powers (Fig. 5).
Fig. 5. Production of the different nodes Fig. 6. Duration curve of productions at the production nodes
Impact of transmission losses on energy performances
In order to simulate transmission losses in the network. We consider that each node emits measurements of the power demand (mass flow rate, supply and return temperatures). These real time mesurements are regularly spaced in time and separated by a silent period in such a manner to respect a fixed transmission time ratio per node (duty cycle). As said before, this duty cycle is limited to ensure the stability of the network. Moreover, in Europe, it cannot be higher than 1% for legal reasons [30]. Each transmitted signal has a probability of success of 90%. This allows the simulation of the data received by the management system of the district heating network to be done. This set of transmitted mesurement is used as input data in the tool Heat Grid which leads to a shift of the production setpoints generated by HeatGrid compared to the values generated in the ideal case. This shift positive or negative depending on the time step.
These shifts are plotted in Fig. 7 for different duty cycles. This figure shows that the differences are globally more important for lower duty cycles. It shows also that, as for the reference case, the merit order is always respected. In fact, the shift is always observed at the generation unit which has the more expensive generation cost among the units switched on at that moment. i.e. the shift is observed at the backup when all the generation units are working. It is observed at the gas boiler (node 2) when two generations units are working. Finally, the shift is observed at the biomass generation unit (node 1) only when the toal demand power is below 7MW.
However, shifts amplitude is still marginal compared to the total demand power. This means that the data transmitted from nodes is sufficiently complete to have a clear idea about the total demand of
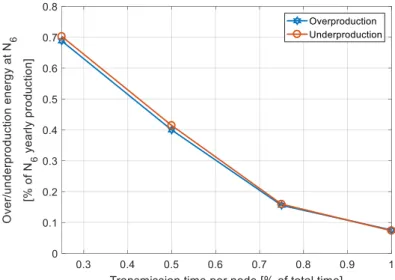
the district heating network even for duty cycle as small as 0.25% which corresponds in our case to one transmitted mesurement each 20 minutes in each node. This conclusion can be confirmed when calculating the energy production over the whole year for both reference and nonideal cases. Fig. 8 shows the total energy overproduced and underproduced by the backup system over a year. These results are normalised with respect to the total energy production of this same node in the ideal case. Fig. 8 shows that overproduction and underproduction of energy is greater for lower duty cycles but it remains really marginal (0.7% for d=0.25%).
These results demonstrate that for monitoring DH network, LoRa technology is perfectly suitable and the period between two consecutive transmissions can be long enough (d=0.25%) without an important shift between the production and the demand. Using this duty cycle means that we can use up to 180 terminals by base station without exceeding a normalized load of 45% and running the risk of network overloading.
Fig. 7. Shift of optimal production in the nodes between ideal and limited transmission for different duty cycles: a) d = 1%, b) d = 0.5%, c) d = 0.25%
Fig. 7. Normalized Over and underproduction in the backup (𝑁6) a)
b)
6. conclusion
The results presented in this work demonstrate that the LoRa technology is perfectly suitable for monitoring DH networks. The limitation of transmission losses is marginal and affects weakly the management system decisions even with high number of terminals per base station. However, controlling the DH network is a more complex issue. The system management needs to control the mass flow rate of each branch in the network. Using a few number of base stations to transmit the mass flow rate set points to a large number of branches is not possible because they are also constrained by a duty cycle of 1%. This will cause also additional mismatch between production and consumption which need to be studied further.
Nomenclature
d duty cycle L normalized load P power, W p transmission probability Ts silent period, s Ta on air period, s t time, s .m mass flow rate, kg/s 𝜆𝑚 terminals’ density 𝜆𝑏 base stations’ density
References
[1] Persson, U., Werner, S., Heat distribution and the future competitiveness of district heating. Appl. Energy 2011, 88: 568–576. doi:10.1016/j.apenergy.2010.09.020
[2] Dalla Rosa, A., Christensen, J.E., Low-energy district heating in energy-efficient building areas. Energy 2011, 36: 6890–6899. doi:10.1016/j.energy.2011.10.001
[3] Rämä, M., Sipilä, K., Challenges on low heat density district heating network design. In : The 12th International Symposium on District Heating and Cooling 2010, Tallinn, Estonia, pp. 69– 72.
[4] Lund, H., Werner, S., Wiltshire, R., Svendsen, S., Thorsen, J.E., Hvelplund, F., Mathiesen, B.V.,
4th Generation District Heating (4GDH). Energy 2014, 68: 1–11.
doi:10.1016/j.energy.2014.02.089
[5] Li, H., Wang, S.J., 2014. Challenges in Smart Low-temperature District Heating Development. Energy Procedia 2014, 61: 1472–1475. doi:10.1016/j.egypro.2014.12.150
[6] Dalla Rosa, A., Boulter, R., Church, K., Svendsen, S., District heating (DH) network design and operation toward a system-wide methodology for optimizing renewable energy solutions
(SMORES) in Canada: A case study. Energy 2012, 45: 960–974.
doi:10.1016/j.energy.2012.06.062
[7] Li, H., Svendsen, S., Dalla Rosa, A., Werner, S., Persson, U., Ruehling, K., Felsmann, C., Crane, M., Burzynski, R., Wiltshire, R., Bevilacqua, C., Toward 4th generation district heating : experience and potential of low-temperature district heating. In: The 14th International Symposium on District Heating and Cooling, 2014, Stockholm, Sweden.
[8] Kensby, J., Trüschel, A., Dalenbäck, J.-O., Potential of residential buildings as thermal energy storage in district heating systems – Results from a pilot test. Appl. Energy 2015, 137: 773–781. doi:10.1016/j.apenergy.2014.07.026
[9] Leal, S., Basciotti, D., Schmidt, R.-R., Deployment of a wireless monitoring system for indoor comfort assessment in a smart heat load-shifting context. IEEE 2013, pp. 5710–5715. doi:10.1109/IECON.2013.6700070
[10] Wernstedt, F., Johansson, C., Intelligent distributed load control, In: Proceedings of the 11th International Symposium on District Heating and Cooling, 2008, Reykjavik, Iceland.
[11] Gross, S., Rhein, M., Rühling, K., Large Heat Storages for load management in CHP based DH systems. In: Proceeding of The 14th International Symposium on District Heating and Cooling, Stockholm, 2014, Sweden.
[12] Lécollier, M., Towards Smarter District heating and cooling Networks. In: Proceedings of The 13th International Symposium on District Heating and Cooling, 2012, Copenhagen, Denmark, pp. 25–28.
[13] Lindenberger, D., Bruckner, T., Groscurth, H.-M., Kümmel, R., 2000. Optimization of solar district heating systems: seasonal storage, heat pumps, and cogeneration. Energy 2000, 25: 591–608.
[14] Steen, D., Stadler, M., Cardoso, G., Groissböck, M., DeForest, N., Marnay, C., Modeling of thermal storage systems in MILP distributed energy resource models. Appl. Energy 2015, 137: 82–792.
[15] Verda, V., Colella, F., Primary energy savings through thermal storage in district heating networks. Energy 2011, 36: 4278–4286. doi:10.1016/j.energy.2011.04.015
[16] Byun, S.-J., Park, H.-S., Yi, S.-J., Song, C.-H., Choi, Y.-D., Lee, S.-H., Shin, J.-K., Study on the optimal heat supply control algorithm for district heating distribution network in response to outdoor air temperature. Energy 2015, 86: 247–256. doi:10.1016/j.energy.2015.04.029 [17] Li, L., Zaheeruddin, M., A control strategy for energy optimal operation of a direct district
heating system. Int. J. Energy Res. 2004, 28: 597–612.
[18] Lianzhong, L., Lei, X., Control Strategy Simulation Based on a Verified Dynamic Model for an Actual Indirect District Heating System. Energy Procedia 2014, 61: 1982–1986. doi:10.1016/j.egypro.2014.12.057
[19] Palsson, O.P., Stochastic Modeling, control ans optimization of district heating systems (PhD thesis). Technical University of Denmark, Kongens Lyngby; 1993
[20] Zhang, L., Gudmundsson, O., Thorsen, J.E., Li, H., Li, X., Svendsen, S., Method for reducing excess heat supply experienced in typical Chinese district heating systems by achieving hydraulic balance and improving indoor air temperature control at the building level. Energy 2016, 107: 431–442. doi:10.1016/j.energy.2016.03.138
[21] Orecchini, F., Santiangeli, A., 2011. Beyond smart grids – The need of intelligent energy networks for a higher global efficiency through energy vectors integration. Int. J. Hydrog. Energy 2011, 36: 8126–8133. doi:10.1016/j.ijhydene.2011.01.160
[22] Dänekas, C., Rohjans, S., Wissing, C., Appelrath, H.J., 2011. “Future Energy Grid” – Migration Paths into the Internet of Energy. In proceedings of the eChallenges 2011 conference and exhibition, Florence, Italy.
[23] Bouhafs, F., Mackay, M., Merabti, M., Links to the Future: Communication Requirements and Challenges in the Smart Grid. IEEE Power Energy Mag. 2012, 10: 24–32. doi:10.1109/MPE.2011.943134
[24] Güngör, V.C., Sahin, D., Kocak, T., Ergüt, S., Buccella, C., Cecati, C., Hancke, G.P., Smart grid technologies: communication technologies and standards. Ind. Inform. IEEE Trans. 2011, 7: 529–539.
[25] Mourshed, M., Robert, S., Ranalli, A., Messervey, T., Reforgiato, D., Contreau, R., Becue, A., Quinn, K., Rezgui, Y., Lennard, Z., Smart Grid Futures: Perspectives on the Integration of
Energy and ICT Services. Energy Procedia 2015, 75: 1132–1137.
doi:10.1016/j.egypro.2015.07.531
[26] Liu, L., Fu, L., Jiang, Y., A new “wireless on-off control” technique for adjusting and metering household heat in district heating system. Appl. Therm. Eng. 2012, 36: 202–209. doi:10.1016/j.applthermaleng.2011.11.040
[27] Wernstedt, F., Multi-agent systems for district heating management. Department of Software Engineering and Computer Science, Blekinge Institute of Technology, Ronneby, 2003.
[28] Ahmad, M.W., Mourshed, M., Mundow, D., Sisinni, M., Rezgui, Y., Building energy metering and environmental monitoring – A state-of-the-art review and directions for future research. Energy Build. 2016, 120: 85–102. doi:10.1016/j.enbuild.2016.03.059
[29] Güngör, V.C., Lu, B., Hancke, G.P., 2010. Opportunities and Challenges of Wireless Sensor Networks in Smart Grid. IEEE Trans. Ind. Electron. 2010, 57: 3557–3564. doi:10.1109/TIE.2009.2039455
[30] Adelantado F., Vilajosana X., Tuset-Peiro P., Martinez B., J. Melia-Segui and T. Watteyne, "Understanding the Limits of LoRaWAN," in IEEE Communications Magazine2017, 55( 9): 34-40. doi: 10.1109/MCOM.2017.1600613
[31] Stefanovic C., Momoda M., Popovski P., Exploiting Capture Effect in Frameless ALOHA for Massive Wireless Random Access, IEEE WCNC'14 Track 2
[32] Q. Song, X. Lagrange and L. Nuaymi, "Evaluation of Macro Diversity Gain in Long Range ALOHA Networks," in IEEE Communications Letters, vol. 21, no. 11, pp. 2472-2475, Nov. 2017. doi: 10.1109/LCOMM.2017.2732984
[33] Marguerite, C., Bourges, B., Lacarrière, B., Application of a district heating network (DHN) model for an ex-ante evaluation to support a multi-sources DH. In: proceedings of the 13th International Conference of the International Building Performance Simulation Association, 2013, Chambery, France.
[34] Marguerite, C., Bourges, B., Lacarrière, B., Integrate models to evaluate district heating networks. In: proceedings of The 13th International Symposium on District Heating and Cooling, Copenhagen, 2012, Denmark.
[35] Marguerite, C., Modèles intégrés pour l’évaluation des actions territoriales de réduction des émissions de gaz à effet de serre. Application aux réseaux de chaleur : HeatGrid, un modèle de simulation énergétique pour un management stratégique. (PhD thesis). Ecole des Mines de Nantes, Nantes; 2014.