8
Study of Spatial Disparities in Algerian Regions: Using a Parametric and Non-Parametric Approaches
Mokhtar IDRISSI 1, Pr. Youcef SOUAR 2 1 Ph.D student at Aboubaker belkaid University Tlemcen
Email : [email protected] 2
Professor of economics, Dr. moulay Tahar University Saida Email:[email protected]
Received: 05/03/2018 Accepted: 24/06/2018 Published: 30/06/2018
Abstract:
In modern economic development strategies, the achievement of developed regions and create interaction between them in order to make it convergent and cohesion is necessary to reduce disparities. Because there are spatial factors who have driven development .
This article attempts to investigate spatial disparities among Algerian regions through the application of parametric and non-parametric methods (principal component analysis, nearest neighborhood and spatial regression) in order to identify the economic structure of regions and study the spatial disparities. The main results of this study indicate the existence of disparities from the lower spatial auto-correlation rate between regions and the heterogeneity tests. In other hand, the insignificant of spatial econometric tests (spatial dependence of error) indicate the independence of Algerian regions, which denoted that the thinking of decision makers on the spatial structure plans of Algerian economic cities is still limited.
Keywords: Spatial development; spatial disparities; Composite index of
development.
JEL Classification Codes : R58, R10.C43
__________________________________________
1. INTRODUCTION
The question of measuring spatial disparities will play an important role in policies implementation in order to reduce disparity and reach optimal allocation of funding and resources. In order to achieve balanced spatial development, many recent models and studies indicate a negative impact of spatial inequality on the economic performance of countries that are strongly related to the levels of disparities among regions.
In recent years, the Algerian economy is facing a real crisis due to the decline of oil prices in international oil markets because the Algerian economy is still depending on oil revenue. Despite the attempts to get rid of oil dependency for several years ago, Algeria had an important opportunity to make a strong economic structure and enhance economic growth through taking advantages of the opportunity of rising oil prices in the past 10 years. Before seventeen years ago, Algeria has launched huge investment programs in order to achieve development and economic growth that reached to increase yearly of 3.7% from 2000-2015. About employment policies. The government concentrated on reducing unemployment rate that have been reduced from 29.5% in 2000 to 11.7% in 2017.
Through the contribution of production sectors that were boosted by a set of adjustment policies (agricultural, industrial, commercial) in order to differentiate the economic resources and achieve a balanced level of development among Algerian regions without a far disparities between them.
Concerning human development progress and poverty ,Algeria has witnessed some improvement in human development indicators and moved to important ranking like that human development reports indicate which ranked Algeria among the 10 nations that have a considerable enhancement in terms of human development index since 1970.
These economic policies can play an important role if they are used to exploit economic and human potential in each region. In other hand, these policies lead to create different patterns that help to differentiate the resources of economic growth and development across regions, which lead
10
to generate interactions between regions and increase the economic efficiency.
One of most important bases in the economic development of regions is the contribution of each region in the economic development process and on the economic growth. This is the role of the decision makers in the spatial dimension by using the modern spatial planning tools that help to localize economic activities and make cities more competitive.
Algerian government adopted in 2001 some policies of territorial planning that was named (National Plan of territorial development) and published in 2009 (world Bank, 2011), in Which can find a set of different policies that the government wanted to apply their procedures in order to identify potential regions and encourage the rise of agglomeration and clustering cities. Coincidentally with the implementation of these policies, the programs have been launched by the Algerian government from (2000-2004), (2009-2005) and (2010-2014) which the government has undertaken to improve and develop infrastructure facilities and make them more efficient, in order to improve economic and social indicators among all cities.
From this variety of programs used to achieve development and economic growth, it becomes necessary that the Algerian government should apply the spatial dimension in their development policies. Since experiences in the world indicate that the success of the spatial planning in development of countries and some lagging areas.
The critical question is that how the Algerian Governments can reduce spatial disparities among regions through the assessment of results. Moreover, how to make comparison with what was expected from economic policies that are based on the territorial plan and how can this plan enhance development. Based on this critical situation, the following problematic can be raised:
What is the effect of Algerian government economic policies on the development of regions and what is their effects on disparities among them?
Our study will be based on the statistical analysis and spatial econometric model by making a composite index of spatial development that measure the spatial development of Algerian cities. After that, we will Study the existence of spatial disparities based on spatial econometric model that explain the composite index as a dependent variable and some of explanatory variables.
2. LITERATURE REVIEW
Several studies focus on the economic development and spatial disparity, in order to find a relationship between spatial economic factors and disparities. Because these spatial factors play an important role to determine the spatial development patterns which facilitate making interaction and help decision makers to plan an effective development strategies and That what was discussed by a numerous studies which study economic development at the spatial context. Many economic theorists have argued that the pioneer Williamson and Kuznets1965 confirms that achieving economic growth and development results disparities,
Despite the important advances that are made in literature review of spatial disparities. Many studies tried to analyze at multilevel the effects of spatial disparities on the economic development indicators and economic growth rate. It can list some of these papers as follows:
Carsten Herrmann-Pillath & al (2002) in their study, Authors
analyzed the impact of spatial aggregation on evaluation of spatial disparities among Chinese regions. This study indicates that nationally homogeneous discrimination is still affecting development level on urban areas and rural areas. In addition, they analyzed the structure of inequalities by using component analysis of the general measure of entropy, which was applied on inter-regional disparities with reference to different levels of aggregation as well as the rural/urban segmentation. The conclusion of this study indicates that lower levels of data aggregation are recommended for policy purposes, in the case they exist a clear growth trend with diminishing regional disparities.
12
(Venables, 2003) The author explains in this paper the causes of
disparities in developing countries which are related to their resource’s advantages that encouraged regions to cluster and the concentration of economic activities. In this regard, the structures of some regions may change to a non-optimal when the scale returns are changed and the result can create negative effect on the development levels in these areas.
Eleonora Patacchini & al (2008) indicate the presence of spatial economic disparities between Italian regions and this variation in this study can be determined by focusing on the level of value-added per hour worked.
(Dall’erba, 2010) In their paper research, they looked at spatial
disparities among Turkish regions over 1995-2001 by using a set of spatial statistics analysis tools. In order to reveal spatial heterogeneity or spatial dependency, the results of this study show that the West part of the Turkish country is developed than the East. The development and the growth of the Turkish regions is related by the Distribution of the two indicators of public development investments and human capital.
(Mohamed, Slim, & Zouhour, 2011) This research paper analyzed
the spatial disparities among Tunisian delegations by making up a spatial composite index of welfare (SCIW) which is composed from different variables that indicate economic and social human needs. The results show that regional development policies and economic liberalization of Tunisian economy have a positive impact on this composite index of welfare. Nevertheless, with regard to inequality the impact of liberalization and economic policies can only reduce disparities in coastal regions unlike internal regions.
(Zhuang, 2013) In this article, the author indicates that spatial
structure and urbanization affect inequalities. He said that urbanization is a major driving force of inequality especially in Asia.
(Stamenković, 2017) In an article that has been published, authors
indicate the importance of studying and measuring disparities. Also, they explained
That the identification of disparities help decision makers to make good policy in Serbia. The results of this study show the existence of
disparities among regions in the north as more developed districts and the less developed districts are located in south. In addition, they found that districts of Belgrade and Novi Sad occupy the dominant positions when they are compared by the other districts.
3. THEORICAL FRAMEWORK
In recent years, many studies have appeared the importance of spatial and regional disparities among regions. This subject that has been considered a reason for the hindrance and block of the development paths in several countries. Which forced countries to focus on the regional and local politics in order to facilitate life and provide basic human needs in each area. Moreover, countries concentrate on making effective policies to reduce spatial disparities that affect negatively the economic development and growth especially in developing countries.
Several studies in recent decades have addressed the importance of all types of disparities (economic, Social, cultural) account of its importance that affect negatively the distribution of wealth among regions and affect the standard living of people especially income disparities. Among the important studies that were performed and which involve studying disparity and inequality is the Kuznets-Williamson (1965) research that explains the evolution of disparities in the different stages of economic development of each space or area. The contribution of this study concluded that disparities increase in the early stages of economic development due to the uneven spatial coverage of technological progress (Díez-Minguela, 2017). For this interpretation of Williamson, various factors lead to explain the evolution of disparities: 1) labor mobility to the central region. 2) a capital mobility oriented from the South to the North in order to take advantage of agglomeration economies, thus limiting the location of activities and investments in the periphery.3) Limited diffusion effects related with the centralization of public authorities in the North and restricted diffusion of technological progress and income multipliers. (Christophe VAN HUFFEL, 2003). Another interpretation of Locus concerning disparities among
14
regions. He indicates the existing of two kinds of regions and suggests that disparities will diminish after witnessing an increase level in the early stages of development in some regions whith other regions start to develop with faster level than the ones developing early (bela.szorfi, 2007).
3.1. What is economic spatial disparity?
There are several definitions of disparity in the spatial context. F. Aydalot (1984) defined disparity as “remoteness from the norm, the difficulty consists in choosing the rules that cannot be regarded identity or equality, it is being directly correlated to the spatio-temporal context of that society" (COVACI, 2014). Another definition of OECD said that disparities express the scope of the difference of intensity manifestation of economic phenomena under investigation observed within regions of given country (OECD, 2002). Also, Karin Vorauer (2007) defines disparities as the deviations from any conceptual reference division of characters taken as relevant, in association with different spatial benchmark levels (region borders). So , regional disparity means unbalanced spatial structures in some regions” (CRUDU, 2015), according to this definition regional disparities are conditioned by several factors linked to the unequal economic and development potential in different regions. Balisacan (2009) indicated that disparities can be attributed to the variation in access to benefit from infrastructure and basic social services in the space. (Nijkamp, 2017) in other hand, Peter Nijkamp argues that spatial disparities reflect differences in regional growth and productivity and calls for a profound analysis of their driving forces. Depending on these definitions, disparities may affect at different levels. Some studies indicate that there are three kinds of disparities in the spatial context. As explained by K. Gajdová and P. Tuleja (2015) In their studies they indicate three types of disparities based on the level of effect (Gajdová, 2015) cited as follow:
Economic disparities: this type of disparities is linked to the
economic performance of regions, the structure of the regional economy and the development factors and human potential. We can measure this type
by using some economic indicators GDP per capita, employment, unemployment, labour productivity, industry, science and research.
Social disparities: are linked to the population in the wider context of
quality of life, standard of living and social equality. We can determinate the level of this kind of disparities through the variation in some variables that indicate social situation between regions like population density, demographic structure, migration, occupations, job mobility and health.
Territorial disparities: this type related with geographic, natural,
transport and technical conditions. It can determined by the variation in some variables like area, climate, air, water, nature, waste, forests, transport infrastructure and technical infrastructure.
3.2. Spatial development and disparities: what relationship?
Spatial disparities reduction are strongly depending on the economic development strategies and planning in order to achieve balanced level of development and economic growth among regions. Whereas the knowledge of the causes and the indicators that have been chosen to measure are very important in policy making.
Some spatial economic factors increase spatial disparities. Through the unequal distribution of industrial and commercial activities, and the emergence of growth poles in some region that are characterized by the abundant natural resources. These factors can lead a certain patterns of spatial economic development, which helps the emergence of more developed regions and less developed regions. In addition, there exist another non-spatial factors that affect spatial development and disparities among region especially in small countries like the openness of the economy, which may make the economy dependent on external factors forces (trade, sources of supply). The centralized governance structure characteristic of some countries is also one of the factors that increase divergent and spatial disparities.
There were other factors that affect negatively the convergent of regions including the mobility of technology and Transaction costs, which
16
are always related with the mobility of production factors. Whenever the large proportion of these costs can increase disparities among regions. (Portnov, 2005). However, in micro-economic level, spatial economic disparities can increase the poverty rate between regions. Generally, it can lead to spatial disparities in essential human needs of life and public facilities. For instance, housing standard living, employment and social welfare.
R Kanbur and A J. Venables, (2005) in their directed project UNU-Wider that investigates Spatial disparities in development in over 50 developing countries since 2005. They concluded that spatial disparities increase in these countries, especially between rural and urban areas. Also , between geographically advantaged and disadvantaged regions, the reasons for these disparities are due to the concentration of economic activity in urban centers and in coastal districts. It can also depend on the unequal allocation of infrastructure and public services in these regions.
The main objective that decision makers take in account in making of economic development plans is how to make regions convergent and more cohesion by the economic and social policies which have the objective of achieving more balanced development level and reducing disparities.
4. MATERIALS AND METHODS
In order to identify the existing of spatial disparities among Algerian regions. we start by calculating Moran’s statistic index to measure the global spatial auto-correlation coefficient between spatial observations. Moran’s I statistic is a standard measure of global spatial auto-correlation (Moran, 1948), which provides an indication of the degree of linear association between the observation vector (x) and a vector of spatially weighted averages of neighboring values (W) (Flanagan, 2014). This index can ranged from -1 that indicates a strong negative spatial correlation to +1 who indicate a strong positive spatial auto-correlation and the 0 value indicates that there aren’t any spatial auto-correlation . The global Moran’s formulation index I is thus :
𝐼 = 𝑁 𝑆0
∑ ∑ 𝑤𝑖 𝑗 𝑖𝑗(𝑥𝑖 − 𝑥̅)(𝑥𝑗 − 𝑥̅)
∑ (𝑖 𝑥𝑖 − 𝑥̅)2
Where N is the number of observations, 𝑆0is the sum of the weights, 𝑤𝑖𝑗is the (i,j ) element. In the spatial weights matrix W, 𝑥𝑖 and 𝑥𝑗 are the values on the random variable at locations I And j, and y is the mean on y.
This statistic index can tests the flowing null Hypothesis:
𝐻0 ∶ I = 0 no spatial autocorrelation
𝐻1 ∶ I > 0: spatial autocorrelation exists
We can reject the Null Hypothesis if Z test statistic > 1.96 (or < -1.96). at 5% level . After this test, we use the non-parametric nearest neighbor Methods in order to measure the similarity or dissimilarity between regions.
5. DATA
The empirical application carried out in this paper is based on data, which was prepared by the Algerian National Statistical Office (ONS) 2015. It is about 36 Algerian cities from different regions and the variables that we have used to study spatial disparities in Algerian regions are 33 variables, which indicate the access of basic needs of people and potential of Algerian regions. We choose these variables based on the literature review as indicator of spatial economic development level, Also the period time of this study was determined by availability of spatial data.
6. EXPLORATORY SPATIAL DATA ANALYSIS
In second parts. We calculate the global and local Moran that is commonly used to test the presence of spatial dependence between spatial neighbor. This test has an important main to achieve some objective as Anselin 1996 explained (Rushe, 2008) :
1. describe spatial distributions .
2. discover patterns of spatial association (spatial clustering). 3. suggest different spatial regimes (non-stationary).
18
The results of spatial auto-correlation that was indicated in Table. 1
suggest the presence of spatial dependence of development indicators between Algerian neighboring regions. This result is as follows:
Table 1. Global and local Moran’s indicators I
Variables Global Moran index
Global Population (GP) -0.05
Unemployment Rate
(UNR) -0.024
Urbanisation Rate(UR) -0.009
Global Housing -0.039
Number of Small and
medium Enterprise(NSME) -0.049
Source: By authors from Geoda out-put
From the above statistics table, Our results indicate that Moran’s index value of all variables are under the value 0 (week value) with a negative sign. This result indicates the independence of regions studied. While, we cannot reject the null-hypothesis that indicate the random distribution (no spatial auto-correlation) of these social and economics variable among regions which reflect clearly the non-clustering tendencies for these variable among regions.
6.1. Local Moran’s indicator interpretation:
This analysis is related with the local’s Moran indicator. It displays the distribution of Algerian cities. It aims to identify a significant spatial clustering of regions with the high or low value through the variable of each city that was examined. We start from the first figure (A) that indicates the non existence of (High-High) areas, it means that non significance of clustering among regions with high levels of this development indicators .
We observe also the presence of negative spatial auto-correlation in the west some cities in the North and the east part of Algeria. Through the distribution of global population variable Figure (A). We see that there are
19 cities in some east region and the west regions with (Low-Low) levels that meant that there is a negative auto-correlation between regions. It can be explained by Dispersed Pattern of population variable. While 29 cities have the value (low-high)and (high-low) that indicates the spatial outliers combination: high values tend to be surrounded by low values, and low values tend to be surrounded by high values.
Concerning the distribution of Unemployment rate variable Figure
(B), we observe that there exist 01 south city in the (High-High) value. It is
named Tamanrasset city. However, the other 14 regions have negative spatial auto-correlation or spatial dispersion pattern among them through the unemployment rate and the rest parts of region 33 is spatial outliers combination. Figure (C) is related to urbanization rate variable that indicates a positive spatial auto-correlation of 27 cities in (high-high) it means that these regions can be clustered among them. While the20 other regions have a spatial outliers combination. We observe that only adrar city has a negative spatial auto-correlation.
Concerning the distribution of Figures (D), (E) that respectively display the Global Housing and Small Medium Enterprise . It is clearly that local Moran indicates the negative spatial auto-correlation among Algerian cities about 21, 27 respectively of the Global Housing and Small and Medium Enterprise. With the values (low-low) and (high-low),(low-high) we observe that 27 ,21 regions have been classified as spatial outliers combination .
20
Fig.2. Unemployment rate Fig.3. Urbanization rate
Fig.4.Global Housing
Fig.5. SM Enterprise
Source: By authors from Geoda out-put
We observe in these local auto-correlation index the no existence of positive spatial association. That it can be interpreted by no possibilities of clustering positively among regions. Our results suggest that Algerian region Characterized by the dispersion pattern through the variables cited above. These results indicated clearly that there are some independence, which leads to the emergence of disparities between regions.
In the third step, we also used the nearest neighbor to study the disparities between Algerian regions. It is a non-parametric method ,we use this method to identify the different classification of cities and its similarities. This method is used to classify the neighbors (entities, cities, Regions, units, etc.), In order to recognize patterns of data. This method is an effective way to improve disparities based on the graphical representations. The neighbor maps in Fig.2 already suggest the spatial disparities between region’s studied. They indicate that there exist dissimilarities between Algerian regions.
Fig.6.Distance between Algerian Cities by nearest neighbor method
Source: output of SPSS analysis of nearest neighbor 7. ESTIMATION OF SPATIAL ECONOMETRIC MODEL
This paper aims to investigate spatial development and evolution of disparities among cities in the Algerian economy. After studying the general and local auto-correlation by Moran index and nearest neighbor method. Now, we try to estimate a spatial econometric model. In the first step, we applied the principal component analysis on the data variables in order to build a spatial composite index of development (SCID) through the variables cited below. Principal component analysis is used to reduce or summarize dimension and to determine the important factors explaining
22
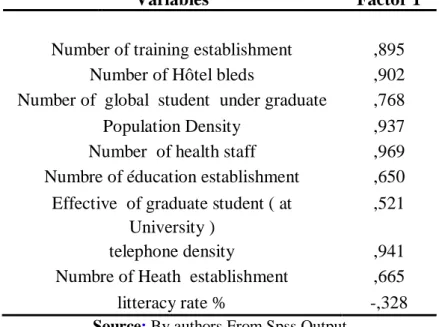
each phenomenon that have been studied. From the test of Adequacy of this sampling to the component analysis, we observe that the KMO is upper then 0,818 >0.5 and the bertlet test is significant, it equals the value of 0,000. This analysis gives three factors that indicate the contribution of each variables. We choose the factor that has the highest variance explained Value (most important part of information). In our study, it was the first factor that explained about 49.740% .The variables loading of this factor is cited in the following table:
Table 2. Principal factor analysis
Variables Factor 1
Number of training establishment ,895
Number of Hôtel bleds ,902
Number of global student under graduate ,768
Population Density ,937
Number of health staff ,969
Numbre of éducation establishment ,650 Effective of graduate student ( at
University )
,521
telephone density ,941
Numbre of Heath establishment ,665
litteracy rate % -,328
Source: By authors From Spss Output
From this result of principal component analysis that summarizes the contribution of spatial variables and formulate the composite index of spatial development. In the second step, we can use the score result of principal component to estimate the spatial regression models. In order to study the spatial auto-correlation and spatial effect of these variables on the spatial composite index of development (SCID) and examine the specification of this spatial regression model.
7.1. Spatial regression models:
We try in this section to estimate a spatial regression model by different methods that focused on the spatial dependencies of estimation in the spatial context. It is composed by a set of dependencies tests. We start from the linear regression formulation equation that changed from OLS
method to another one because there are different types interaction arise from different ways (Elhorst, 2014). There are interactions effects caused by dependent variable, among independent variables and can be arise from the interaction among error terms in spatial econometric models. In addition, there are two problems arise when the sample data has a location component: 1) spatial dependence exists between the observations; 2) spatial heterogeneity occurs in the relationships we are modeling (LeSage, 1998). We start by the general equation of spatial lag model (Arbia, 2014): 𝑦 = 𝜆𝑊𝑦 + 𝑋𝛽(1)+ 𝑊𝑋𝛽(2)+ 𝜇 |𝜆| < 1
𝜇 = 𝜌𝑊𝜇 + 𝜀 |𝜌| < 1
We can write also: 𝑦 = 𝜆𝑊𝑦 + 𝑍𝛽 + 𝜇 |𝜆| < 1
With X is a matrix of non-stochastic regressors, W is the weight matrix exogenously given, 𝛽(1), 𝛽(2) ، 𝜆𝜌، Parameters to be estimated and the term of error that(𝜀|𝑋 = 𝑖. 𝑖. 𝑑. 𝑁(0, 𝜎𝜀 𝑛2 Ι
𝑛). From the estimation of econometric,
we can estimate three types of spatial models according to the interaction effect: spatial autoregressive model (SAR model), spatial error model (SEM).
7.2. Estimation models and interpretation results:
Our estimation in this section is based on spatial econometric models that consider the variables of composite index of spatial development as dependent variable. And the other selected spatial economic indicators that explain more development in spatial dimension like population, unemployment rate, and urbanization rate ,Number of small and medium enterprise. We considered these variables as indicators of spatial economic development
24
𝐒𝐂𝐈𝐃 = 𝝀𝑾 𝐒𝐂𝐈𝐃 + 𝛽(1)GP + 𝛽(2)UNR + 𝛽(3)UR + 𝛽(4)𝐺𝐻 + 𝛽(5)NSME + 𝑊𝛽(6)(GP + UNR + UR + GH + NSME) + 𝜇 |𝜆| < 1
From the estimation of spatial econometric model, the result indicates that the Adjusted R-Squared value is 0.83 that means the explanatory variables modeled using in this linear regression explains approximately 83 % of the variation in the dependent variable in the OLS model. In other hand, when we look at the signification of coefficient related to the explanatory variables we find that just the variable of urbanization (UR) is not significant and the constant as well. Furthermore, the sign associated with the coefficient of population, (NSME) is positive, and negative with the variables Unemployment rate (UNR), Global Housing, (GH). This is consistent with reality because unemployment rate (UNR) affects local development by increasing the unemployed population. With regard to the global housing, that affects negatively the development level through the problems of Overcrowding in society.
In term of diagnostic spatial statistic tests, we note that the value of multicollinearity condition number is MCN=10.745 this value is not greater than 20 that means the absence of multicollinearity between explanatory variables. Also, the result of normality test shows that the residuals are not normally distributed JB=15.04 so we reject the null hypothesis of a normal distribution.
Concerning the diagnostics of heteroskedasticity with Breusch-Pagan, Koenker-Bassett and White tests. These tests indicate the existence of heteroskedasticity because the value of these tests are significant. For the spatial dependence, we can see that all dependence tests Lagrange Multiplier (lag), (Robust LM (lag) Lagrange Multiplier (error), and Robust LM (error), Lagrange Multiplier (SARMA) are insignificant (Table 04). In addition, Moran index is insignificant that indicates the independence of error. From these results we can based just on the estimation of OLS because in the presence of spatial auto-correlation of errors makes the OLS estimates inefficient. The estimation of spatial lagged and spatial error models are not appropriate in this case of data.
These statistic results lead us to confirm that disparities in Algerian economy are existing from the heterogeneity and independence of error model estimation. Although the significant of explanatory variable coefficients that have significant effects on the spatial composite index of development. Spatial development strategies should concentrate on the creation of employment, firms and enterprise, and improve the level of urbanization rate among Algerian cities. Especially in the south and internal cities because it is a principal factor to build spatial economies which provides the opportunity of development of spatial infrastructure and spatial interactions. It is too important to encourage economic activities localization in cities. It helps also regions to participate in the national production mechanisms. All these can enhance the economic growth and development . of course if they adopt effective spatial economic development policies.
8. CONCLUSION
The huge plan of investment, which was launched by the government during the period 2000-2017, should generate an effective positive impact on the economic growth in Algeria, if these basic infrastructures are distributed among regions to benefit from them, and in order to reduce disparities and make regions convergent. Also, making regions more developed by the enhancement of economic activities that affect the levels of development and prosperity.
The Empirical analysis that we have adopted in this paper indicates the existence of spatial divergent among Algerian regions. What was seen in the negative spatial auto-correlation and the spatial outliers combination? These results cannot help regions to promote their resources by clustering with other regions. Contrary these results encourage dissimilarities between them. In addition, the spatial econometric results indicate the spatial independence among cities through the clear insignificance of spatial tests of spatial dependence.
26
In this paper of studying spatial disparities, the results indicate that Algerian economic policies are not playing an effective role to make regions convergent in order to reduce disparities among them. It may be necessary for the government plans to create interaction and linkage between regions. In order to strengthen the economic potential and enhance economic growth by the effective economic development policies that encourage creating firms and companies that offer employment and jobs, i.e. creating wealth among regions instead of merely consumption of huge finds and oil rent in vain.
9. BIBLIOGRAPHY LIST:
Arbia, G. A,(2014) , "Primer for Spatial Econometrics With Applications in R". New York, US: Palgrave macmillan.
Bela. szorfi, (2007), "Development and Regional Disparities -Testing the Williamson Curve Hypothesis in the European Union",ceec.oenb,100-121.
Christophe VAN HUFFEL, M. C(2003) , Inégalités regionales et " developement economique : LE CAS FRANÇAIS (1850-2000)".
Revue d’Economie Régionale et Urbaine(5), P5;
COVACI, R. N. (2014), "Spatial disparities of population evolution in plain brida -moravita" .scientific annals of OF “Al. I. CUZA”
UNIVERSITY OF IAŞI Geography series, LX(2), P150;
CRUDU, R,(2015) ," Economic crisis and economic disparities in european union". Centre for European Studies, VII(2A), P422;
Dall’erba, F.C.(2010), "Spatial disparities across the regions of Turkey:an exploratory spatial data analysis".Annal of Regional Science,45, 379– 400;
Díez-Minguela, A(2017) ,"The long-term relationship between economic development and regional inequality: South-West Europe", 1860-2010. European Historical Economics Society decembre 119, 2. Avalaible at http://www.ehes.org/ .consulted on 21/02/2018;
Elhorst, J. P. (2014) , "Spatial Econometrics From Cross-Sectional Data to
Flanagan, W. M, (2014) ," The changing patterns of labour underutilisation in Europe in the face of policy austerity". Working Paper No. 01-14
Centre of Full Employment and Equity The University of Newcastle P 9;
Gajdová, P. T. (2015), "Regional Disparities in the Economic Sphere: Evidence from the Selected Countries of the European Union".
Journal of Economics, Business and Management, 3(1), P38;
LeSage, J. P , (1998). "Spatial Econometrics" Department of Economics" University of Toledo. December, P2;
Mohamed, K., Slim, D., & Zouhour, K. (2011), "Inequality and Spatial Disparities in Tunisia". Journal of Business Inquiry: Research,
Education & Application;, Vol. 10 ( Issue 1) , PP 161-175;
Nijkamp, A. A. (2017), "Regional Growth and Sustainable Development in Asia, New Frontiers in Regional Science:Asian Perspectives".
Springer International Publishing Switzerland, P27;
Portnov, D. F.. ,(2005) ," The Liability of Smallness:Can We Expect Less Regional Disparities in Small Countries?", Regional Disparities in
Small Countries, (pp. 20-21). New York: Springer-Verlag Berlin
Heidelberg;
Rushe, k. (2008), "Quality of life in the regions: An exploratory spatial data analysis for West German labor markets". Muenster. Germany,
CAWM Discussion Papers, Centrum für angewandte
Wirtschaftsforschung Münster (CAWM), Universität Münster, Germany: Centrum für Angewandte, P5;
Stamenković, M. (2017),"Measuring regional economic disparities in Serbia: Multivariate statistical
approach".Industrija,Vol.45,No.3,PP101-130;
Venables, A. J. (2003). "Spatial Disparities in Developing Countries:
Cities, Regions and International Trade". Centre for Economic
Performance London School of Economics and Political Science. London Houghton Street London,PP 1-30;
28
world Bank, T. I. (2011) ," Poor Places,Thriving People How the Middle
East and North Africa Can Rise AboveSpatial Disparities". MENA
develop;ent report. Washington ,P280;
Zhuang, J. a. (2013, ), "Urbanization and Inequality in Asia". Asian
Development Review, Vol. 30 (No. 1), march, 131-147. Avalaible at:
http://dx.doi.org/10.2139/ssrn.2399298 .Consulted on 26/01/2018.
UNU-WIDER: United Nations University-world institute for development economics
research
10. APPENDICES
Table 3. Nearest neighbor distance
City Nearest Neighboor cities Distance
Tizi ouzou Relizane 1.304
Tizi ouzou Souk Ahras 1.304
Tizi ouzou Wilaya de Béjaïa 1.336
Tizi ouzou Wilaya de M'sila 1,484
Tizi ouzou Mostaganem 1.493
Tizi ouzou Medéa 1.575
Tizi ouzou Tissemsilt 1.646
Tizi ouzou Batna 1.680
Tizi ouzou Skikda 1.717
Tizi ouzou Setif 1.750
Tizi ouzou Mila 1.776
Tizi ouzou Blida 1.777
Tizi ouzou Jijel 1.777
Tizi ouzou Tipaza 1.819
Tizi ouzou Djelfa 1.875
Tizi ouzou Sidi-Bel-Abbès 1.907
Tizi ouzou Ain-Temouchent 1.926
Tizi ouzou Naama 1.937
Tizi ouzou Laghouat 1.947
Tizi ouzou Biskra 1.959
Tizi ouzou Bordj Bou Arreridj 2.020
Tizi ouzou Tiaret 2,038
Tizi ouzou Saida 2.051
Tizi ouzou Tamanrasset 2.064
Tizi ouzou Ghardaïa 2.167
Tizi ouzou Guelma 2.195
Tizi ouzou Constantine 2.202
Tizi ouzou Tébessa 2.257
Tizi ouzou Oran 2.444
Tizi ouzou Bechar 2.444
Tizi ouzou Alger 2.455
Tizi ouzou Illizi 2.584
Tizi ouzou Tindouf 2.927
Source: Authors from Spss output
Table 04 :estimation of spatial model by OLS
Dependent variable
R-squared : 0.851292 F-statistic : 46.9418 Adjusted R-squared : 0.833157 Prob(F-statistic) :6.54195e-016 Sum squared residual: 4.97299 Log likelihood : -13.9062 Sigma-square : 0.121293 Akaike info criterion : 39.8123 S.E. of regression : 0.348271 Schwarz criterion : 50.9132 Sigma-square ML : 0.105808
S.E of regression ML: 0.325282
Variable Coefficient Std.Error t-Statistic Probability CONSTANT -0.00267643 0.0950562 -0.0281563 0.97769 UNEMRATE -0.0629769 0.0211385 -2.97926 0.00484 POPULATION 8.38579e-007 2.245e-007 3.73532 0.00057 URBANRATE -0.0024121 0.00267558 -0.901522 0.37258 NSME 4.90164e-005 9.91905e-006 4.94164 0.00001 HOUSEPARC -4.07479e-006 7.23404e-007 -5.6328 0.00000 REGRESSION DIAGNOSTICS
MULTICOLLINEARITY CONDITION NUMBER 10.745900 TEST ON NORMALITY OF ERRORS
TEST DF VALUE PROB Jarque-Bera 2 15.0439 0.00054 DIAGNOSTICS FOR HETEROSKEDASTICITY
RANDOM COEFFICIENTS
TEST DF VALUE PROB Breusch-Pagan test 5 39.6290 0.00000 Koenker-Bassett test 5 16.6735 0.00516 SPECIFICATION ROBUST TEST
TEST DF VALUE PROB White 20 36.0450 0.01519
30 FOR WEIGHT MATRIX: DZA_adm1
(Row-standardized weights)
TEST MI/DF VALUE PROB Moran's I (error) -0.0058 -1.#IND 1.#QNAN Lagrange Multiplier (lag) 1 0.0609 0.80513 Robust LM (lag) 1 0.0399 0.84165 Lagrange Multiplier (error) 1 0.0287 0.86559 Robust LM (error) 1 0.0077 0.93009 Lagrange Multiplier (SARMA) 2 0.0686 0.9663