HAL Id: in2p3-00025085
http://hal.in2p3.fr/in2p3-00025085
Submitted on 18 Nov 2005
HAL is a multi-disciplinary open access
archive for the deposit and dissemination of
sci-entific research documents, whether they are
pub-lished or not. The documents may come from
teaching and research institutions in France or
abroad, or from public or private research centers.
L’archive ouverte pluridisciplinaire HAL, est
destinée au dépôt et à la diffusion de documents
scientifiques de niveau recherche, publiés ou non,
émanant des établissements d’enseignement et de
recherche français ou étrangers, des laboratoires
publics ou privés.
D. Ardouin, A. Belletoile, Didier Charrier, Richard Dallier, L. Denis, P.
Eschstruth, T. Gousset, Fayrouz. Haddad, J. Lamblin, Pascal Lautridou, et al.
To cite this version:
D. Ardouin, A. Belletoile, Didier Charrier, Richard Dallier, L. Denis, et al.. CODALEMA: a cosmic
ray air shower radio detection experiment. International Workshop on Acoustic and Radio EeV
Neu-trino detection Activities, May 2005, Zeuthen, Germany. pp.192-196, �10.1142/S0217751X0603360X�.
�in2p3-00025085�
CODALEMA: A COSMIC RAY AIR SHOWER RADIO DETECTION EXPERIMENT
D. ARDOUINA, A. BELLETOILEA, D. CHARRIERA, R. DALLIERA, L. DENISB, P. ESCHSTRUTHC, T. GOUSSETA, F. HADDADA,
J. LAMBLINA, P. LAUTRIDOUA, A. LECACHEUXD, D. MONNIER-RAGAIGNEC, O. RAVELA
(A) SUBATECH, 4 rue Alfred Kastler, BP20722, F44307 Nantes cedex 3, France
(B) Observatoire de Paris - Station de radioastronomie, F18330 Nan¸cay, France (C) LAL, Universit´e Paris-Sud, Bˆatiment 200, BP 34, F91898 Orsay cedex,
France
(D) LESIA, Observatoire de Paris - Section de Meudon, 5 place Jules Janssen, F92195 Meudon cedex, France
The CODALEMA experimental device currently detects and characterizes the ra-dio contribution of cosmic ray air showers : arrival directions and electric field topologies of radio transient signals associated to cosmic rays are extracted from the antenna signals. The measured rate, about 1 event per day, corresponds to an
energy threshold around 5.1016
eV. These results allow to determine the perspec-tives offered by the present experimental design for radiodetection of Ultra High Energy Cosmic Rays at a larger scale.
1. Experiment and event selection
Radio emission associated with the development of Extensive Air Showers (EAS) initiated by high energy cosmic rays was investigated in the 1960’s1
. A flurry of experiments provided initial informations about signals from 1017
eV cosmic rays 2
, but plagued by difficulties (poor reproducibility, atmospheric effects, technical limitations) efforts almost ceased in the late 1970’s to the benefit of ground particle detection and fluorescence. With the advent of cosmic ray research involving giant surface detectors as in the Auger experiment3
, the radio detection, with a potential 100% duty cycle and a sensitivity to the longitudinal development of the showers, is now re-considered. In recent years, with the availability of new electronics, several groups have undertaken the task of reinvestigating the phenomenology of radio pulses 4,5 which are in a large extent a terra incognita. Using our
2
experiment CODALEMA (COsmic ray Detection Array with Logarithmic ElectroMagnetic Antennas), located at the Nan¸cay radio observatory, firm evidence for a radio emission counterpart of cosmic ray air showers has been obtained.
Current experimental setup has been described along with detection and analysis methods in a previous paper 6
. It uses 11 log-periodic antennas of the type constituting the Nan¸cay DecAMetric array (DAM) 7
and 4 particle detectors originally designed as prototype detectors for the Auger array8
. Seven antennas are equally distributed along a 600 m, East-West line, and 4 other antennas are located on a 85 m side square at the North of this line. The antenna signals are band pass filtered (24-82 MHz) and are recorded, after RF signal amplification, by LeCroy digital oscilloscopes (8-bit ADC, 500 MHz sampling frequency, 10 µs recording time). The four 2.3 m2
particle detector modules (stations) are located on a 7.103
m2
square area around the 4 northern antennas. Each station has two layers of acrylic scintillators, read out by a copper housed photomultiplier placed at the center of each sheet. The whole experiment is triggered by a fourfold coincidence from those stations in a 600 ns time window, at a rate of 0.7 event per minute. Considering the active area of the particle detector array of 7.103
m2
and the arrival direction distribution of the shower, a value of 16.103
m2
.sr is obtained for the acceptance, which corresponds to a trigger energy threshold of about 1.1015
eV.
For each fourfold coincidence from the particle detectors, the 11 an-tenna signals are recorded. Due to the relatively low energy threshold, only a small fraction of these air shower events is expected to be accompanied by significant radio signals. The recognition of the radio transients is made during an offline analysis 6
. Radio signals are first 37-70 MHz numeri-cally filtered to detect radio transient. The maximum voltage is searched in a given time window of 2 µs width, correlated to the trigger time, and compared to a threshold based on the noise level estimation outside this window. If the threshold condition is fulfilled, the instant of the maximum voltage sets the arrival time and the antenna is flagged. When at least 3 antennas are flagged, a triangulation procedure calculates the arrival direc-tion of the radio wave using a plane front fit. At this level of selecdirec-tion, the couting rate is about one event every two hours.
A stronger selection among these candidates is obtained using the arrival time distribution. It refers the radio wavefront arrival time at a particular point, as determined by antenna triangulation, to the particle front time extracted from the scintillator signals. This time difference distribution is
−10000 −500 0 500 1000 10 20 30 40 50 ∆ Time (ns) Number of events 0 5 10 15 20 0 5 10 15 20 25 30 35 40
Angular difference (deg)
Number of events
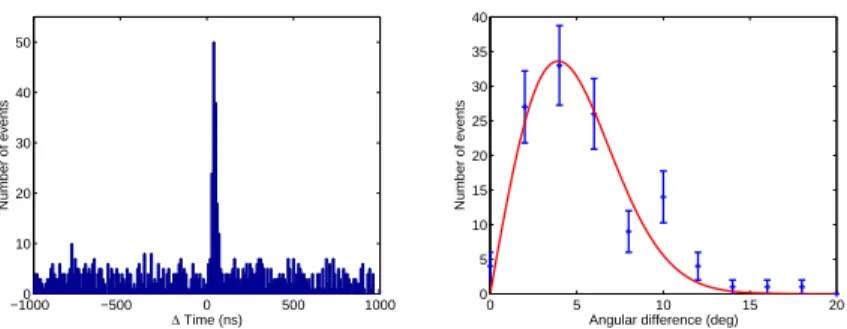
Figure 1. Left: Distribution of time delays between the radio plane front and the
parti-cle plane front. Right: Angular difference distribution with a time cut around the peak and fit by the expected analytical form (red/full line). Errors bars are calculated as the square root of the number of events in the bin.
shown in Fig. 1-left. A very sharp peak (a few tens of nanoseconds) is ob-tained, showing an unambiguous correlation between some radio events and the particle triggers, whereas the flat distribution corresponds to accidental radio transients which are not associated with air showers but occured in the 2 µs window where the search is conducted. Being uncorrelated to the particles, these events fill an uniform arrival time distribution. EAS events are those for which the arrival time difference between the two detector systems is within 100 ns, i.e. in the main peak of Fig. 1-left.
If these time-correlated events correspond to EAS, the arrival directions reconstructed from both scintillator and antenna data should be strongly correlated. Indeed, for these events arrival directions obtained by both par-ticle and radio signals are the same within 15 degrees whereas the angle for an uncorrelated event is much bigger, its arrival direction given by the an-tennas being often close to the horizon. This is typical of events from radio interference due to human activity. The angular difference distribution of time-correlated events (Fig. 1-right) can be fit by a gaussian distribution centered on zero multiplied by a sine function coming from the solid angle factor. The standard deviation of the corresponding gaussian is about 4 degrees. This value includes the reconstruction accuracy of both detectors. After this sorting, confirmed EAS radio event counting rate falls down to 1 event per day, which corresponds to an energy threshold of about 5.1016
eV for the antenna array with an assumed acceptance of 16.103
m2
.sr. At the end of these analysis procedures, physical characteristics of the radio EAS events can be extracted.
4
2. EAS electric field distribution
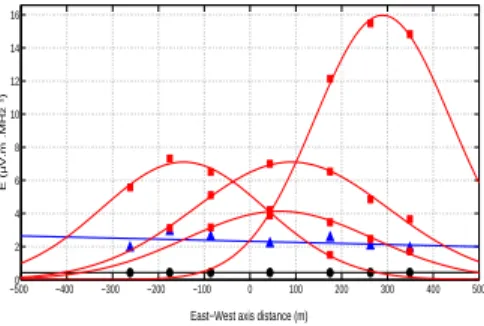
Due to the limited extent of the North-South axis of the array, the electric field distribution has been extracted mainly along the East-West axis. An-tenna responses were cross-calibrated and gains adjusted within a few %. Distributions for 4 illustrative radio EAS events are shown on the Fig. 2 (with a gaussian fit to guide the eye). A fortuitous event (triangles) and the threshold level of our setup illustrating the amount of useful signal received (circles) are also displayed. The fortuitous event was identified as resulting from an anthropic source and rejected from EAS candidate status.
−5000 −400 −300 −200 −100 0 100 200 300 400 500 2 4 6 8 10 12 14 16
East−West axis distance (m)
E (µV.m¯.MHz¯¹)
Figure 2. Profile of the maximum voltage (corrected from the cable attenuations and
the amplifier gains) recorded on the antennas in the East-West direction for 4 EAS events (squares, gaussian fit: red/full line), an anthropic transient (triangles, fit: blue/dashed line) and detection threshold (circles, fit: black/dash-dotted line).
Topologies are clearly different between EAS and anthropic events. The anthropic event presents an electric field topology with a nearly linear am-plitude which is not expected for an EAS candidate falling in the vicinity of the array. EAS events show highly variable field amplitudes depending on the position on the E-W axis. The widths of the distributions observed on an event by event basis is probably related to the dependence on both shower energy and zenithal angle. The projected core locations have been estimated only for events falling inside the surface delimited by the extremi-ties of our antenna array (highly limited by the North-South extent)9
. The differences between electric field topologies depending on its origin (EAS or anthropic) could constitute one decisive criterion to select EAS events when using a self triggered antenna system. In other words, it means that it is feasible to build a radiodetection experiment able to discriminate EAS events by itself.
3. Conclusions
Electric field transients generated by extensive air showers have been mea-sured with CODALEMA. The current effective counting rate of 1 event/day leads to an energy threshold around 5.1016
eV. Electric field spread related to energy and core location of an EAS can be determined on an event by event basis. It is now possible to discriminate an EAS event from a fortuitous one using only antennas and no particle detector. This is one further step towards a stand-alone system that could be deployed over a large area. Improvements are in progress: setting up of additional scintilla-tors will make possible an independant determination of the shower energy and core position; extension of the N-S antenna line will enable to better sample the radio signal spread; increase of the ADC dynamics using 12-bit encoding will allow to record the full 1 MHz - 100 MHz frequency band, and shower parameters could then be inferred from the full signal shape6
. In a subsequent upgrade, it is planned to install autonomous dipoles equipped with active front-end electronics, self-triggered and self-time-tagged. This is part of current investigations on the feasibility of adding radio detec-tion techniques to an existing surface detector such as the Pierre Auger Observatory. In the future, we expect that the radio signals should pro-vide complementary information about the longitudinal development of the shower, as well as the ability to lower the energy threshold.
References
1. G.A. Askar’yan, Soviet Physics, J.E.T.P., 14, (2) 441 (1962)
2. H.R. Allan, in: Progress in elementary particle and cosmic ray physics, ed. by J.G. Wilson and S.A. Wouthuysen (North Holland, 1971), p. 169. 3. Auger Collaboration, Nucl. Instrum. Meth. A523, 50 (2004).
4. K. Green et al, Nucl. Instrum. Meth. A498, 256 (2003).
5. H. Falcke et al (LOPES Collaboration), Nature, May 19 (2005).
6. D. Ardouin et al (CODALEMA Collaboration), to appear in Nucl. Inst. and Meth. - A (2005), astro-ph/0504297.
7. http://www.obs-nancay.fr/
8. M. Boratav et al, The AUGER Project: First Results from the Orsay Pro-totype Station, Proceedings of the 24th ICRC, Rome, 954 (1995).
9. D. Ardouin et al (CODALEMA Collaboration), in Proceedings of the XXXIXth Rencontres de Moriond “Very High Energy Phenomena in the Universe”, La Thuile, Italy (2005), astro-ph/0505442.