HAL Id: hal-02650798
https://hal.inrae.fr/hal-02650798
Submitted on 29 May 2020
HAL is a multi-disciplinary open access
archive for the deposit and dissemination of
sci-entific research documents, whether they are
pub-lished or not. The documents may come from
teaching and research institutions in France or
abroad, or from public or private research centers.
L’archive ouverte pluridisciplinaire HAL, est
destinée au dépôt et à la diffusion de documents
scientifiques de niveau recherche, publiés ou non,
émanant des établissements d’enseignement et de
recherche français ou étrangers, des laboratoires
publics ou privés.
The Zebrafish as a New Model for the In Vivo Study of
Shigella flexneri Interaction with Phagocytes and
Bacterial Autophagy
Serge Mostowy, Laurent Boucontet, Maria J. Mazon Moya, Andrea Sirianni,
Pierre Boudinot, Michael Hollinshead, Pascale Cossart, Philippe Herbomel,
Jean-Pierre Levraud, Emma Colucci-Guyon
To cite this version:
Serge Mostowy, Laurent Boucontet, Maria J. Mazon Moya, Andrea Sirianni, Pierre Boudinot, et al..
The Zebrafish as a New Model for the In Vivo Study of Shigella flexneri Interaction with Phagocytes
and Bacterial Autophagy. PLoS Pathogens, Public Library of Science, 2013, 9 (9),
�10.1371/jour-nal.ppat.1003588�. �hal-02650798�
The Zebrafish as a New Model for the
In Vivo
Study of
Shigella flexneri
Interaction with Phagocytes and
Bacterial Autophagy
Serge Mostowy1,2,3,4*, Laurent Boucontet5,6, Maria J. Mazon Moya1, Andrea Sirianni1, Pierre Boudinot7, Michael Hollinshead8, Pascale Cossart2,3,4, Philippe Herbomel5,6, Jean-Pierre Levraud5,6,
Emma Colucci-Guyon5,6*
1 Section of Microbiology, MRC Centre for Molecular Bacteriology and Infection, Imperial College London, London, United Kingdom, 2 Institut Pasteur, Unite´ des Interactions Bacte´ries-Cellules, De´partement de Biologie Cellulaire et Infection, Paris, France,3 Inserm, U604, Paris, France, 4 INRA, USC2020, Paris, France, 5 Institut Pasteur, Unite´ Macrophages et De´veloppement de l’Immunite´, De´partement de Biologie du De´veloppement et des Cellules Souches, Paris, France,6 CNRS, URA2578, Paris, France,7 INRA, Virologie et Immunologie Mole´culaire, Jouy-en-Josas, France, 8 Section of Virology, Faculty of Medicine, Imperial College London, London, United Kingdom
Abstract
Autophagy, an ancient and highly conserved intracellular degradation process, is viewed as a critical component of innate immunity because of its ability to deliver cytosolic bacteria to the lysosome. However, the role of bacterial autophagy in vivo remains poorly understood. The zebrafish (Danio rerio) has emerged as a vertebrate model for the study of infections because it is optically accessible at the larval stages when the innate immune system is already functional. Here, we have characterized the susceptibility of zebrafish larvae to Shigella flexneri, a paradigm for bacterial autophagy, and have used this model to study Shigella-phagocyte interactions in vivo. Depending on the dose, S. flexneri injected in zebrafish larvae were either cleared in a few days or resulted in a progressive and ultimately fatal infection. Using high resolution live imaging, we found that S. flexneri were rapidly engulfed by macrophages and neutrophils; moreover we discovered a scavenger role for neutrophils in eliminating infected dead macrophages and non-immune cell types that failed to control Shigella infection. We observed that intracellular S. flexneri could escape to the cytosol, induce septin caging and be targeted to autophagy in vivo. Depletion of p62 (sequestosome 1 or SQSTM1), an adaptor protein critical for bacterial autophagy in vitro, significantly increased bacterial burden and host susceptibility to infection. These results show the zebrafish larva as a new model for the study of S. flexneri interaction with phagocytes, and the manipulation of autophagy for anti-bacterial therapy in vivo.
Citation: Mostowy S, Boucontet L, Mazon Moya MJ, Sirianni A, Boudinot P, et al. (2013) The Zebrafish as a New Model for the In Vivo Study of Shigella flexneri Interaction with Phagocytes and Bacterial Autophagy. PLoS Pathog 9(9): e1003588. doi:10.1371/journal.ppat.1003588
Editor: Steven R. Blanke, University of Illinois, United States of America
Received January 29, 2013; Accepted July 19, 2013; Published September 5, 2013
Copyright: ß 2013 Mostowy et al. This is an open-access article distributed under the terms of the Creative Commons Attribution License, which permits unrestricted use, distribution, and reproduction in any medium, provided the original author and source are credited.
Funding: Funding for this work was provided by a Programmes Transversaux de Recherche (PTR) grant from Institut Pasteur to SM, LB and ECG (PTR#372) and by a Zebraflam grant from Agence Nationale de Recherche (ANR-10-MIDI-009). Work in the SM laboratory is supported by a Wellcome Trust Research Career Development Fellowship [WT097411MA]. The funders had no role in study design, data collection and analysis, decision to publish, or preparation of the manuscript.
Competing Interests: The authors have declared that no competing interests exist. * E-mail: s.mostowy@imperial.ac.uk (SM); emma.colucci@pasteur.fr (ECG)
Introduction
Macroautophagy (hereafter referred to as autophagy) is an intracellular degradation process by which cytosolic materials are delivered to the lysosome. The canonical autophagy pathway involves the initiation and elongation of double-membrane autophagosomes to sequester cargo, and this process requires 36 autophagy-related (ATG) proteins conserved from yeast to man [1]. Autophagy has diverse functions in important cellular processes such as development, aging and inflammation, and is also linked to a wide range of disease states including microbial infection [2,3]. By binding to ATG8 family proteins and delivering them to recognized cargo, autophagy receptors can mediate selective targeting of intracellular bacteria to autophagy [4,5]. p62 (sequestosome 1 or SQSTM1) is a well-characterized autophagy receptor [6] and belongs to a newfound category of pattern recognition receptors called SLRs (sequestosome 1/p62-like
receptors) linking autophagy to innate immunity [7]. Discovered almost 10 years ago, bacterial autophagy has been highlighted as a fundamental host cell response to bacterial invasion in vitro by degrading intracellular pathogens including Shigella flexneri [8], Listeria monocytogenes [9], Salmonella Typhimurium [10] and Myco-bacterium tuberculosis [11]. Since then, research in the field has exploded, revealing that some pathogens may avoid autophagy-mediated degradation while others may exploit the autophagy machinery for intracellular survival [12,13]. However, few in vivo studies have been performed and, as a result, the consequence of bacterial autophagy on disease outcome remains obscure.
S. flexneri are human-adapted Escherichia coli that have gained the ability to invade the colonic mucosa, causing inflammation and diarrhea. The intracellular lifestyle of this pathogen has been well-studied in vitro, and Shigella has recently gained recognition as a paradigm of bacterial autophagy [8,12–16]. Once in the cytosol, the actin-based motility of Shigella is counteracted by
septin cage-like structures that target bacteria to p62-mediated autophagy [14,15]. Septins are GTP-binding proteins that form higher-order structures including filaments and rings, and are viewed as a distinct component of the cytoskeleton [17]. The precise role of septins in autophagy is unknown, yet work has shown that septins may help to scaffold the autophagy machinery around actin-polymerizing bacteria [14,15]. Now, a major issue is to demonstrate the significance of these molecular and cellular events in vivo using relevant animal models.
To explore the innate immune response to Shigella, several infection models have been useful [18,19], however, these mammalian models remain poorly suited to image the cell biology of Shigella infection in vivo. The zebrafish has recently emerged as a non-mammalian vertebrate model to study the development and function of the immune system [20,21]. It is a genetically tractable organism, sharing many immune pathways and cell types with mammals [22]. The natural translucency of zebrafish larvae enables non-invasive in vivo imaging of individual cells and microbe-phagocyte interactions at high resolution throughout the organism [23–32]. While zebrafish larvae have been used to study infection by many different bacteria ([23–32], reviewed in [33]), including E. coli [26], L. monocytogenes [24] and M. marinum [25], Shigella infection has not yet been studied in this model. Considering that, at the cellular level, the infectious process for S. flexneri is similar to that of L. monocytogenes and M. marinum, i.e., these bacteria escape from the phagocytic vacuole to the cytosol where they form actin tails or are recognized by autophagy [15,34–36], we chose to investigate the outcome of experimental shigellosis and the role of autophagy in zebrafish larvae.
We first established that Shigella is pathogenic for zebrafish larvae, and characterized the lethal dose and kinetics of the infection following microinjection. Inoculated S. flexneri were rapidly engulfed by macrophages and neutrophils, and these events could be captured in real time, highlighting a scavenger role for neutrophils in eliminating infected macrophages and non-immune cell types that have failed to control Shigella infection. Strikingly, the number of both macrophages and neutrophils dramatically decreased in larvae unable to control Shigella
proliferation, and leukocyte depletion was associated with bacter-emia preceding the death of the larvae. We also observed that intracellular S. flexneri could escape to the cytosol, induce septin caging and be targeted to autophagy in vivo. We then used Shigella infection of the zebrafish to study the role of bacterial autophagy in vivo, and showed that the depletion of p62-mediated autophagy significantly increased bacterial burden and zebrafish mortality. These data highlight the zebrafish model to study S. flexneri interaction with phagocytes in vivo. Moreover, the zebrafish constitutes a valuable system to develop new strategies aimed at pathogen clearance by manipulation of anti-bacterial autophagy.
Results
Shigella flexneri can invade zebrafish cells, escape from the phagosome and induce septin caging at 28uC
The infection cycle of Shigella in human cells is well understood. After internalization, Shigella escape from the phagocytic vacuole to the cytosol where they may be recognized by septin cages and autophagy [14,15]. As Shigella is not a natural pathogen of fish and grows optimally at 37uC, initial experiments sought to determine whether the hallmarks of the Shigella infection cycle - invasion, phagosome escape and cytoskeleton reorganization- could be reproduced at 28uC, the optimal growth temperature of zebrafish. To test this, we first established a zebrafish fibroblast-like cell line (ZF-AB; see Materials and Methods) that we could infect in vitro. The septins are a family of proteins required for the autophagy of Shigella in human cells, and SEPT7 in particular is essential for mammalian septin function [17]. Pan et al. reported a sept7 orthologue in zebrafish [37], and our own search of the most recent zebrafish genome assembly (zv9, www.ensembl.org) and EST databases identified three genes encoding proteins highly similar to the human protein (Fig. S1A), with predicted molecular weights of 48–49 kDa. This close similarity indicated that an antibody raised against human SEPT7 was likely to cross-react with the zebrafish proteins. Indeed, using a human SEPT7 antibody, Western blotting of zebrafish lysates revealed proteins at 49 and 44 kDa (Fig. 1A and S1B), and immunofluorescent labeling of ZF-AB cells revealed septin filaments partially overlapping with the actin cytoskeleton (Fig. 1B), in agreement with what is known in mammalian cells [38,39]. We then infected ZF-AB cells with S. flexneri M90T. As observed with the human epithelial cell line HeLa infected at 28uC (Fig. S1C) and at 37uC [14,15], Shigella invaded ZF-AB cells and induced the formation of septin cages (Fig. 1B), demonstrating that Shigella can enter the cytosol of zebrafish cells and be targeted to autophagy. These results strongly suggest that the virulence factors required for Shigella invasion, escape from the phagocytic vacuole and replication in the cytosol can be expressed and are functional at 28uC, the most commonly used temperature for zebrafish rearing.
Zebrafish larvae are susceptible to intravenous S. flexneri infection
We next sought to establish whether S. flexneri could cause disease in zebrafish swimming larvae. Larvae aged 72 h post fertilization (hpf) were microinjected intravenously (iv) near the cloaca (ugo) with a range of doses of wild-type S. flexneri (Fig. 1C), and their survival at 28uC was assessed by regular observation with a stereomicroscope. For Shigella doses 103CFU or less, there was 100% survival of the infected larvae; in contrast, a typical inoculum of 46103Shigella resulted in the death of most larvae within 48 hours post infection (hpi) (Fig. 1D). Of note, larvae injected with a comparable (or even higher) inoculum of type III secretion system (T3SS) deficient (T3SS2) Shigella (DmxiD strain;
Author Summary
Autophagy, an ancient and highly conserved intracellular degradation process, is viewed as a critical component of innate immunity because of its ability to deliver cytosolic bacteria to the lysosome. However, a complete under-standing of the molecules and mechanisms restricting cytosolic bacteria has not been obtained, and the role of bacterial autophagy in vivo remains poorly understood. Shigella flexneri are human-adapted Escherichia coli that have gained the ability to invade the colonic mucosa, causing inflammation and diarrhea. The intracellular lifestyle of this pathogen has been well-studied in vitro, and Shigella has recently gained recognition as a paradigm of bacterial autophagy. We show that the zebrafish larva represents a valuable new host for the analysis of S. flexneri infection. Interactions between bacteria and host phago-cytes can be imaged at high resolution in vivo, and the zebrafish model should prove useful for understanding the cell biology of Shigella infection. We use zebrafish larvae to investigate the role of bacterial autophagy in host defense, and observed that the perturbation of autophagy can adversely affect host survival in response to Shigella infection. Therefore, the zebrafish constitutes a valuable system to develop new strategies aimed at pathogen clearance by manipulation of anti-bacterial autophagy.
Fig. S1D) or the closely related, but non-pathogenic, E. coli K12 (data not shown and [26]) always survived for the entire time of observation.
We followed the progression of infection using two approaches. First, to monitor the replication of bacteria in the host, we measured the amount of viable bacteria within larvae at various
Figure 1. Characterization of zebrafish cells and infection withShigella. A. Western blots of larval extracts, using antibodies against SEPT7 or elongation factor 1-a (EF1a). See Fig. S1B for complete lane of SEPT7 blot and antibody specificity. B. Immunofluoresence microscopy of ZF-AB cells. F-actin (green), SEPT7 (red), DAPI (blue). Top: uninfected cell; note colocalization of actin and SEPT7 filaments (arrows). Bottom: Shigella-infected cell; note septin cage-like structure surrounding DAPI-labeled Shigella (arrow). Scale bar, 4 mm. C. Scheme of a 72 hpf larva (length ,3.5 mm), showing the duct of Cuvier (the wide vessel flowing over the yolk; black arrowhead), also called common cardinal vein, and the iv injection site (red arrowhead) in the tail vein just caudal to the urogenital opening (ugo). D. Survival curves of 72 hpf larvae injected with various doses of S. flexneri and incubated at 28uC for 48 hpi. The effective inoculum, quantified a posteriori, was classified as low (,103
CFU, open circles; effective range: 1.5– 9.96102CFU), medium (,46103CFU, open triangles; effective range: 1.3–6.06103CFU) or high (,104CFU, open squares; effective range: 7.8–
34.26103CFU). Mean6SEM of n = 10–24 larvae per group from 3 or more independent experiments per inoculum class. E. Enumeration of live bacteria in homogenates from individual larvae at various times post infection measured by plating onto LB. Low dose inoculum = open circles. Medium or high dose inoculum = open squares. Of note, dead larvae at 24 or 48 hpi (overwhelmed with bacteria, as determined by fluorescence stereomicroscopy) were not included here, and only larvae having survived the infection (thus far) were included here (and in this case, statistics are in grey). Mean6SEM also shown (horizontal bars). Significance testing performed by Student’s t test. ns, P.0.05; ***, P,0.001. F. Distribution of bacteria (GFP-Shigella) determined by live imaging using a fluorescence stereomicroscope at various times post injection of a low, medium or high dose inoculum. Overlay of transmission image (grey) and GFP fluorescence (green).
doi:10.1371/journal.ppat.1003588.g001
time points by plating serial dilutions of homogenates of euthanized animals onto bacterial culture dishes. As shown in Fig. 1E, the survival of the larvae was closely associated with the clearance of the inoculated bacteria. Larvae inoculated with a low dose (,103CFU) progressively cleared bacteria, with a burden reduced by .90% within 48 hrs. In contrast, in larvae inoculated with a high dose, S. flexneri numbers increased ,30fold in the first 24 h; by 48 hpi, most larvae were dead, although in a minority of survivors the bacterial load declined. During infections using comparable or higher inocula of T3SS2 Shigella (Fig. S1E) or E. coli (data not shown and [26]), bacterial numbers always decreased over time, with only a few viable bacteria able to persist for 48 h at highest doses.
As a second approach to follow the progression of infection, larvae were infected with sublethal or lethal inocula of fluorescent S. flexneri M90T, i.e. GFP-Shigella, and were analyzed by fluorescence microscopy. Large clusters (,102 bacteria or more) were detectable using a fluorescence stereomicroscope (Fig. 1F, see also Fig. 2 below), while smaller groups and single bacteria could be viewed at higher magnifications using widefield or confocal fluorescence microscopy (see below e.g., Fig. 3, 4). At 4 hpi with a sublethal inoculum of S. flexneri, bacterial aggregates, probably associated to phagocytes [26,40], were observed mostly in the caudal hematopoietic tissue (CHT) near the injection site, as well as in the more distant common cardinal vein over the yolk sac; the majority of the bacteria were cleared from the blood (Fig. 1F, see also Fig. S2 below). The situation was relatively similar in larvae inoculated with a lethal inoculum at 4 hpi, except for the higher number of bacterial foci observed in the CHT and over the yolk sac (Fig. 1F see also Fig. S2 below). However, the infection course by 24 hpi was radically different between the sublethal and lethal inocula. At this time point, larvae that received a sublethal inoculum had almost all cleared the infection, showing few foci of Shigella mainly located near the injection point in the caudal part of the larvae. In contrast, larvae that received a lethal inoculum showed a massive infection at 24 hpi, with Shigella abundant in the blood (i.e., bacteremia) and in the tissues near the site of injection (Fig. 1F, see also Fig. S2 below).
We observed that larvae that controlled the bacterial prolifer-ation within 24 hpi usually survived. By comparison, inoculprolifer-ation of fluorescent T3SS2 Shigella or E. coli yielded an initial distribution of bacteria (at 4 hpi) very similar to that of wildtype Shigella. However, neither T3SS2 Shigella (data not shown) nor E. coli (data not shown and [26]) were proliferating and bacterial numbers always decreased over time (in agreement with CFU enumeration, Fig. S1E). These data strongly suggest that virulence factors required for Shigella pathogenesis are expressed during infection of zebrafish larvae at 28uC. Actin tail and septin cage formation are critically dependent upon expression of Shigella virulence factors icsA (T3SS independent) and icsB (T3SS dependent) [14,15]. By extracting RNA from zebrafish larvae infected with Shigella, the expression of icsA and icsB were clearly detected at 4, 12 and 24 hpi (Fig. S1F). In agreement with observations from survival assays (Fig. 1D), CFU enumerations (Fig. 1E) and live confocal fluorescence microscopy (see below, e.g., Video S1, S3, S5), these data indicate that Shigella virulence factors are expressed at 28uC during infection of zebrafish larvae. They also show that zebrafish larvae are susceptible to S. flexneri, suggesting their applicability to study the innate immune response to Shigella infection.
Macrophage and neutrophil behaviour upon Shigella infection
To analyse macrophage and neutrophil behaviour in vivo upon Shigella infection, transgenic zebrafish larvae (3 dpf) harboring red
macrophages (Tg(mpeg1:Gal4-FF)gl25 /Tg(UAS-E1b:nfsB.mCher-ry)c264, herein referred as mpeg1:G/U:mCherry) or red neutrophils (Tg(lyz:dsRed)nz50, herein referred to as lyz:dsRed) were inoculated with sublethal or lethal inocula of GFP-Shigella, and macrophages and neutrophils upon Shigella infection were followed in vivo using widefield fluorescence microscopy. Strikingly, the number of both macrophages and neutrophils appeared to decrease strongly in larvae unable to control Shigella proliferation, and leukocyte depletion was associated with bacteremia preceding larval death (Fig. 2A, S2). To more precisely quantify macrophages and neutrophils, we fixed larvae at 4 or 24 hpi, stained them with anti-dsRed and anti-GFP antibodies to label leukocytes and GFP-Shigella respectively, and counted the number of labeled macro-phages and neutrophils per larva (Fig. 2B). Macrophage counts significantly decreased both in lethally (P,0.001) and sublethally (P,0.001) infected animals, suggesting that macrophages undergo cell death in vivo following Shigella ingestion. The number of neutrophils also significantly declined in lethally inoculated larvae (P,0.001), with an almost total neutrophil depletion by 24 hpi. In contrast, larvae controlling Shigella infection did not show a decrease in neutrophil number (P.0.05).
A scavenger role for neutrophils during Shigella infection
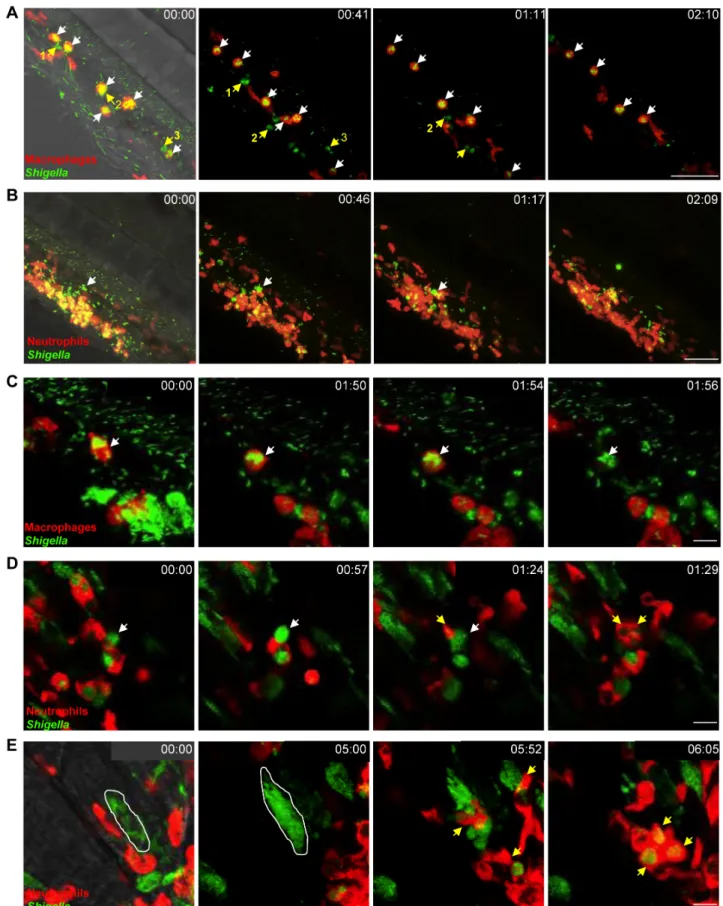
To analyse in detail Shigella-phagocyte interactions in vivo, transgenic 3 dpf zebrafish larvae harboring red macrophages (mpeg1:G/U:mCherry) or red neutrophils (lyz:dsRed) were inocu-lated with sublethal doses of GFP-Shigella, and Shigella-phagocyte interactions were captured immediately thereafter using high resolution fluorescence confocal microscopy. Although only one of the two phagocyte populations was labelled in each of these experiments, non-labelled cells containing pooled GFP-Shigella could generally be assigned to the other phagocyte population in a non-ambiguous manner, based on their localization and motility [24,26]. As soon as 20 min post infection (the earliest possible time point in our experimental setup), we observed that most blood borne bacteria were stuck on, or were already engulfed by, macrophages and few interacted with neutrophils (Fig. 3A, Video S1, data not shown), as previously observed using non-pathogenic E. coli [26] or Listeria [24]. However, unlike T3SS- Shigella (Fig. S3A, Video S2) or E. coli [26] which is degraded inside macrophages, we observed that wildtype Shigella were able to survive in macrophages and then the infected macrophages would burst (Fig. 3A, Fig. S3B, Video S1; see also Video S3). By contrast, neutrophils having phagocytosed similar amounts of Shigella quickly degraded the engulfed bacteria, as indicated by the diffuse GFP staining that transiently accumulated in these cells (Fig. 3B, Video S4; see also Fig. 3A, Video S1).
It is known that in vitro human macrophages infected by Shigella undergo cell death [41]. We also observed this phenomenon in zebrafish macrophages in vivo (Fig. 3C, Video S5; see also Video S4). To further investigate cell death induced upon Shigella infection, we performed TUNEL labeling of infected larvae and detected host cell DNA damage, a hallmark of cell death. Infected leukocytes were clearly labeled by TUNEL (Fig. S3C). Strikingly, we found that macrophages dead from Shigella infection were frequently engulfed by patrolling neutrophils, suggesting a newfound scavenger role for neutrophils during Shigella infection (Fig. 3D, Video S6; see also Video S4). In support of our live imaging studies, analysis by electron microscopy also highlighted that membrane and DNA from infected, dead cells are engulfed by leukocytes in vivo (Fig. S3D, S3E).
It is also well known that Shigella are able to actively invade non-immune cell types such as epithelial cells [42]. In zebrafish, invasion of some muscle fibers near the point of inoculation was
Figure 2. Macrophage and neutrophil depletion uponShigellainfection. A. mpeg1:G/U:mCherry (red macrophages) and lyz:dsRed (red neutrophils) 3 dpf larvae were infected with sublethal or lethal GFP-Shigella inocula, fixed 4 and 24 hpi and leukocyte and bacteria labeled using anti-dsRed (red) and anti-GFP (green) antibodies. 4 and 24 hpi uninfected (CTRL), sublethal and lethal inoculated mpeg1:G/U:mCherry and lyz:anti-dsRed fish are shown. Fixed, labeled whole larvae were imaged using a fluorescent stereomicroscope. Overlay of green and red fluorescence. B. Macrophage Zebra-phagy
observable from 5hpi (Fig. 3E, Video S7). We observed that Shigella were able to replicate within non-immune cells, which died after a few hours, releasing debris and bacteria that were quickly cleared by neutrophils (Fig. 3E, Video S7). We never observed bacterial invasion and/or replication in vivo with T3SS- Shigella (data not shown) nor E. coli (data not shown and [26]).
Collectively, these results demonstrate that, in vivo, Shigella is able to survive and replicate in macrophages and in some non-immune cells, ultimately leading to their death. Our results also highlight a scavenger role for neutrophils in engulfing and eliminating infected macrophages and non-immune cell types that have failed to control Shigella infection.
Shigella escape to the cytosol and induce septin caging and autophagy in zebrafish larvae in vivo
We observed that in some cells (e.g., such as the macrophage or the muscle fiber displayed in Fig. 3D or 3E) Shigella seemed to occupy the entire cell (rather than a compartmentalized vacuole) strongly suggesting bacterial invasion of the cytosol. Because this cannot be fully ascertained from these live images, we fixed and labeled infected larvae for confocal microscopy to investigate the recruitment of septin cages to GFP-Shigella, a hallmark of cytosolic invasion [15]. In every larva infected (at 4 or 24 hpi), some GFP-Shigella were surrounded by SEPT7 cage-like structures. Confocal microscopy and deconvolution was used to obtain a high-resolution image of fluorescently-labeled assemblies and showed that septin structures assembled into cages around individual Shigella (Fig. 4A), in complete agreement with dimensions obtained from Shigella-septin cages measured in human cells [15]. Thus, in vivo, Shigella are able to invade the cytosol where they may be directed to autophagy by septin caging.
In mammalian cells, ATG8/LC3 is the marker widely used to define autophagosomes [43,44]. Zebrafish Lc3 is an ATG8 homologue, and to confirm the targeting of bacteria to autophagy in zebrafish we infected transgenic GFP-Lc3 zebrafish larvae with Shigella. GFP-Lc3 was clearly recruited to intracellular Shigella in vivo (Fig. 4B, Video S8). Ultrastructural analysis of Shigella-infected zebrafish by electron microscopy confirmed the sequestration of cytosolic bacteria by autophagosomes (Fig. 4C, Video S9), classically observed as a double membrane structure [43,44]. We also observed the in vivo recruitment of septin cages (Fig. S4A) and GFP-Lc3 (Fig. S4B, Video S10) to intracellular M. marinum, a natural fish pathogen previously shown in vitro to be recognized septin caging and autophagy [14,15]. Taken together, the recruitment of autophagy markers to intracellular bacteria suggest the applicability of zebrafish larvae to study the manipulation of anti-bacterial autophagy.
The autophagy receptor p62 is crucial for anti-Shigella defense in vivo
Though autophagy is considered a crucial aspect of innate immunity to Shigella, this has not yet been tested in vivo [12,13]. We proceeded to test the role of autophagy in the zebrafish response to Shigella infection. p62 is an autophagy receptor critical for autophagic recognition of bacteria in vitro, and is required for septin caging [14,15]. Our analysis of the zebrafish genome revealed a single orthologue of p62/sqstm1 (Fig. S5A). We thus designed a morpholino to knockdown p62 in zebrafish larvae
(Fig. 5A). Fish depleted of p62 developed until 72 hpf with a survival rate similar to controls (,80%), although we observed a slight developmental delay (data not shown). We then injected p62 morphants (i.e., zebrafish larvae injected with p62 morpholino oligonucleotides) with a sublethal inoculum of Shigella and observed that p62 knockdown significantly reduced host survival upon Shigella infection (P = 0.01; Fig. 5B). To understand the cause of increased death in p62 morphants, we examined the bacterial burden in these fish. CFU counts clearly showed that p62 knockdown during Shigella infection prevents bacterial clearance (Fig. 5C).
T3SS- Shigella and E. coli may not escape to the cytosol of cells that have engulfed it, and are not expected to be targeted to autophagic degradation in vivo. Thus, as a control, we infected p62 morphants with T3SS- Shigella or E. coli. In contrast to infection using wildtype Shigella, we observed that the knockdown of p62 had no impact on growth of T3SS- Shigella nor E. coli, nor did it impact zebrafish survival (Fig. S5B–S5E). These data suggest that p62-mediated autophagy is critical for the control of bacteria able to escape to the cytosol.
We tested whether the inflammatory cytokine response to Shigella was modulated by p62 knockdown. Experiments suggested that the inflammatory response was stronger in p62 morphants inoculated with Shigella (data not shown), yet these results may reflect the increased bacterial burden of p62 morphants compared to controls. Using confocal microscopy, we observed that in the absence of p62, initial bacterial engulfment by phagocytes (macrophages and neutrophils) was not affected; yet uncontrolled Shigella proliferation ensued, accompanied by the ultimate lysis of leukocytes and death of the infected larvae (Fig. 5D). These observations indicated that, as compared to control fish, p62 morphants are not able to restrict Shigella proliferation and, as a result, they are more susceptible to Shigella infection. We evaluated septin caging in p62 morphants. In every larva infected (at 4 or 24 hpi), septin recruitment to Shigella was clearly reduced (Fig. 5E), in agreement with previous in vitro work showing that septin cage assembly is more efficient once the process of autophagy has been initiated [14,15]. Together, these results strongly suggest that p62-mediated autophagy is a critical component of anti-Shigella defense in vivo.
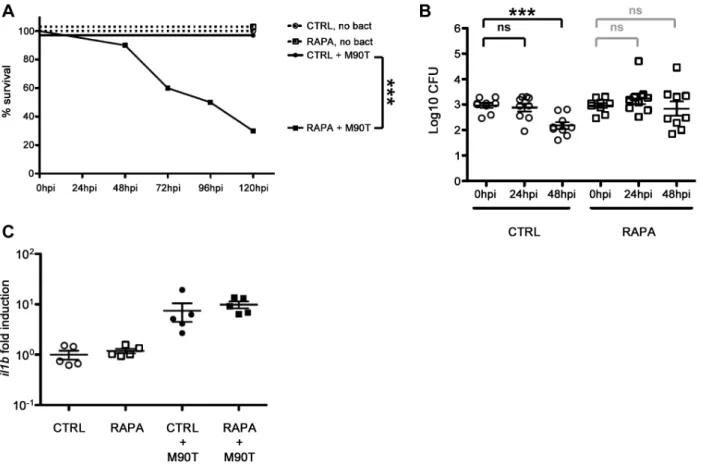
Autophagy stimulation by rapamycin does not protect fish from Shigella infection
Rapamycin is an inhibitor of mTOR, a serine/threonine protein kinase that regulates a wide range of cellular responses and is a suppressor of autophagy [45]. Autophagy is classically activated in vitro by treating cells with rapamycin, and in agreement with previous work [46,47], we observed that critical autophagy components in zebrafish larvae can respond to rapamycin, i.e., p62 is degraded and LC3-II accumulates (data not shown). Importantly, we saw no effect of rapamycin (at the dose we applied throughout this study) on the development of uninfected larvae, in agreement with a previously published study showing that rapamycin has no discernible effect on zebrafish development past 76 hpf [48].
The stimulation of autophagy by rapamycin is generally viewed as helping to clear bacterial infection [2,49]. To test this in vivo, we infected zebrafish larvae with a sublethal dose of Shigella and immediately after infection, treated these fish with rapamycin.
(left) and neutrophil (right) counts in uninfected (control, C) or upon sublethal (S) or lethal (L) Shigella injections. Macrophages and neutrophils were counted from images using ImageJ and plotted as specified in Material and Methods. Mean6SEM also shown (horizontal bars). Significance testing performed by ANOVA with Bonferroni posttest. ns, P.0.05; ***, P,0.001.
Figure 3.In vivo Shigella-phagocyte interactions. A–E: Frames extracted from in vivo time-lapse confocal imaging sessions of 3 dpf larvae injected in the bloodstream and in the adjacent mesenchyme with sublethal inocula of GFP-Shigella. Caudal area, rostral to bottom right, dorsal to top right. Overlay of green (Shigella) and red (macrophages or neutrophils) fluorescence; transmission image (grey) is also overlaid on the first frame in A, B and E as an anatomical guide. Scale bars: A–B, 50 mm; C–E, 10 mm. A. mpeg1:G/U:mCherry larva (red macrophages); first frame at 20 mpi. By 20 mpi, Shigella have already adhered to or have been engulfed by macrophages (red cells, white arrows). They persist in macrophages over time Zebra-phagy
Surprisingly, rapamycin treatment in zebrafish during Shigella infection significantly reduced host survival (P = 0.001; Fig. 6A), albeit at a slower rate than observed for p62 morphants (Fig. 5B). To understand the cause of increased death due to rapamycin treatment, we examined the bacterial burden in these fish. CFU counts showed that rapamycin treatment in zebrafish during Shigella infection may result in more bacterial growth (Fig. 6B). Using fluorescence stereomicroscopy, we confirmed that dying larvae were overwhelmed with GFP-Shigella (data not shown). We tested if an impairment of the inflammatory response could explain the enhanced susceptibility of rapamycin-treated fish; however, il1b induction was not found to be modulated by rapamycin in vivo (Fig. 6C). Moreover, rapamycin treatment of the T3SS- Shigella- or E. coli-infected larvae did not affect zebrafish survival nor bacterial load (Fig. S6A–S6D), indicating that rapamycin-treated fish are still able to mount an innate immune response.
Taken together, these results show that rapamycin treatment of bacterial infection can lead to harmful effects in vivo, unlike what may be expected from studies performed in vitro. This suggests possible difficulties in therapeutic modulation of autophagy to resolve bacterial infection, until more specific activators of autophagy are discovered.
Discussion
We describe here the successful establishment of a new S. flexneri infection model system, the larval zebrafish, which allows a detailed real-time analysis of host-pathogen interactions in vivo. Similar to other bacteria such as L. monocytogenes [24], Bacillus subtilis [23], S. Typhimurium [50] and Staphylococcus aureus [31], both S. flexneri and E. coli are quickly cleared from the bloodstream by phagocytes, notably macrophages to which they readily stick. However, while T3SS- Shigella or E. coli are rapidly degraded by phagocytes [26], we found that Shigella may persist and replicate inside macrophages, eventually killing them; by contrast, neutro-phils that have engulfed similar amounts of Shigella efficiently kill the bacteria. We also observed that Shigella is able to invade and replicate inside non-immune cells, and cytosolic invasion of Shigella was evident from the formation of septin cages and Lc3-positive autophagosomes. Phagosome escape is known to be critical for the virulence of L. monocytogenes and M. marinum in the zebrafish [24,25], and, as shown here, seems also critical for the virulence of S. flexneri in the zebrafish.
The zebrafish model of S. flexneri infection displays several interesting features. We show that pathogenesis of Shigella in zebrafish larvae in vivo is strictly dependent upon its T3SS. Previous work has shown that Shigella virulence factors may be expressed at temperatures lower than 37uC [51], and in agreement with this, we detected the expression of icsA and icsB in zebrafish
larvae infected at 28uC. We have also shown that the zebrafish larva constitutes a relevant model of human infection as regards to host-phagocyte interactions. Strikingly, the numbers of both macrophages and neutrophils dramatically decreased in larvae unable to control Shigella proliferation, and leukocyte depletion was associated with bacteremia preceding the death of the larvae. Neutrophil depletion has also been observed upon infection of zebrafish larvae with Salmonella [50] and Staphylococcus [52], upon infection of mice with Listeria [53], and may emerge to be a critical correlate of bacterial overgrowth. In humans neutropoenia is clinically predictive of failure to resolve infection, and is associated with bacteraemia that leads to a worse prognosis. The control of infection by neutrophils will deserve careful attention in future studies.
Pioneering studies performed in vitro suggested that Shigella may induce apoptosis in human macrophages [41]. More recent work has shown that Shigella-infected macrophages undergo caspase-1-mediated cell death, termed pyroptosis, which is a pathway of programmed cell death associated with an inflammatory response [54]. We have characterized cell death during Shigella infection in vivo. By live imaging we have followed the fate of individual leukocytes infected with Shigella in real time (e.g., Video S1, S3, S5). By in situ analysis of fixed larvae, we have clarified that some infected leukocytes are dying based on labelling of DNA strand breaks (TUNEL; Fig. S3C). Using EM, we have observed that infected leukocytes may undergo morphological changes associat-ed with pyroptosis, e.g., obvious plasma membrane rupture (Fig. S3B). Macrophages dead from Shigella infection were frequently engulfed by patrolling neutrophils, suggesting an unexpected role for neutrophils during Shigella infection. This is comparable to a recent report for M. marinum [55]. Moreover, our live imaging studies have revealed a new scavenger role for neutrophils in clearing cell debris and live released bacteria from dying infected cells in vivo. The zebrafish model will be particularly useful to investigate these different host cell responses to infection, as well as to dissect the role of implicated Shigella effectors, in vivo.
Autophagy is recognized as a crucial defense mechanism against intracytosolic bacteria [2,12,13]. In mammalian cells in vitro, virulent S. flexneri bacteria escape from the phagosome and invade the cytosol of cells where they are recognized by septin cages and autophagy [14,15]. Yet our understanding of autophagy during bacterial infection would benefit from an experimental model in which the sequence of host-pathogen interactions resulting in autophagy can be validated and dissected in vivo. The optical accessibility of zebrafish larvae allowed us to image Shigella-septin caging in the infected organism, an achievement that has never before been accomplished using mammalian host models. Septin recruitment to intracytosolic Shigella was consistently detectable in infected larva, and promises to be an exciting tool to investigate the role of the cytoskeleton in autophagy in vivo. To complement
(last frame at 2h30pi). Note that neutrophils (highlighted in green by the engulfed GFP-Shigella, #1,2,3 yellow arrows), that have engulfed bacteria in the mesenchyme have a similar bacterial load to that of macrophages, and efficiently kill the engulfed bacteria (as indicated by the diffuse GFP staining over time in these neutrophils). Maximum intensity projection from 25 planes every 2 mm. See also Video S1. B. lyz:dsRed larva (red neutrophils), first frame at 20 mpi. Neutrophils are rapidly recruited to engulf and degrade GFP-Shigella in the mesenchyme. By contrast, note the macrophage that remains strongly decorated by GFP-Shigella over time (white arrow), highlighting bacterial persistence inside macrophages. Maximum intensity projection from 25 planes every 2 mm. See also Video S4. C. mpeg1:G/U:mCherry larva, first frame at 20 mpi. A red macrophage harboring GFP-Shigella over time (white arrow) eventually undergoes cell death (loss of red label). Note in the bottom right corner of the field a group of neutrophils that have engulfed the bacteria in the mesenchyme and appear engorged by them, is able to control the engulfed GFP-Shigella over time (diffuse and decreasing in intensity GFP signal). Maximum intensity projection of 6 planes every 2 mm. See also Video S5. D. lyz:dsRed larva, first frame at 4h30pi. Neutrophils collect dying infected macrophages. GFP-Shigella proliferate inside a macrophage (white arrow), which then undergoes cell death, and is quickly engulfed by dsRed+ neutrophils (yellow arrows). Single confocal plane. See also Video S6. E. lyz:dsRed larva, first frame at 7 hpi. Shigella are able to invade other cell types and replicate in the cytoplasm, causing their death, and subsequent engulfment by neutrophils. The white line delineates a muscle fiber invaded by GFP-Shigella. Shortly before 6 h of time-lapse, the muscle cell bursts and is engulfed by red neutrophils (yellow arrows). Maximum intensity projection of 4 planes every 2 mm. See also Video S7.
Figure 4.Shigellaescape to the cytosol and induce septin caging and autophagy in zebrafish larvaein vivo. A. Zebrafish larvae were infected in the tail muscle with GFP-Shigella for 4 (medium dose) or 24 h (low dose), fixed, labeled with antibodies against SEPT7 (red) and to GFP (green) and imaged by confocal microscopy. Scale bar, 5 mm. B. GFP-Lc3 zebrafish larvae were infected with mCherry-Shigella for 4 (medium dose), fixed, labeled with antibodies against mCherry (red) and to GFP (green) and imaged by confocal microscopy. Scale bar, 5 mm. Shown here is an example of a GFP-Lc3 positive cell controlling bacterial replication (better than its neighbouring cells) 4 hpi. See also Video S8 for live imaging observations of GFP-Lc3 recruitment to Shigella. C. Cytosolic Shigella are sequestered in autophagosomes in vivo. Zebrafish larvae were infected in the tail muscle with GFP-Shigella for 4 h (medium dose) and fixed for electron microscopy. C2 is an expanded region of boxed region in C1 (i.e., autophagosome sequestering bacteria), C3 is an expanded region of boxed region in C2 (i.e., double membrane, a hallmark of autophagosomes). Scale bar, 1 mm (C1) or 0.25 mm (C2). See also Video S9 for a tilt series of Shigella autophagosomes in vivo.
doi:10.1371/journal.ppat.1003588.g004
Figure 5.In vivoperturbation of bacterial autophagy via p62 depletion. A. Western blots of extracts of larvae injected with control (CTRL) or p62 morpholinos (mo), using antibodies against elongation factor 1-a (EF1a; control) or p62. Representative blots using lysates from AB fish; p62 depletion has also been observed in p62 morpholino-treated mpeg:G/U:mCherry and lyz:dsRed fish (data not shown). B. Survival curves of zebrafish
evidence that septin cages entrap bacteria targeted to autophagy in vivo, we have shown in vivo recruitment of GFP-Lc3 to Shigella by confocal microscopy (Fig. 4B for analysis of fixed samples and Video S8 for live imaging). In addition, we have obtained ultrastructural analysis of Shigella autophagosomes by EM (Fig. 4C), and clearly show the cytosolic sequestration of Shigella in vivo by double membrane vacuoles. By confocal microscopy (Fig. S4A for analysis of fixed samples and Video S10 for live imaging), we have
shown in vivo recruitment of septin caging and GFP-Lc3 to M. marinum, a natural fish pathogen previously shown to be recognized septin caging and autophagy in vitro. All of these observations fully validate the zebrafish as a new model for the in vivo study of bacterial autophagy.
p62 is a well-characterized autophagy receptor and is increas-ingly recognized as a critical component of innate immunity (reviewed in [12,13]). In agreement with this, we show that
larvae treated with control (CTRL) or p62 morpholinos and infected with a sublethal dose of S. flexneri (+M90T) or not infected (no bact). Representative experiment of at least 3 independent ones; n = 12 or more larvae per group. Significance testing performed by Log Rank test. **, P = 0.01. C. Bacterial counts in zebrafish larvae treated with control (CTRL) or p62 morpholinos and infected with a sublethal dose of S. flexneri. Enumeration of live bacteria in homogenates from individual larvae at various times postinfection measured by plating onto LB. CTRL larvae = open circles. p62-depleted larvae = open squares. One representative experiment of at least 3 independent ones; 3 larvae per condition. Of note, dead larvae at 24 or 48 hpi (overwhelmed with bacteria, as determined by fluorescence stereomicroscopy) were not included here, and only larvae having survived the infection (thus far) were included here (and in this case, statistics are in grey). Mean6SEM also shown (horizontal bars). Significance testing performed by Student’s t test. ns, P.0.05; **, P,0.01; ***, P,0.001. D. Leukocyte behaviour and infection progression upon Shigella inoculation in p62 knockdown larvae over time. lyz:dsRed p62-depleted 3 dpf larva inoculated with GFP-Shigella and live imaged from 20 mpi to 40 hpi. Maximum intensity projection of 35 sections spaced by 2 mm. Frames extracted at various time points (20 mpi, 5h30mpi, 16 hpi, 24 hpi, 32 hpi and 40 hpi) suggest that neutrophils are unable to restrict bacterial proliferation. The infected larva is progressively depleted in neutrophils and overwhelmed with Shigella. Scale bar, 50 mm. E. Zebrafish larvae treated with either control (CTRL; left image) or p62 (right image) morpholinos were infected with GFP-Shigella for 4 (medium dose), fixed, labeled with antibodies against SEPT7 (red) and to GFP (green), and imaged by confocal microscopy. Arrows highlight some examples of Shigella entrapped in septin cages (CTRL) or not (p62 depleted) a 4 hpi. Scale bar, 5 mm. doi:10.1371/journal.ppat.1003588.g005
Figure 6.In vivoperturbation of autophagy via rapamycin stimulation. A. Survival curves of zebrafish larvae treated with control (CTRL) or rapamycin (RAPA) and infected with a sublethal dose of S. flexneri (+M90T) or not infected (no bact). Representative experiment of at least 3 independent ones; n = 10 or more larvae per group. Significance testing performed by Log Rank test. ***, P = 0.001. B. Bacterial counts in zebrafish larvae treated with control (CTRL) or rapamycin (RAPA) and infected with a sublethal dose of S. flexneri. Enumeration of live bacteria in homogenates from individual larvae at various times postinfection measured by plating onto LB. CTRL larvae = open circles. RAPA-treated larvae = open squares. n = 3 larvae per treatment, pooling of 3 independent experiments. Of note, dead larvae at 24 or 48 hpi (overwhelmed with bacteria, as determined by fluorescence stereomicroscopy) were not included here, and only larvae having survived the infection (thus far) were included here (and in this case, statistics are in grey). Mean6SEM also shown (horizontal bars). Significance testing performed by Student’s t test. ns, P.0.05; ***, P,0.001. C. Inflammatory response is not affected in rapamycin-treated larvae. Expression of il1b transcripts at 96 hpf in larvae injected with ,103S. flexneri at 72 hpf (+M90T) or in uninfected controls, treated after infection with rapamycin (RAPA) or vehicle only (DMSO, i.e., CTRL). Il1b/ef1a transcript number ratios, normalized to the mean value in uninfected controls. Results for 5 pools of 3 larvae per group, mean6SEM also shown (horizontal bars). doi:10.1371/journal.ppat.1003588.g006
p62-mediated bacterial autophagy is crucial to control bacterial pathogenesis in vivo. On the other hand, we also observed that rapamycin, while stimulating autophagy as expected [46,47], may increase bacterial replication and decrease zebrafish survival. Interestingly, in vitro treatment of Hela cells with rapamycin for 1– 4 hrs was observed to have no significant effect on Shigella [56]. In our model, leaving zebrafish larvae in rapamycin for longer periods of time (e.g., 5 days) may lead to harmful effects in vivo; this that will require attention in future studies. In agreement with data obtained using Shigella (Fig. 6A, 6B), we have observed that rapamycin treatment of Listeria-infected zebrafish may not promote host survival or bacterial clearance (Fig. S6E, S6F). This effect of rapamycin could be due to processes other than autophagy, for the rapamycin target mTOR affects many other cellular processes [45], yet these data clearly serve as an important warning for the therapeutic implications of rapamycin treatment. Overall, these data strongly suggest that zebrafish survival depends on the appropriate autophagic response to control intracellular bacterial infection.
To conclude, we show that the zebrafish larva represents a valuable new host for the analysis of S. flexneri infection. Interactions between bacteria and host phagocytes can be imaged at high resolution in vivo, and the zebrafish model should prove useful for understanding the cell biology of Shigella infection. It may become possible in the future to observe S. flexneri phagosome escape, actin tail formation and septin caging in vivo in real time by developing new transgenic zebrafish lines. Here, we use zebrafish larvae to investigate the role of bacterial autophagy in host defense at the whole organism, cellular and single-cell level, and observed that the perturbation of autophagy can adversely affect host survival in response to Shigella infection. Future work will visualize and characterize the molecular determinants of autophagy during microbe-cell interactions in vivo, using several different bacterial and viral pathogens.
Material and Methods Ethics statement
Animal experiments conducted at the Institut Pasteur were performed according to European Union guidelines for handling of laboratory animals (http://ec.europa.eu/environment/ chemicals/lab_animals/home_en.htm) and were approved by the Institut Pasteur Animal Care and Use Committee and the Direction Sanitaire et Ve´te´rinaire de Paris under permit #A-75-1061. Animal experiments performed at Imperial College were performed according to the Animals (Scientific Procedures) Act 1986, and were fully approved by the Home Office (Project license: PPL 70/7446).
Zebrafish care and maintenance
Wild-type AB purchased from the Zebrafish International Resource Center (Eugene, OR), and the Tg(lyz:dsRed)nz50, Tg(mpeg1:Gal4FF)gl25, Tg(mpeg1:Gal4FFgl25/UAS:kaede), Tg(UAS-E1b:nfsB.mCherry)c264, and GFP-Lc3 transgenic zebrafish lines have been previously described [46,57–59]. Eggs were obtained by marble-induced spawning, bleached according to protocols described in The zebrafish book [60], and then kept in Petri dishes containing Volvic source water supplemented with 0.3mg/ ml of methylene blue and, from 24 hours post fertilization (hpf) onwards with 0.003% 1-phenyl-2-thiourea (Sigma-Aldrich) to prevent melanin synthesis. Embryos were reared at 28uC or 24uC according to the desired speed of development; infected larvae were always kept at 28uC. All timings in the text refer to the developmental stage at the reference temperature of 28.5uC [61].
Larvae were anesthetized with 200mg/ml tricaine (Sigma-Aldrich) during the injection procedure as well as during the in vivo imaging.
Zebrafish fibroblast-like cell line establishment
Fibroblast-like cells were derived from AB zebrafish as follows. After a zebrafish (AB strain) has been sacrificed by overexposure to eugenol, a dorsal slice comprising skin, muscle and the dorsal fin was taken and trypsinised under constant mild shaking for 5 min. The supernatant was collected in modified MacPherson Stoker Eagle’s medium (Eurobio) supplemented with 10% fetal calf serum (FCS), 100 IU/mL penicillin and 100 mg/mL streptomycin. The cell suspension was centrifuged for 5 min at 1000 g, and cells were resuspended in culture medium. The rainbow trout fibroblast cell line RTG-2 was then used as feeder, and zebrafish cells were grown on a monolayer of RTG2 for almost one year. At each passage, the co-culture was kept for 1–2/3 weeks at 20uC then put for a few days at 30uC; at this temperature, trout cells died and the remaining zebrafish cells used to seed the next passage over a new RTG-2 monolayer. After one year, ZF-AB cells started to be able to grow without feeder. Once established, fibroblast-like cells derived from AB zebrafish (ZF-AB) cells were cultured in minimum essential medium plus GlutaMAX (Invitrogen) supple-mented with 1 mM sodium pyruvate (Invitrogen), 0.1 mM nonessential amino acid solution (Invitrogen), and 10% FCS. Zebrafish cells were grown at 28uC.
Infection of cell lines and microscopy
1–1.56105ZF-AB or HeLa cells were plated on glass coverslips in 6-well plates (Techno Plastic Products) and used for experiments 48 h later. Cells on coverslips were fixed for 15 min in 4% paraformaldehyde and then washed with 16 PBS and processed for immunofluorescence (IF). After 10 min of incubation in 50 mm ammonium chloride, cells were permeabilized for 4 min with 0.1% Triton X-100 and then incubated in 16 PBS. Incubation with primary or secondary antibodies was performed in 16 PBS. Vectashield hard set mounting medium with DAPI (Vector Laboratories) or mounting medium for IF (Interchim) was used.
Shigella was added to cells using 400ml of growth (A600 nm= 0.6) or using 200ml of overnight growth (A600 nm= 0.6) from single colony, and was diluted in minimum essential medium and added directly to cells for imaging analyses. Bacteria and cells were centrifuged at 7006g for 10 min at 21uC and then placed at 28uC for 30 min, washed with minimum essential medium, and incubated with fresh gentamicin-containing complete medium (50mg/ml) for 4 h, after which they were washed with 16 PBS and fixed and processed for IF.
Images were acquired on a fluorescence inverted microscope Axiovert 200 M (Carl Zeiss MicroImaging, Inc.) equipped with a cooled digital charge-coupled device camera (Cool SNAPHQ, Photometrics) driven by Metamorph Imaging System software (Universal Imaging Corp).
Bacteria and bacterial infections
Bacterial strains used in this study were wild-type invasive of S. flexneri serotype 5a (M90T; BUG 2505) [15], M90T expressing green fluorescent protein (GFP) (GFP-Shigella; BUG 1908) [15], dsRed [62] or mCherry (pFPV 25.1 mCherry construct), T3SS2 noninvasive variant (DmxiD) expressing dsRed [62], E. coli K12 bacteria expressing dsRed [26], and M. marinum M strain expressing GFP or dsRed [15]. In the case of E. coli, infections were performed as previously described [24,26]. S. flexneri were cultured overnight in trypticase soy, diluted 806in fresh trypticase soy, and cultured until A600 nm= 0.6. M. marinum M-GFP and
M-DsRed were cultured at 30uC in Middlebrook 7H9 (BD Biosciences) supplemented with 0.2% glycerol, 0.05% Tween 80 and 10% ADC Enrichment (Fisher Scientific), diluted 48 h prior to infection in fresh media, and cultured until OD600 nm = 0.6. For injection of zebrafish larvae, bacteria were recovered by centrifugation, washed, resuspended at the desired concentration in PBS. In the case of M. marinum, bacteria were also passaged through a 26 gauge needle to dissociate bacterial clumps and homogenize the bacteria prior to infection. 3 day post-fertilisation (dpf) anesthetized zebrafish larvae were microinjected intrave-nously (iv) with 0.5–2 nl of bacterial suspension as described previously [24]. The exact inoculum was checked a posteriori by injection in a water drop and plating onto LB agar. Infected larvae were transferred into individual wells (containing 1 ml of Volvic water in 24-well culture plates), incubated at 28uC and regularly observed under a stereomicroscope. Infections with a quantified standard dose were performed at least 3 times per strain of bacteria. Survival curves with graded doses as depicted were repeated at least 3 times.
Measurement of bacterial burden
At the indicated times, animals were anesthetized, rinsed, and collected in 30ml of sterile water. The animals were lysed in 200ml of 0.4% Triton X-100 and homogenized through a 26-gauge needle (five up-and-down sequences). Serial dilutions of the homogenates were plated onto LB agar, and CFU were enumerated after 24 h of incubation at 37uC; only colonies with the appropriate morphology and color were scored.
Microscopy of zebrafish (infected or not)
Anesthesized zebrafish larvae were fixed for 2 h at RT or overnight at 4uC in 4% paraformaldehyde with 0.4% triton, then washed with PBS 0.1% tween, and processed for IF. In brief, after 20 additional minutes of PBS 1% triton, larvae were washed 365 minutes in PBS 0.4% triton, then incubated in blocking solution: PBS 16 supplemented with 10% sheep serum, 1% DMSO, and 0.1% tween, for 1 hour. Primary antibodies were diluted in blocking solution and were applied to larvae overnight at 4uC. To remove primary antibodies, larvae were washed 4615 min in PBS +0.1% tween. After washes, larvae were placed in blocking solution for 1 h at RT. Secondary antibodies were diluted in block solution and were applied to larvae overnight at 4uC. To remove secondary antibodies, larvae were washed 4615 min in PBS 0.1% Tween. Fluorescently labeled larvae were then cleared by progressive transfer to 80% glycerol.
Quantification of macrophages and neutrophils numbers on fixed and labeled transgenic reporter larvae was performed as following. Briefly, brightfield, dsRed and GFP images of whole fixed larvae were taken using a Leica Macrofluo Z16 APOA (zoom 16:1) equipped with a Leica PlanApo 2.06 lens, and a Photometrics CoolSNAP HQ2 camera. Images were captured using the Metavue software version 7.5.6.0 (MDS Analytical Technologies). Then, pictures were analyzed and positive cells for red fluorescence counted using the ImageJ software version 10.2 (developed by the National Institute of Health). Neutrophils numbers were obtained with lyz:dsRed larvae, macrophage numbers with mpeg1:G/U:mCherry larvae. Counts shown in Fig. 2B are numbers of leukocytes per image.
Examination of septin recruitment in vivo was performed using a confocal microscope (Zeiss LSM510). Larvae were infected with GFP-Shigella in the mesenchyme near the caudal vein or in the hindbrain, and fixed and labeled for microscopy 4 or 24 hpi. Z-stacks of infected larvae were acquired for each sample using a 636 or 1006 objective and a slice increment of 0.2mm. These
stacks were then deconvoluted (Huygens software) and analysed using ImageJ according to previously established criteria [14,15,63].
Live imaging, image processing and analysis
To perform whole-body in vivo imaging, anaesthetized zebrafish larvae were oriented and immobilized in 1% low melting point agarose in 60 mm plastic bottom Petri dishes (up to 9 fish mounted and imaged per dish), then covered with 2 ml Volvic water containing tricaine as described previously [26]. Transmission and fluorescence widefield imaging was done using a Nikon Biostation IM–Q S2 equipped with a DS-Qi camera. Imaging was typically performed at 26uC with a 106 (NA 0,5) dry objective. Multiple-field Z-stacks with a 10mm Z-step were acquired every 30 min-utes.
To perform high resolution confocal live imaging, injected larvae were positioned in 35 mm glass-bottom dishes (Inagaki-Iwaki). To immobilise the larva in the dish a 1% low-melting-point agarose solution covering the entire larva was used. The immobilised larvae were then covered with 2 ml Volvic water containing tricaine. Confocal microscopy was performed at 23– 26uC using a Leica SPE inverted microscope and a 406 oil immersion objective (ACS APO 4061.15 UV) as previously described [26]. A Leica SP8 confocal microscope equipped with two PMT and an Hybrid detector (HyD) and a 206 oil immersion objective (HC PL APO CS2 206/0.75) was used to live image infected larvae (represented in Figure S4B, Video S8, Video S10).The 4D files generated by the time-lapse acquisitions were processed, cropped, analysed and annotated using the LAS-AF Leica software. Acquired Z-stacks were projected using maximum intensity projection and exported as AVI files. Frames were captured from the AVI files and handled with Photoshop software to mount figures. AVI files were also cropped and annotated with ImageJ software, then compressed and converted into QuickTime movies with the QuickTime Pro software.
Electron microscopy
For standard ultrastructure analyses, as described in [24,64], anesthetized embryos were fixed in 0.5% glutaraldehyde in 200 mM sodium cacodylate buffer for 2 h, washed in buffer and secondarily fixed in reduced 1% osmium tetroxide, 1.5% potassium ferricyanide for 60 min. The samples were washed in distilled water and stained overnight at 4uC in 0.5% magnesium uranyl acetate, washed in distilled water and dehydrated in graded ethanol, infiltrated with propylene oxide and then graded Epon/ PO mixtures until final embedding in full Epon resin in coffin moulds (allowing different orientations) and polymerised at 56uC overnight. Semi-thin survey sections were cut and stained and final ultrathin sections (typically 50–70 nm) and serial sections were collected on Formvar coated slot grids and stained with Reynold’s lead citrate and examined in a FEI Tecnai electron microscope with CCD camera image acquisition.
qRT-PCR
RNA was extracted from snap-frozen larvae using Trizol (Invitrogen). cDNA was obtained using M-MLV H- reverse-transcriptase (Promega) with a dT17 primer. Quantitative PCR was then performed on an ABI7300 thermocycler (Applied Biosystems) using SYBR green reaction power mix (Applied Biosystems). The following pairs of primers were used: EF1a (GCTGATCGTTGGAGTCAACA and ACAGACTTGACCT-CAGTGGT); IL1b (GAGACAGACGGTGCTGTTTA and GT AAGACGGCACTGAATCCA). Quantifications were performed on triplicate wells, and taking into account the previously
measured yield of the reaction as described in [65]. To normalize cDNA amounts, we used the housekeeping gene EF1a transcripts [66].
icsA, icsB expression in vivo
S. flexneri M90T was injected into the hindbrain ventricle of zebrafish larvae and incubated at 28uC for 4 h (high dose), 12 h (medium dose) and 24 h (medium dose). RNA was extracted from 10 snap-frozen larvae per timepoint using Trizol (Invitrogen). cDNA was obtained using QuantiTect Reverse Transcription Kit (Qiagen). PCR was then performed using a PTC-225 Poltier Thermal Cycler (MJ Research) and RedTaq reaction mix (Applied Biosystems). The following pairs of primers were used: icsA (AATCAATAAGGGCACGTTCG and TCGCCATCTGTAT-CATTCCA); icsB (GCATCGGTACAGCCAAAAAT and GTAT GAGTGGCAAGCGTTGA).
Antibodies
Rabbit polyclonal antibodies used were anti-SEPT7 (R170) [15], anti-p62 (Cliniscience, PM045), anti-dsRed (Clontech Laboratoires), anti-elongation factor 1-a (EF1a; GeneTex); to label GFP chicken polyclonal and mouse monoclonal antibodies anti-GFP (Abcam) were used. Secondary antibodies used were Cy3-, Cy5- (Jackson ImmunoResearch Laboratories), Alexa Fluor 488-, or Alexa Fluor 546-conjugated goat anti-rabbit, anti-chicken or goat anti-mouse (Molecular Probes). F-actin was labeled with Alexa Fluor 488-, 546-, or 647-phalloidin (Molecular Probes). Whole-mount immunohistochemistry of infected zebrafish cells was performed using standard protocols [14,15]. For immuno-blotting, total cellular extracts were blotted with the above-mentioned antibodies followed by peroxidase-conjugated goat anti-mouse or anti-rabbit antibodies (Biosys Laboratories). Anti-EF1a was used throughout as a loading control. Proteins were run on 8, 10 or 14% acrylamide gels.
Morpholinos and pharmacological inhibitors
Antisense morpholino oligonucleotides were obtained from GeneTools (www.gene-tools.com). After thawing, morpholinos are heated at 65uC for 10 min to ensure complete dissolution, and diluted to the desired concentration (typically, 250 to 500mM, for a total injected amount of 4 ng) in morpholino buffer (120 mM KCl, 10 mM Hepes pH 7.2) containing 0.1% phenol red. Injections were performed into 1-cell embryos at 1 nL per
embryo. Control (TACCAAAAGCTCTCTTATCGAGGGA,
with no known target on the zebrafish genome) and p62-specific (CACTGTCATCGACATCGTAGCGGAA, targeting the start AUG codon) morpholinos were used.
For rapamycin treatment, protocols were adapted from [46]. Larvae were treated with rapamycin (Calbiochem) for 12 h (50 nM), and treatment was continued throughout infection.
Statistical analysis
Significance testing for performed by Log Rank test (survival curves), Student’s t test (on log values of CFU counts), or by ANOVA with Bonferroni posttest (leukocyte counts). The level of significance is shown as follows: ns, P.0.05; *, P,0.05; **, P,0.01; ***, P,0.001.
Supporting Information
Figure S1 Characterization of zebrafish septin 7 and Shigella virulence factors. A. Alignment of zebrafish and human septin 7 proteins. Human septin 7 (NM_001788.5) and its three zebrafish orthologues: sept7a (deduced from a sequence we
re-amplified and cloned because of inconsistencies in the available sequences and deposited at GenBank KC513820, gene EN-SDARG00000052673 on chromosome 16), sept7b (NP_0010 71211, gene ENSDARG00000019649 on chromosome 25) and sept7c (NP_001242958, gene located on chromosome 19 in a region improperly assembled on zv9, broken in three parts: ENSDART00000126747, ENSDARG00000075198 and EN-SDART00000131014). B. Western blot of larval extracts using antibodies against SEPT7 as described in Fig. 1A. Shown here is complete lane of SEPT7 blot and antibody specificity. C. Shigella forms actin tails and recruits septin cages in HeLa cells at 28uC. Immunofluoresence microscopy of HeLa cells infected with Shigella for 4h40min at 28uC. F-actin (green), SEPT7 (red), DAPI (blue). Note septin cage-like structures surrounding DAPI-labeled Shigella (arrows). Scale bar, 2mm. D. Survival curves of 72 hpf larvae injected with various doses of T3SS- S. flexneri and incubated at 28uC for 48 hpi. The effective inoculum, quantified a posteriori, was classified as low (,103CFU, open circles; effective range: 0.6–11.76102CFU), medium (,46103CFU, open triangles; effective range: 1.2–6.06103CFU) or high (,104CFU, open squares; effective range: 6.1–33.36103CFU). Mean6SEM of 24 larvae from 2 independent experiments per inoculum class. E. Enumeration of live bacteria (T3SS- Shigella) in homogenates from individual larvae at various times post infection measured by plating onto LB. Low dose inoculum = open circles. Medium or high dose inoculum = open squares. Mean6SEM also shown (horizontal bars). Significance testing performed by Student’s t test. *, P,0.05; **, P,0.01; ***, P,0.001. F. icsA and icsB expression in vivo. S. flexneri M90T was injected into the hindbrain ventricle of zebrafish larvae and were incubated at 28uC for 4 h (high dose), 12 h (medium dose) or 24 h (medium dose). RNA was extracted from 10 larvae per timepoint and converted into cDNA using reverse transcriptase (+RT) or not (2RT), PCR amplified, and amplicons were run on 1% agarose gel. Genomic DNA from Shigella was used as a positive control.
(TIF)
Figure S2 In vivo macrophage and neutrophil behav-iours and progression of the infection over time upon sublethal and lethalShigella inocula. Images of the caudal area of Mpeg1:G/U:mCherry (red macrophages, upper panel) or lyz:dsRed (red neutrophils, lower panel) 3 dpf larvae iv injected with sublethal and lethal GFP-Shigella inocula. Live imaging by widefield microscopy, overlay of red and green fluorescence. Images at 2, 12 and 24 hpi are shown. (Bottom) Scheme of a 72 hpf larva: the imaged region is boxed, and arrow shows the injection site.
(TIF)
Figure S3 Characterisation ofShigella-dependent mac-rophage death. A. Frames extracted from in vivo time-lapse confocal imaging sessions of 3 dpf larvae injected in the bloodstream with GFP-Shigella (3000–4000 bacteria) and T3SS-DsRed Shigella (6000–8000 bacteria). Caudal area, rostral to bottom right, dorsal to top right. Maximum intensity projection from 26 planes every 2mm. Scale bar, 20mm. Upper panel: mpeg1:G/U:mCherry larva (red macrophages); first frame at 20 mpi. By 20 mpi, GFP-Shigella have already adhered to or have been engulfed by macrophages (red cells, white arrows, number 1 to 5). Tracked infected macrophages are killed by GFP-Shigella; they progressively round up and burst, releasing in the extracellular milieu live GFP-Shigella. Note that at the end of the sequence (about 3 hpi) the bacteria are still in the blood. See also Video S3. Lower panel: 72 hpf Tg(mpeg1:Gal4FFgl25/UAS:kaede) larva (green macrophages); first frame at 20 mpi. By 20 mpi
![Fig. S1D) or the closely related, but non-pathogenic, E. coli K12 (data not shown and [26]) always survived for the entire time of observation.](https://thumb-eu.123doks.com/thumbv2/123doknet/14698673.564070/4.918.88.684.88.805/fig-closely-related-pathogenic-shown-survived-entire-observation.webp)