HAL Id: hal-02281453
https://hal.sorbonne-universite.fr/hal-02281453
Submitted on 9 Sep 2019
HAL is a multi-disciplinary open access
archive for the deposit and dissemination of
sci-entific research documents, whether they are
pub-lished or not. The documents may come from
teaching and research institutions in France or
abroad, or from public or private research centers.
L’archive ouverte pluridisciplinaire HAL, est
destinée au dépôt et à la diffusion de documents
scientifiques de niveau recherche, publiés ou non,
émanant des établissements d’enseignement et de
recherche français ou étrangers, des laboratoires
publics ou privés.
activity in germ cells
Roberta Ragazzini, Raquel Pérez-Palacios, Irem Baymaz, Seynabou Diop,
Katia Ancelin, Dina Zielinski, Audrey Michaud, Maelle Givelet, Mate Borsos,
Setareh Aflaki, et al.
To cite this version:
Roberta Ragazzini, Raquel Pérez-Palacios, Irem Baymaz, Seynabou Diop, Katia Ancelin, et al..
EZHIP constrains Polycomb Repressive Complex 2 activity in germ cells. Nature Communications,
Nature Publishing Group, 2019, 10, pp.3858. �10.1038/s41467-019-11800-x�. �hal-02281453�
EZHIP constrains Polycomb Repressive Complex 2
activity in germ cells
Roberta Ragazzini
1,8
, Raquel Pérez-Palacios
1,8
, Irem H. Baymaz
2
, Seynabou Diop
1
, Katia Ancelin
1
,
Dina Zielinski
1,3
, Audrey Michaud
1
, Maëlle Givelet
4
, Mate Borsos
5,6
, Setareh A
flaki
1
, Patricia Legoix
7
,
Pascal W.T.C. Jansen
2
, Nicolas Servant
1,3
, Maria-Elena Torres-Padilla
5,6
, Deborah Bourc
’his
1
, Pierre Fouchet
4
,
Michiel Vermeulen
2
& Raphaël Margueron
1
The Polycomb group of proteins is required for the proper orchestration of gene expression
due to its role in maintaining transcriptional silencing. It is composed of several chromatin
modifying complexes, including Polycomb Repressive Complex 2 (PRC2), which deposits
H3K27me2/3. Here, we report the identi
fication of a cofactor of PRC2, EZHIP (EZH1/2
Inhibitory Protein), expressed predominantly in the gonads. EZHIP limits the enzymatic
activity of PRC2 and lessens the interaction between the core complex and its accessory
subunits, but does not interfere with PRC2 recruitment to chromatin. Deletion of
Ezhip in mice
leads to a global increase in H3K27me2/3 deposition both during spermatogenesis and at
late stages of oocyte maturation. This does not affect the initial number of follicles
but is associated with a reduction of follicles in aging. Our results suggest that mature
oocytes
Ezhip−/− might not be fully functional and indicate that fertility is strongly impaired
in
Ezhip−/− females. Altogether, our study uncovers EZHIP as a regulator of chromatin
landscape in gametes.
https://doi.org/10.1038/s41467-019-11800-x
OPEN
1Institut Curie, PSL Research University, Sorbonne University, INSERM U934/ CNRS UMR3215, 26, rue d’Ulm, 75005 Paris, France.2Department of
Molecular Biology, Faculty of Science, Radboud Institute for Molecular Life Sciences, Oncode Institute, Radboud University Nijmegen, Route 274 M850.03.87 Geert Grooteplein 28, Nijmegen 6525 GA, Netherlands.3INSERM U900, Mines ParisTech, 26, rue d’Ulm, Paris, France.4Commissariat à l’énergie atomique et aux énergies alternatives, Institut de radiobiologie cellulaire et moléculaire, Laboratoire des Cellules Souches Germinales, INSERM U967, Fontenay-aux-Roses 92260, France.5Institute of Epigenetics and Stem Cells (IES), Helmholtz Zentrum München, D-81377 München, Germany. 6Faculty of Biology, Ludwig Maximilians Universität, D-81377 München, Germany.7ICGex Next-Generation Sequencing Platform, Curie Institute, 26, rue
d’Ulm, Paris, France.8These authors contributed equally: Roberta Ragazzini, Raquel Pérez-Palacios. Correspondence and requests for materials should be addressed to R.M. (email:[email protected])
123456789
E
arly in development, cells commit to specific lineages and
acquire
precise
identities
that
require
maintenance
throughout the lifespan of the organism. Polycomb group
proteins play an important role in this process by maintaining
transcriptional repression through the regulation of chromatin
structure
1. In mammals, this machinery is composed of two main
complexes: Polycomb Repressive Complex 1 and 2 (PRC1 and 2).
The core PRC2 complex is composed of four subunits: the
cat-alytic subunit EZH1/2, SUZ12, EED, and RbAp46/48
1. PRC2
catalyzes the di- and tri-methylation of lysine 27 on histone H3
(H3K27me2/3), an enzymatic activity which is required for its
function. Indeed, the mutation of lysine 27 of histone H3
to arginine leads to loss of gene repression, and mutant
flies
display a phenotype similar to deletion of PRC2 components
2.
H3K27me3 is generally enriched around the promoter of
tran-scriptionally silent genes and contributes to the recruitment of
PRC1
1. H3K27me2 is widely distributed, covering 50–70% of
histones, and its role is less defined but may be to prevent
aberrant enhancer activation
3.
The question of how PRC2 is targeted to chromatin and how
its enzymatic activity is controlled has received ongoing
atten-tion
4. Cumulative evidence suggests that PRC2 may not be
actively recruited to chromatin and that, instead its activity, is
promoted by the recognition of its own mark H3K27me3,
ubi-quitination of lysine 119 of H2A, GC-richness, or by condensed
chromatin
4. Conversely, some histone modifications negatively
influence PRC2 function, particularly those associated with
active transcription, such as H3K4me3 and H3K36me3
4. PRC2
binding to chromatin may also be inhibited by DNA
methyla-tion
5, although other reports suggest that PRC2 is compatible
with DNA methylation
6.
A number of accessory subunits have now been shown to
influence PRC2 function
4. Recent comprehensive proteomic
analyses suggest that they might form around two main
PRC2 subtypes, PRC2.1 and PRC2.2
7. The subunit SUZ12 plays a
central role by orchestrating the cofactor interactions
8. PRC2.1
includes one of the three Polycomb-like proteins (PHF1, MTF2 or
PHF19) together with the recently identified PRC2 partners
EPOP and PALI1
9,10. The three Polycomb-like proteins harbor
one Tudor domain and two PHD
finger domains each
4. Their
Tudor domain is able to recognize H3K36me3 decorated genes,
which could be important for PRC2 association with transcribed
targets
4. The function of EPOP remains ambiguous since, in vitro,
it stimulates PRC2 catalytic activity while, in vivo, it limits PRC2
binding, likely through interaction with Elongin BC
11. In
con-trast, PALI1 is required for H3K27me3 deposition both in vitro
and in vivo
10. The other complex, PRC2.2, includes JARID2 and
AEBP2 subunits in equal stoichiometry
12,13. Both are able to
stimulate PRC2 catalytic activity in vitro with JARID2 being also
able to bind nucleosomes
14. JARID2 also appears to be necessary
for PRC2 targeting at its loci, possibly through its DNA-binding
domain or as a result of its methylation by PRC2
4. AEBP2
binds to DNA in vitro, but appears to negatively modulate
PRC2 in vivo
15,16. Of note, AEBP2 was reported to stimulate
PRC2 through a mechanism independent of PRC2 allosteric
activation
17,18. While we now have a good picture of the
acces-sory subunits interacting with PRC2, their precise roles are only
partially understood. This might be due to compensatory
mechanisms, such that interfering both with PRC2.1 and PRC2.2
is required to inhibit PRC2 recruitment
19as observed upon loss
of SUZ12
20.
The regulation of chromatin structure in germ cells is pivotal,
as these cells are the bridge between generations and therefore
potential vector of epigenetic information. In particular,
H3K27me3 has been shown to be involved in parental
imprint-ing
21–23. Yet, in contrast to the extensive characterization of
PRC2 in models, such as mouse embryonic stem cells (ESC),
much less is known about the regulation of its enzymatic activity
in germ cells. Deletion of PRC2 core components during
sper-matogenesis results in the progressive loss of germ cells,
indi-cating that its activity is required for this process
24,25. At later
stages of spermatogenesis, when round spermatids differentiate
into mature sperm, histones are progressively replaced by
pro-tamines. A variable fraction of the genome retains a nucleosomal
structure (1% in mice, 10–15% in human), with histones carrying
posttranslational modifications, including H3K27me3
26. During
oogenesis, histones are maintained and H3K27me3 is detected
throughout this process
27–29. However, H3K27me3 displays a
peculiar pattern of enrichment in the growing oocyte, showing
broad enrichment in intergenic regions and gene deserts
(reviewed in refs.
30,31). Genetic interference with PRC2 function
in growing oocytes does not prevent their maturation, but has
been linked to a postnatal overgrowth phenotype in the progeny
32possibly through the control of imprinting
23.
Here, we report the identification of a tissue-specific cofactor of
PRC2, EZHIP. In human and mouse, we show that this cofactor
is expressed primarily in gonads and that it limits PRC2-mediated
H3K27me3 deposition. Inactivation of this cofactor in mice
results in excessive deposition of this mark both during
sper-matogenesis and oogenesis. We further provide evidences that
mutant oocytes with this altered epigenetic content are not fully
functional, and that mouse female fertility is impaired.
Results
Identification of a cofactor of PRC2 in the gonad. PRC2
recruitment and enzymatic activity is controlled by a set of
cofactors interacting in a partially mutually exclusive manner
with the core subunit SUZ12, but little is known about its
reg-ulation in germ cells. To tackle this question, we
first focused on
testes (more abundant material than ovaries), and took advantage
of knock-in mouse models expressing an N-terminal Flag-tagged
version of either EZH1 or EZH2 from their respective
endogen-ous locus (this study and
33). We verified the expression of the
tagged-EZH1 by western blot on mouse testis nuclear extract,
and were able to detect the presence of a slowly migrating
polypeptide, which is specifically pulled down by
Flag-Immunoprecipitation (Flag-IP) (Supplementary Fig. 1A). We
then isolated nuclei from adult mouse testes (WT control,
EZH2-Flag or EZH1-EZH2-Flag), performed EZH2-Flag-IP, and subjected the
sam-ples to mass spectrometry. The results of three independent IPs
are represented as volcano plots (Fig.
1a; Supplementary Fig. 1B).
As expected, both EZH1 and EZH2 proteins interact with the
other PRC2 core components and with known accessory
sub-units: AEBP2, JARID2, PHF1, and MTF2 (Fig.
1a; Supplementary
Fig. 1B). Interestingly, our experiments also reveal the existence
of an additional partner, the uncharacterized protein AU022751
(ENSMUST00000117544; NM_001166433.1), which we retrieved
in both EZH1 and EZH2 pulldowns. We referred to this cofactor
as
“EZHIP” for EZH1/2 inhibitory protein. Of note, this protein
was previously identified in PRC2 interactomes of mouse
embryonic stem cells, but its function was not further
investigated
13,34,35. In order to confirm this interaction, we
overexpressed Flag-tagged versions of the mouse and human
homologs in HeLa-S3 cells (Supplementary Fig. 1C), and
per-formed IP followed by mass spectrometry. These reverse IPs
confirmed the interaction between PRC2 and EZHIP (Fig.
1b;
Supplementary Fig. 1D). Additional putative partners were
identified in both IPs, but with the exception of USP7, they were
not common to both homologs. We therefore did not
pursue their study further. Importantly, these reverse IPs also
indicate that EZHIP interacts with both PRC2 complex subtypes.
–10 –5 0 5 10 0 1 2 3 4 5 Log2 (flag/control) –Log 10 (FDR ( t-test)) EZHIP RBBP4 AEBP2 Txn EZH1 MTF2 RBBP7 EZH2 JARID2 Svs2 PHF1 Log2 FC > 4.8 FDR < 0.01 EED –15 –10 –5 0 5 10 15 Log2 (flag/control) 0 1 2 3 4 5 6 –Log 10 (FDR ( t-test)) C17ORF96 PHF1 EED SUZ12 TCEB2 EZH2 PHF19 AEBP2 PALI1 EZH1 JARID2 USP7 MAGEF1 WDR6 FTSJ1 MTF2 EZHIP Log2 FC > 7 FDR < 0.01
EZH2-Flag IP-MS Mm EZHIP-Flag IP-MS
a
b
c
d
e
f
Ser-Rich 1 503 Ser-Rich 1 589EZHIP (Homo Sapiens) EZHIP (Mus musculus)
VRMRASSPSPPGR
Protein sequence homology
mRNA levels relative
to Tbp Mouse tissues 0 1 2 3 EZHIP EZH2 Ovary Testis
Prostate BrainKidney Spleen Liver EZHIP EZH2 EZHIP EZH2 SUZ12
Fig. 1 EZHIP interacts with PRC2 in gonads. a Volcano plot of EZH2 interactome from EZH2-Flag mice testis IP compared with WT. Core complex subunits are in red, in green the cofactors and in blue EZHIP,n = 3. b Volcano plot representation of EZHIP interactome after Flag-IP from HeLa-S3 overexpressing EZHIP compare with WT. Same color codes as in (a),n = 3. c Schematic representation of EZHIP protein sequence from Mus Musculus (upper part) and Homo Sapiens (middle part). Serine-rich region is colored in beige, and conserved amino acid stretch in green. The conserved sequence stretch is displayed as well as protein residues conservation between the two sequences in green (Sequence Homology determined using Genious software).dEzhip and Ezh2 mRNA relative abundance normalized toTbp in various mice tissues (mean, n = 2). e EZHIP and EZH2 IHC staining on human adult seminiferous tubules sections. Representative result,n ≥ 5. Scale bars, 50 μm. f EZHIP and EZH2 IHC staining on human adult ovaries sections, black arrows indicate the follicles. Representative result,n ≥ 5. Scale bars, 30 μm
EZHIP is located on the X chromosome. In most species, it is a
monoexonic gene—that may indicate that it was generated by
retroposition—but in the mouse, splicing also creates a shorter
isoform. Using phylogenetic analysis by maximum likelihood
(PAML), we observed that EZHIP homologs are present across
Eutheria, but we did not identify any homologs outside of this
clade based on either sequence conservation or on synteny.
EZHIP genes have rapidly evolved both at the nucleotide and
amino acid levels, the rodent homologs being particularly distant
from the rest (Fig.
1c; Supplementary Fig. 1E). This contrasts with
the other PRC2 components, such as EZH2, which are highly
conserved across mammals (Supplementary Fig. 1E). No known
protein domain was predicted for EZHIP, and the only
distinguishing feature is a serine-rich region (Fig.
1c in green),
including a short amino acid stretch that is fully conserved in all
orthologs identified (Fig.
1c in purple). To characterize Ezhip
expression, we performed RT-qPCR on various tissues
(3-month-old females and males). Ezhip mRNA expression was particularly
high in ovaries; it was also expressed in testes, and much less in
other tissues (Fig.
1d). Of note, Ezhip transcript level appears at
least tenfold higher than any PRC2 core components or cofactors
in oocytes (Supplementary Fig. 1F). Ezhip’s pattern of expression
is distinct from that of Ezh2, which is expressed tissue wide, with
the strongest expression observed in the spleen. Analysis of public
gene expression data sets from fetal gonads
36indicates Ezhip is
preferentially expressed in E13.5 primordial germ cells (PGCs)
compared with somatic cells, correlating with germ cell
markers, such as Piwil2 or Prdm14 (Supplementary Fig. 1G).
Interestingly, Ezhip belongs to a set of genes referred to as
“germline-reprogramming-responsive” that become active
fol-lowing PGC DNA demethylation
37, as they are associated with
strong CpG island promoters. Similarly, in humans EZHIP is
highly transcribed in male and female PGCs from week 5 until
week 9 of pregnancy, while almost absent in ESCs and somatic
cells (Supplementary Fig. 1H)
38. We confirmed this observation
at the protein level by performing immunohistochemistry on
sections of testes and ovaries of human origin. hEZHIP protein
was detected in male germ cells inside the seminiferous tubules,
especially in spermatogonia and round spermatids (Fig.
1e). In
ovaries, EZHIP antibody stained primordial follicles and oocytes
(red arrows), but not the external follicle cells in contrast to EZH2
antibody, which stained both zones (Fig.
1f). To summarize,
EZHIP is a genuine cofactor of PRC2 in placental mammals. It is
a fast-evolving protein with no known protein domain, it is
expressed primarily in PGCs during development and remains
present in the adult gonad.
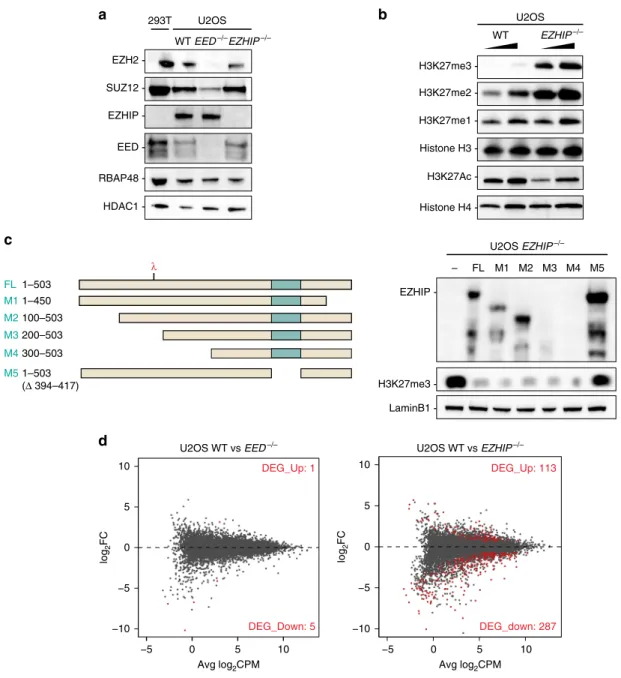
EZHIP is a negative regulator of PRC2 activity. To study the
molecular role of EZHIP, we sought a model cell line that would
express this factor endogenously. The EZHIP transcript is
undetectable from most cell lines, with the exception of U2OS, an
osteosarcoma-derived cell line (Supplementary Fig. 2A). We used
genome editing to generate U2OS clonal cells that were knockout
for EZHIP or for EED as a control for PRC2 inactivation (U2OS
EZHIP−/− and U2OS EED−/−, respectively). Both cell lines
were viable, and had not overt phenotype. Western blot showed
that deletion of EED destabilized the other PRC2 core
compo-nents, such as EZH2, while inactivation of EZHIP had no
dis-cernible effect on the accumulation of these proteins (Fig.
2a). We
then assessed H3K27 methylation and observed a robust increase
in H3K27me2/3 upon EZHIP deletion, while H3K27me1 was
stable and H3K27ac slightly reduced (Fig.
2b). Interestingly,
H3K27me3 level was very low in U2OS compared with extract
prepared from HEK-293T cells, which do not express EZHIP
(Supplementary Fig. 2B). To confirm that EZHIP deletion was
directly responsible for the increased H3K27me3 in U2OS, we
stably restored its expression using either full-length (FL) or
deletion mutants (Fig.
2c) as verified by western blot (WB) and
RT-q-PCR (Supplementary Fig. 2C). Upon re-expression of FL
and mutant EZHIP, H3K27me3 returned to basal levels (Fig.
2c,
d) with the notable exception of mutant M5 that lacks the
con-served amino acids stretch (Fig.
2c). Given that such deletion
abolishes EZHIP interaction with PRC2 in co-IP (mutant 6 vs.
mutant 7; Supplementary Fig. 2D), it stands to reason that EZHIP
likely regulates H3K27me3 deposition through direct interference
with PRC2 activity.
To determine whether these alterations of PRC2 activity
translate into aberrant gene expression, we analyzed the
transcriptome of U2OS in the different genetic contexts described
above by RNA-seq (Fig.
2d). Only a few genes were differentially
expressed in U2OS EED−/− as compared with WT (FDR < 0.05),
whereas ~500 genes were differentially expressed in EZHIP−/−
vs. WT. The majority of which were downregulated, as expected
considering the global gain of H3K27me3 repressive mark. Of
note, gene ontology analysis of the genes downregulated upon
EZHIP knockout did not reveal any robust categories
(Supple-mentary Fig. 2E). Altogether, these results reveal that EZHIP
inhibits the activity of PRC2 thus altering gene expression profile.
Interplay between H3K27me2 & me3 upon expression of
EZHIP. Having shown the effects of EZHIP on PRC2 activity at
the global level, we then investigated how this affects the
chro-matin landscape locally. First, we analyzed H3K27me3 genomic
distribution in the absence of EZHIP by chromatin
immuno-precipitation followed by sequencing (ChIP-seq). We used the
U2OS EED−/−, in which H3K27me3 is not detectable as a
negative control and compared it to the U2OS wild-type WT and
EZHIP−/−. Replicates were well correlated and the U2OS WT
and U2OS EED−/− clustered together, away from the U2OS
EZHIP−/− (Supplementary Fig. 3A). This agrees with our earlier
observation that H3K27me3 is very low in U2OS, as in the EED
knockout (Supplementary Fig. 2B). In contrast, there was a
genome-wide increase in H3K27me3 deposition upon deletion of
EZHIP (Fig.
3a), as demonstrated by the large number of peaks
detected in this context (Supplementary Fig. 3B).
To further characterize the role of EZHIP, we analyzed the
genome-wide distribution of H3K27me2, H3K27ac, and H2Aub in
U2OS WT vs. U2OS EZHIP−/− by “CUT&RUN”
39. Replicates
clustered together as expected (Supplementary Fig. 3C), and the
correlation matrix revealed that H3K27me2 in the U2OS WT
clusters with H3K27me3 in the EZHIP−/− condition, suggesting
that EZHIP limits the conversion of H3K27me2 into H3K27me3.
This global correlation is confirmed when zooming on a
specific region as illustrated by genome-browser screen shot (e.g.
DRGX, Fig.
3b). At this locus, H2Aub and H3K27ac displayed
only modest variations, and their enrichment appeared not
particularly affected by the deletion of EZHIP. Focusing
specifically on peaks that gain H3K27me3 upon deletion of
EZHIP (Fig.
3c), we noticed a general decrease of H3K27me2 with
a slight depletion around the peaks of H3K27me3 when
comparing U2OS WT to U2OS EZHIP−/− (Fig.
3d). Of note,
what happen for H3K27me2 at the regions gaining H3K27me3 in
the U2OS EZHIP−/− does not reflect the genome-wide trend.
Indeed, overall, we observe an increase of H3K27me2 illustrated
by the increase number of peaks in the absence of EZHIP
(Supplementary Fig. 3D). H3K27ac, which is known to
antic-orrelate with H3K27me2/3 enrichment, was low and appeared to
slightly decrease in the absence of EZHIP. Regarding H2Aub, the
enrichment of the mark is only modestly increased by the
deletion of EZHIP (Fig.
3d). If we focus on the TSS of genes either
upregulated or downregulated in the absence of EZHIP, we
observed again a robust increase of H3K27me3 and an increase of
H3K27ac for the downregulated genes and upregulated,
respec-tively, whereas the other histone marks are only slightly affected
(Fig.
3e). We conclude that EZHIP limits the activity of PRC2
favoring the deposition of H3K27me2 at regions normally
enriched for H3K27me3. Of note, this altered chromatin
landscape is reminiscent of what has been described upon
expression of H3K27M mutant oncogenic histone
40.
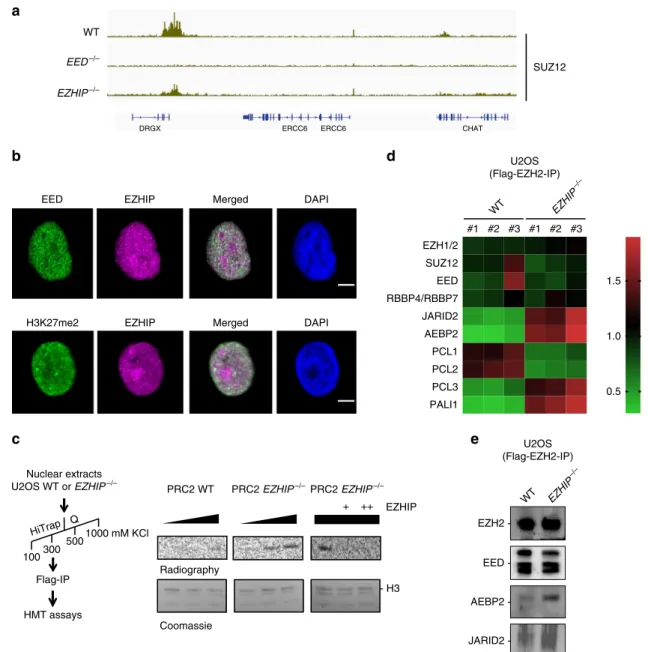
EZHIP impairs PRC2 activity, but not its binding to
chro-matin. Considering the inhibitory action of EZHIP on PRC2, we
next sought to explore the underlying mechanisms. First, we
hypothesized that EZHIP could limit PRC2 binding to chromatin.
To test this hypothesis, we performed CUT&RUN against SUZ12
to monitor PRC2 recruitment to chromatin, comparing U2OS
WT, U2OS EED−/−, and U2OS EZHIP−/−. Focusing again on
DRGX, we observed that SUZ12 enrichment is lost in the absence
of EED, whereas SUZ12 is enriched both in U2OS WT and U2OS
EZHIP−/− (Fig.
4a). This result held true when we analyzed
all the peaks that gain H3K27me3 in the absence of EZHIP
(Supplementary Fig. 4A). Overall, we observed a slight increase of
SUZ12 enrichment in particular at the regions
flanking the peaks.
Since our attempts to immunoprecipitate EZHIP were
unsuc-cessful, we used immunofluorescence (IF) to evaluate its
coloca-lization with EED and H3K27me2. The specificity of EZHIP
antibody by IF is demonstrated by the lack of signal in U2OS
EZHIP−/− (Supplementary Fig. 4B). In U2OS WT, EZHIP
U2OS EZHIP–/– WT EZHIP–/– U2OS EZHIP -FL M1 M2 M3 M4 M5 – FL M1 λ M5 M4 M3 M2 EZH2 HDAC1 EED RBAP48 EZHIP SUZ12 Histone H3 H3K27me3 H3K27me2 H3K27me1 -U2OS 293T
a
b
c
d
WT EED–/–EZHIP–/– Histone H4 H3K27Ac -1–503 1–450 100–503 200–503 300–503 1–503 (Δ 394–417) DEG_Up: 1 DEG_Down: 5U2OS WT vs EED–/– U2OS WT vs EZHIP–/–
DEG_Up: 113 DEG_down: 287 −10 −5 0 5 10 −5 0 5 10 log 2 FC −10 −5 0 5 10 −5 0 5 10
Avg log2CPM Avg log2CPM
log
2
FC
H3K27me3 LaminB1
-Fig. 2 EZHIP inhibits H3K27me3 deposition. a Western blot analysis of PRC2 core complex subunits (SUZ12, RBAP48, EED, and EZH2), EZHIP and HDAC1 (loading control) on U2OS nuclear extracts WT,EED−/−, and EZHIP−/−. b Western blot analysis of H3K27 methylation: H3K27me1, H3K27me2, H3K27me3, H3K27ac and, H3 and H4 (loading controls).c Scheme representing EZHIP mutants (left panel) stably reintroduced in U2OSEZHIP−/− line. The red lambda indicates the epitope recognized by antibody detecting EZHIP protein. Western blot analysis (right panel) of cell lines expressing EZHIP FL or mutants probed with antibodies indicated on the left.d Mean-difference plot showing average log2 counts per million (logCPM) vs. log2 fold-change (logFC) expression between U2OS WT andEED−/−69or U2OS WT and EZHIP−/− (right). Right corner: the number of genes significantly differentially
staining appeared as a diffuse nuclear staining which overlaps
partially with the signal detected for EED (Fig.
4b). Of note,
EZHIP staining tends to be excluded from the bright dots
detected with the anti-H3K27me2 antibody. Since EZHIP
mod-estly impacts PRC2 binding to chromatin but H3K27me3
deposition is impaired, this suggested that EZHIP may instead
interfere with PRC2 enzymatic activity. To test this hypothesis,
we
first evaluated whether a titration of purified EZHIP
(Sup-plementary Fig. 4C) inhibited the enzymatic activity of the
recombinant PRC2 core complex in a histone methyltransferase
assay. However, even at molar excess, EZHIP did not impact the
enzymatic activity of PRC2 (Supplementary Fig. 4D). We then
a
b
WT WT WT K27ac H2Aub K27me2 K27me3 WT EZHIP–/– EZHIP–/– EZHIP–/– EZHIP–/–EZHIP–/– EZHIP–/– EZHIP–/– EZHIP–/–
EED–/–
EED–/–
d
c
Peaks
–2.0 Start End 2.0 –2.0 Start End 2.0 –2.0 Start End 2.0 Kb –2.0 Start End 2.0 –2.0 Start End 2.0 –2.0 Start End 2.0 –2.0 Start End 2.0 –2.0 Start End 2.0 –2.0 Start End 2.0 Kb
10 30
WT WT WT WT
K27me3 K27me2 K27ac H2Aub
Peaks 1 3 5 DRGX ERCC6 CHAT
e
K27me3-EZHIP–/– K27me3-WT K27me2-EZHIP–/– K27me2-WT K27ac-EZHIP–/– K27ac-WT H2Aub-EZHIP–/– H2Aub-WT –3.0 TSS 3.0 Kb 0 2 4 6 8 10 1214 Genes upregulated in U2OS EZHIP
–/–
–3.0 TSS 3.0 Kb Genes downregulated in U2OS EZHIP–/–
0.0 1.5 3.0 4.5 6.0 7.5 9.0 10.5 12.0 0 8 16 24 32 40 48 56
Fig. 3 EZHIP-mediated interplay between H3K27me2 and H3K27me3. a Genome-browser representation of H3K27me3 enrichment in U2OS WT,EED−/−, andEZHIP−/−. Duplicates are merged, same scale for all tracks. b Corresponding Genome-browser representation of H3K27me2, H3K27Ac, and H2AK119ub in U2OS WT andEZHIP−/−. Duplicates are merged. Same scale for all tracks of the same histone modification. c, d Heatmaps and corresponding cumulative plots showing the enrichment for H3K27me3 (c) and, H3K27me2, H3K27Ac, and H2AK119ub (d) at the peaks (n = 34220) found to gain H3K27me3 upon deletion ofEZHIP. e Density plots showing the enrichment for H3K27me3, H3K27me2, H3K27ac, and H2Aub around the TSS of genes either upregulated or downregulated upon known out ofEZHIP as defined in Fig.2d
reasoned that EZHIP might regulate PRC2 activity only in the
presence of its cofactors. To test this hypothesis, we purified the
core PRC2 and its cofactors from U2OS and U2OS EZHIP−/−
cells that stably overexpress a Flag-tagged version of EZH2
(Supplementary Fig. 4D). EZH2 was immunoprecipitated, and
further purified through an ion-exchange column before
mon-itoring its activity on native histones. While we observed very low
methyltransferase activity toward H3 with PRC2 purified from
WT cells, the complex purified from U2OS EZHIP−/− was much
more active (Fig.
4c left vs. central panel). Furthermore, in contrast
to our observation, with the recombinant core PRC2 complex, the
titration of EZHIP on PRC2 purified from U2OS EZHIP−/−
inhibited PRC2 enzymatic activity (Fig.
4c right panel). These
results suggest that EZHIP might regulate PRC2 by mitigating its
interaction with its cofactors. To test this hypothesis, we analyzed
PRC2 interactome by mass spectrometry, depending on EZHIP
expression status. Overall, PRC2 displayed the same composition
(Supplementary Fig. 4F); however, the stoichiometry of the
cofactors appeared substantially different in the absence of
EZHIP (label-free quantification based on iBAQ). Namely, several
cofactors—AEBP2, JARID2, and PALI1—were present at a higher
stoichiometry in the IPs from EZHIP−/− cells. (Fig.
4d). We
confirmed this result by co-IP/WB investigating the interaction of
AEBP2 and JARID2 with EZH2 in IPs performed with nuclear
extracts prepared from U2OS wild-type or EZHIP−/− cells
(Fig.
4e). Our results suggest that EZHIP does not prevent PRC2
c
- H3 Coomassie Radiography PRC2 WT PRC2 EZHIP–/– Nuclear extracts U2OS WT or EZHIP–/– 300500 1000 mM KCl Flag-IP HMT assaysd
EED - AEBP2 -U2OS (Flag-EZH2-IP)e
JARID2 -EZH1/2 SUZ12 EED RBBP4/RBBP7 JARID2 AEBP2 PCL1 PCL2 PCL3 PALI1 0.5 1.0 1.5 #3 #2 #1 #3 #2 #1 WT EZHIP + ++ PRC2 EZHIP–/– U2OS (Flag-EZH2-IP)b
a
H3K27me2 EED EZHIPEZHIP Merged DAPI Merged DAPI SUZ12 WT EZHIP–/– EED–/– HiTrap Q 100 EZHIP –/– WT EZHIP –/– EZH2 -
DRGX ERCC6 ERCC6 CHAT
Fig. 4 EZHIP mitigates PRC2-cofactors interactions. a Genome-browser representation of SUZ12 enrichment in U2OS WT,EED−/−, and EZHIP−/−. Duplicates are merged, same scale for all tracks.b Immunofluorescence staining of EED and EZHIP (top) or H3K27me2 and EZHIP (bottom) on U2OS, nuclei are stained with DAPI. Representative results. Scale bar, 2μm. c Left, purification scheme for PRC2. Right, histone methyltransferase (HMT) assay to monitor the enzymatic activity of PRC2 purified from WT (left panel) or EZHIP−/− (middle panel) U2OS cells (titration: 1, 2, 5 × ) on native nucleosomes. Right panel, same assay as previously, but this time titrating recombinant hEZHIP on PRC2-purified from EZHIP−/− U2OS cells (PRC2 quantity 5 × ). The upper panels are autoradiography, and the lower panels are the corresponding SDS-PAGE coomassie staining. Representative image.d Quantification of EZH2-Flag IP through mass spectrometry (iBAQ values). Heatmap representing the Log2-transformed median centered values. Horizontal axis: U2OS WT andEZHIP−/−, n = 3. Vertical axes: PRC2 components. Values are normalized on iBAQ values from untagged U2OS WT and EZHIP−/−. e EZH2-Flag Co-IP from nuclear extracts either WT orEZHIP−/−, and probed with antibodies against EZH2, EED, AEBP2, or JARID2
binding to chromatin, but limits the stimulatory action of
cofactors, such as AEBP2 and JARID2 on its enzymatic activity.
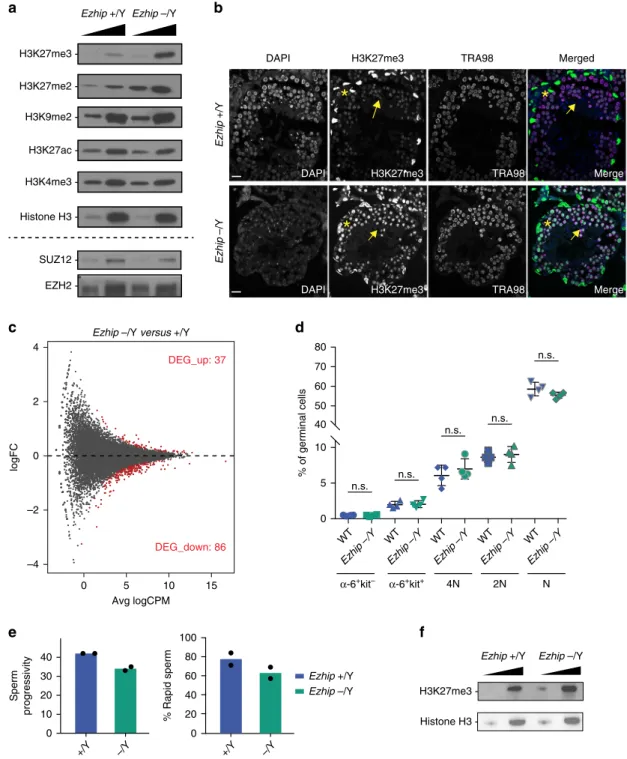
Ezhip−/− males are fertile despite H3K27me3 increase. To
study the role of EZHIP in a more physiological environment, we
generated a knockout mouse model in which a
CRISPR-Cas9-induced deletion of 1.5 Kb removes most of the gene body
(Supplementary Fig. 5A). Accordingly, Ezhip mRNA and protein
were absent from testis and from ovaries (Supplementary Fig.
5B–D), two organs where Ezhip is preferentially expressed. Of
note, expression of the genes
flanking Ezhip (Nudt10 and Nudt11)
were unaffected by the deletion (Supplementary Fig. 5B, D). Ezhip
mice (−/− or −/Y) did not show any overt developmental defect,
with adults appearing undistinguishable from the wild-type.
We
first investigated the expression of Ezhip during
spermatogenesis in the different subpopulations of germ cells
sorted from adult mice based on staining for
α6-integrin, the
tyrosine kinase receptor c-Kit, and DNA content, as previously
described
41,42. Ezhip was mostly expressed in spermatogonia
(α6-integrin positive, Supplementary Fig. 5E). Its expression
was very low in spermatocytes I and II, consistent with the
global transcriptional inactivation of the X chromosome at
these stages
43, in contrast to Ezh2 expression, which increases
at the
final stages of differentiation (4n, 2n and n;
Supplemen-tary Fig. 5E).
We then tested whether deletion of Ezhip could enhance
H3K27me3 deposition during spermatogenesis, as it does in
U2OS cells. For this, we probed nuclear extracts from whole testes
of adult mice by western blot. As shown in Fig.
5a, amounts of
H3K27me2 and me3 increased by about twofold in the absence of
EZHIP, whereas other histone marks remain unchanged.
Consistent with our previous observations, this effect was not
due to a direct effect on the protein accumulation of PRC2 core
components (Fig.
5a bottom panel).
To identify the cellular origin of this H3K27me2/me3
upregulation, we performed immunofluorescence on testis
sections. Triangle-shaped somatic Sertoli cells—identified by
the presence of two satellite chromocenters in their nuclei after
DAPI staining—were strongly positive for H3K27me3 in both
WT and KO condition (Fig.
5b, yellow star;
44). In contrast,
germ cells—identified by expression of the germ cell marker
TRA98—displayed much stronger H3K27me3 signal in Ezhip
−/Y mice compared with WT littermates (Fig.
5b, yellow
arrows). This suggest that EZHIP does not regulate H3K27me3
deposition in somatic cells of the testis. Indeed, in Dnmt3l
mutant testes that are germ cell free
45, no consistent variation
in H3K27me3 patterns was observed in presence or absence of
EZHIP (Supplementary Fig. 5F).
To evaluate the
functional consequences of aberrant
H3K27me3 deposition, we profiled gene expression of α6
+c-kit
-undifferentiated spermatogonia in WT and Ezhip
−/Y mice.
Gene expression was moderately affected by the absence of
EZHIP: about 125 genes differentially expressed (FDR < 0.05,
Fig.
5c), the majority of which were downregulated. To
determine the impact on spermatogenesis, we analyzed the
different germ cell subpopulations from WT and Ezhip
−/Y
testes by cell cytometry. The relative sizes of these
subpopula-tions were unaffected (Fig.
5d; Supplementary Fig. 5F), in
agreement with the normal testis-to-body weight ratio and
normal fertility of Ezhip
−/Y males (Supplementary Fig. 5G).
Finally, we evaluated sperm quality through computer-assisted
images analysis of spermatozoa. Spermatozoa motility was not
substantially affected, although spermatozoa from Ezhip
−/Y
males showed slightly less progressive motility, and were a bit
more static (Fig.
5e; Supplementary Table 1). While most
histones are replaced by protamine in mature spermatozoa, a
small minority carrying various histone modifications including
H3K27me3 is retained
46–48. To determine whether Ezhip
deletion impacts this residual H3K27me3, we quantified this
mark in the epidydimal sperm. Western blot of sperm extracts
isolated from Ezhip
−/Y mice displayed higher H3K27me3 levels
compared with sperm originating from WT animals (Fig.
5h).
Whether this upregulation has any functional consequences
remains to be investigated, nonetheless, these results confirm the
inhibitory activity of EZHIP on H3K27me3 deposition in male
germ cells. Interestingly, they reveal that an excess of H3K27me3
is compatible with spermatogenesis and male fertility.
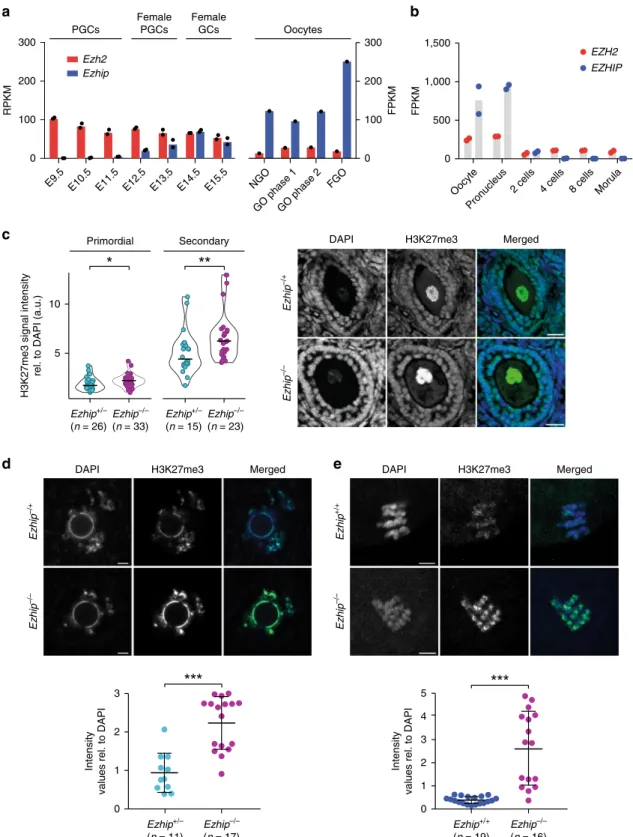
EZHIP controls H3K27me3 deposition in postnatal oocytes. In
female, classical assembly of chromatin is conserved throughout
oogenesis. While the genome-wide deposition of H3K27me3 in
PGCs remains to be investigated, H3K27me3 was reported to be
progressively restricted during oogenesis to
“non-canonical”
locations, such as intergenic regions and gene deserts
28. To assess
whether EZHIP could play a role in the regulation of H3K27me3
during different stages of female germline, we
first investigated its
expression in available data sets in specified germ cells and in
postnatal stages of oocyte development. Ezhip is very lowly
expressed in migrating PGCs (E9.5), as they entered the genital
ridges (E10.5), and as they undergo epigenetic reprogramming
(E12.5)
27. Its expression increases and mirror the one of Ezh2
only in later germ cells ((GCs) E14.5–E15.5) (Fig.
6a, left panel,
data from
49)). Interestingly, Ezhip expression is much higher in
postnatal oocytes at all stages of growth (Fig.
6a, left and right
panels, data from
49,]50). Ezhip expression drops sharply post
fertilization (Fig.
6b). Considering this pattern, we evaluated
H3K27me3 levels in postnatal gametes. We performed
pre-pubertal female follicles (P17) immunofluorescence against
H3K27me3 in wild-type and Ezhip−/− conditions. H3K27me3
levels were slightly higher in Ezhip−/− primordial follicles
compared to WT (Fig.
6c, right panel for quantification). As this
difference became more pronounced in secondary follicles (Fig.
6c), we went on investigating H3K27me3 levels at the fully grown
oocyte (FGO) stage in adult females. We
first harvested germinal
vesicle (GV) oocytes from 3-month-old female siblings and
stained for H3K27me3 and DAPI; H3K27me3 levels appeared to
be around twice more abundant in Ezhip−/− oocytes, both in the
less condensed chromatin state with no rim surrounding the
nucleolus (NSN) and in the fully condensed chromatin state with
a DNA-dense rim surrounding the nucleolus (SN) (Fig.
6d;
Supplementary Fig. 6A). Of note, this effect was specific to
H3K27me3 modifications, as H3K4me3 levels were not lower in
NSN oocytes (Supplementary Fig. 6B). Finally, a strong increase
in H3K27me3 deposition was also observed in mature MII
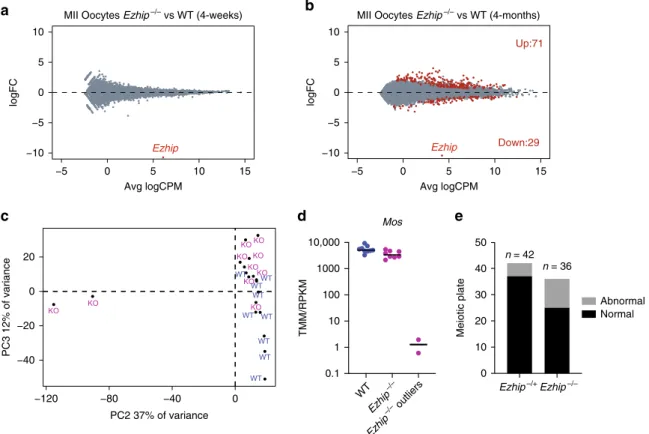
oocytes from 4-month-old Ezhip−/− females (Fig.
5e). We
conclude that EZHIP restrains the deposition of H3K27me3
during oocyte maturation.
Oocyte defects upon deletion of
Ezhip. To evaluate the
con-sequences of this global gain in H3K27me3 on gene expression,
we
first analyzed the transcriptome of a pool of MII oocytes
harvested after superovulation of pre-pubertal females (4-weeks
old). RNA-seq analysis revealed a very similar transcriptome for
the mutant oocytes compared with WT (Fig.
7a). We next
investigated whether transcriptomic alterations could appear with
aging, as well as if there could be some variability in the
tran-scriptome of individuals oocytes. To this end, we performed
single-oocyte-RNA-seq (9 WT and 10 Ezhip−/− 4-month-old
oocytes). We
first ran the comparison between wild-type to
mutant in aged oocytes by pooling the single-cell results to mirror
our analysis with younger females. We observed that in aged
oocytes, the number of significantly differentially expressed genes
remains limited, although the comparative expression pattern
appears more dispersed (Fig.
7b). This prompted us to determine
whether there could be some heterogeneity in terms of gene
expression among the oocytes as observed for global H3K27me3
level (Fig.
6d, e). To address this question, we performed principal
component analysis of single oocytes. This revealed that while
most of the oocytes (regardless of Ezhip expression) clustered
together, two Ezhip−/− oocytes, originating from distinct
mice, were clear outliers (Fig.
7c). One of the top genes
differentially expressed comparing the outliers and the rest of the
H3K27ac H3K4me3 H3K27me3 Histone H3 H3K9me2 -Ezhip –/Y
d
a
b
EZH2 SUZ12 H3K27me2-c
Ezhip –/Ye
DAPI DAPI DAPI H3K27me3 H3K27me3*
*
H3K27me3 Merge Merge*
*
Merged TRA98 TRA98 TRA98f
Avg logCPM DEG_up: 37 DEG_down: 86 4 2 –2 –4 0 5 10 15 logFC 0Ezhip –/Y versus +/Y
Ezhip +/Y Ezhip –/Y Ezhip +/Y Ezhip +/Y Ezhip +/Y Ezhip –/Y 0 20 40 60 80 100 % Rapid sperm +/Y –/Y 0 10 20 30 40 Sperm progressivity +/Y –/Y α-6+kit– α-6+kit+ 4N 2N N WT Ezhip –/Y WT Ezhip –/Y WT Ezhip –/Y WT Ezhip –/Y WT Ezhip –/Y 0 5 10 40 50 60 70 80 % of germinal cells n.s. n.s. n.s. n.s. n.s. Histone H3 H3K27me3
-Fig. 5 Global increase of H3K27me2/3 in male germ cellsEzhip−/−. a Western blot analysis of H3K27ac, H3K4me3, H3K27me3, H3K27me3, H3K9me2, and H3 on whole testis extracts WT andEzhip −/Y (titration 1, 2.5×). Bottom, same extracts probed for EZH2 and SUZ12. b Immunofluorescence detection of H3K27me3 (green) and TRA98 (purple) in testis sections (6-month-old mice). The nucleus is stained with DAPI. Representative results,n ≥ 2. Scale bar, 25 um. c Mean-difference plot between adult male WT andEzhip −/Y sorted spermatogonial population. Differentially expressed genes are highlighted in red (upregulated: 37; downregulated: 86, FDR < 0.05),n = 2. d Quantification of spermatocyte I (4 N), spermatocyte II (2 N), spermatids (N), and differentiating (a-6+ kit + ), and undifferentiated spermatogonial (a-6 + kit-) by FACS in percent of the total germinal cell population from WT and Ezhip −/Y mice (mean ± sem,n = 4, Significance: unpaired, non-parametric test of Kologorov–Smirnov). e Sperm quality was measured using computer-assisted IVO technologies comparing WT andEzhip −/Y knockout males. Lower left panel: percent sperm progressivity. Lower right panel: percent sperm rapidity (mean, n = 2). f Western blot analysis of H3K27me3 and H3 on mice sperm extracted from WT andEzhip −/Y animals
a
b
c
d
e
Oocyte Pronucleus
2 cells 4 cells 8 cells Morula
1,500 1,000 500 0 FPKM EZHIP EZH2
DAPI H3K27me3 Merged DAPI H3K27me3 Merged
Intensity
values rel. to DAPI
3 2 1 0 3 2 1 0 5 4 Intensity
values rel. to DAPI
DAPI H3K27me3 Merged
Ezhip+/– (n = 26) Ezhip–/– (n = 33) Ezhip+/– (n = 11) Ezhip–/– (n = 17) Ezhip+/+ (n = 19) Ezhip–/– (n = 16) Ezhip+/– (n = 15) Ezhip–/– (n = 23) Ezhip –/– Ezhip –/+ Ezhip –/– Ezhip –/+ Ezhip –/– Ezhip +/+
H3K27me3 signal intensity
rel. to DAPI (a.u.)
10 5 Primordial Secondary 0 100 200 300 RPKM NGO GO phase 1GO phase 2 FGO FPKM 300 200 100 0 Ezhip Ezh2
E9.5 E10.5 E11.5 E12.5 E13.5 E14.5 E15.5
PGCs
Female PGCs
Female
GCs Oocytes
Fig. 6 Mature oocyteEzhip−/− displays an altered epigenetic landscape. a Ezhip and Ezh2 expression (RPKM and FPKM) in germ cells during embryonic development and in oocytes isolated at different stages of follicular growth (PGC primordial germ cells, GC germ cells, NGO non-growing oocyte, GO growing oocyte phase I (8–14dpp) and phase II (15dpp), FGO fully grown oocytes; the data extracted from GSE94136 & GSE70116). b Single-cell RNA-seq Ezh2 and Ezhip expression data on early embryo developmental phases (oocyte, pronucleus, two cells, four cells, eight cells, and morula, data from GSE80810).c Quantification of H3K27me3 levels in P17 old females primordial and secondary follicles detected by immunofluorescence. Right, H3K27me3 intensities are normalized to DAPI. Left, representative image of secondary follicles stained with DAPI, H3K27me3, and merge,Ezhip + /− vs. Ezhip−/− . Scale bars, 30μm. d Quantification of H3K27me3 levels by immunofluorescence in mouse surrounded nuclei (SN) GV oocytes. Top representative picture, bottom quantification. Scale bars, 5 μm. e Quantification of H3K27me3 levels by immunofluorescence in mature mouse MII oocytes. Top representative picture, bottom quantification. Scale bars, 5 μm. c–e Mean ± s.d., each dot represents a follicle, n indicated on the graph. Significance: unpaired, nonparametric test of Kologorov–Smirnov, ***P ≤ 0.001, **P ≤ 0.01, *P ≤ 0.05
Ezhip−/− oocytes was Mos (Fig.
7d). Mos has been shown to be
required for MAP kinase activation during oocyte maturation,
and its deletion impairs microtubules and chromatin organization
during the MI to MII transition
51. Next, we checked the
chro-mosome metaphase plate in MII oocytes, and found that Ezhip
mutant mice displayed a slight increase in the number of oocytes
with lagging chromosomes compared with control (6-week-old;
Fig.
7e). Our single oocytes RNAseq and staining of individual
oocytes revealed some heterogeneity in oocyte maternal pool as
well as in general competence for fertilization. Altogether, our
results support a general role for EZHIP in oocyte
fitness by
regulating H3K27me3 deposition.
Impaired fertility of
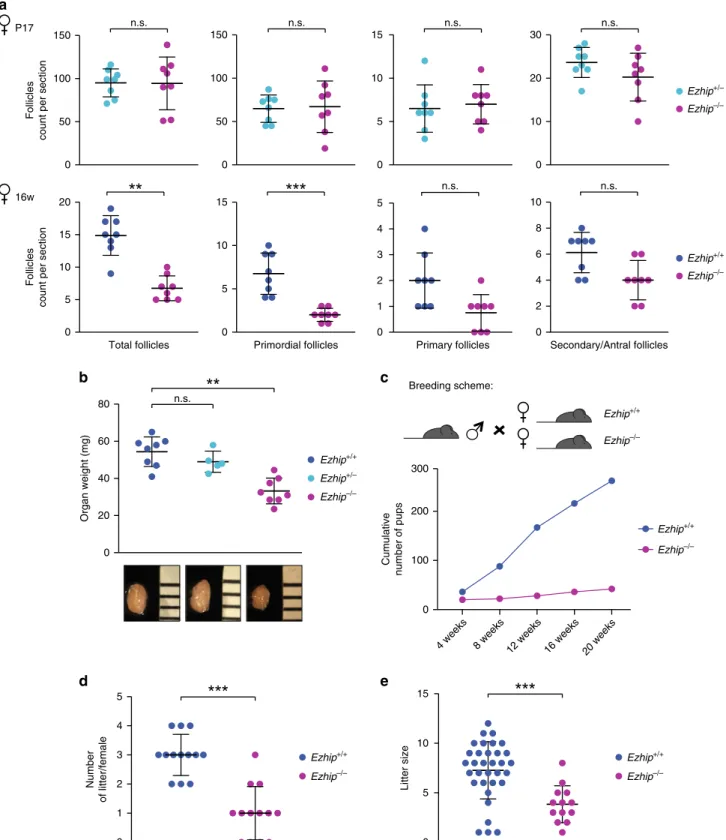
Ezhip knockout females. We next
investi-gate whether EZHIP could be involved in the control of follicle
maturation. We did not observe any significant differences in the
number of primordial, primary, and secondary/antral follicles of
pre-pubertal females (P17) regardless of Ezhip expression status,
indicating that the initial oocyte pool is apparently intact (Fig.
8a,
top panels). In contrast, sections from older females (16 weeks)
showed a global reduction in the follicle number in the absence of
EZHIP (Fig.
8a, bottom panels), although the low number of
mature follicles (primary and secondary/antral) at this age was
insufficient to reach statistical significance. Collectively, these data
suggest a progressive, age related, exhaustion of primordial follicle
reserve, from which growing follicles develop. Incidentally,
ovaries from Ezhip−/− females appeared smaller, with a weight
that was reduced by about 30% compared with wild-type and
heterozygous counterparts (Fig.
8b).
In line with these results, we observed that Ezhip−/− female
mice give rise to fewer progeny. We therefore monitored their
fertility by comparing the size and number of litters of WT vs.
mutant females (Fig.
8c). Six-week-old WT and Ezhip−/−
females were mated with a reliably fertile male in the same cage,
and monitored daily for 20 weeks (Fig.
8c). All litters were
genotyped to assign them to the correct mother; the numbers of
mice at birth and at 3 weeks of age (time of genotyping) were
similar. However, the total number of pups obtained from
Ezhip−/− mothers considerably decreased each month, as the
females aged (Fig.
8c). This reflected both a reduction in litter
number (WT females gave birth to around three litters over a
period of 20 weeks while mutant females gave birth to only one
litter) and litter size (WT females gave birth to an average of 8
pups/litter while the Ezhip−/− average litter size was around 3/4
pups/litter) (Fig.
8d). This result is unlikely to result from
developmental defects of the reproductive track since uterine
horns appeared normal in adult Ezhip−/− females
(Supplemen-tary Fig. 7).
We conclude from these experiments that absence of Ezhip in
oocytes leads to alterations of the epigenetic landscape and is
associated to strong reduction in female fertility. Whether the
impairment in oocyte pool and its
fitness might impair
subsequent development of the embryo around and after
fertilization remains to be determined.
a
MII Oocytes Ezhip–/– vs WT (4-weeks)e
n = 42 n = 36 0 10 20 30 40 50 Meiotic plate Normal Abnormalc
MII Oocytes Ezhip–/– vs WT (4-months)
b
−10 −5 0 5 10 −5 0 5 10 15 Avg logCPM logFC −10 −5 0 5 10 −5 0 5 10 15 Avg logCPM logFCd
WT WT WT WT WT WT WT WT WT KO KO KO KO KO KO KO KO KO KO −40 −20 0 20 −120 −80 −40 0 PC2 37% of variance PC3 12% of variance Ezhip Ezhip WT Ezhi p–/– Ezhi p–/– outliers 0.1 1 10 100 1000 10,000 TMM/RPKM Mos Up:71 Down:29 Ezhip–/+Ezhip–/–Fig. 7 Characterization ofEzhip−/− oocytes. a Mean-difference plot showing log2 fold-change (logFC) expression vs. average log2 counts per million (logCPM) for MII oocytes obtained from 4 weeksEzhip + /− and Ezhip−/− superovulated females, n = 2 (each n is a pool of two individual animals). b Expression vs. log2 fold-change (logFC) expression vs. average log2 counts per million (logCPM) for MII single oocyte obtained from 4-month-oldEzhip + /− and Ezhip−/− superovulated females,n = 9 for WT and n = 10 for Ezhip−/−. Oocytes originated from two different mice for WT and 3 for Ezhip−/−. c Principal components analysis of each individual oocyte transcriptome.d Mos expression according to the single oocyte RNAseq included in (c). e Chromosome abnormalities evaluated as a proportion of matured MII stages oocytes that exhibited normal alignment of chromosomes on spindle vs. matured MII stages oocytes with lagging chromosomes
a
b
P17 Ezhip+/– Ezhip–/– Ezhip+/+ Ezhip–/– Ezhip+/+ Ezhip–/– Ezhip+/+ Ezhip–/– Ezhip+/+ Ezhip–/– Ezhip+/+ Ezhip+/– Ezhip–/– Folliclescount per section
16w
Follicles
count per section
150 100 50 0 0 5 10 15 20 n.s.
Total follicles Primordial follicles 15 10 5 0 0 1 2 3 4 5 n.s. n.s. Primary follicles 30 20 10 0 0 2 4 6 8 10 n.s. n.s. Secondary/Antral follicles 150 100 50 0 0 5 10 15 n.s.
d
Organ weight (mg) 0 20 40 60 80 n.s. Number of litter/female 3 2 1 0 5 4c
e
20 weeks 300 200 100 0 Cumulative number of pups 0 Litter size 15 10 5 Breeding scheme: Ezhip+/+ Ezhip–/–4 weeks 8 weeks 12 weeks 16 weeks
Fig. 8Ezhip knockout affects adult female fertility. a Follicle counting on WT vs. Ezhip−/− 2 week-old female slides and 16-week-old, upper and lower panel, respectively (eight slides counted for each genotype, mean ± s.d.). Left panel corresponds to the total number of follicles, then each panel corresponds to a different folliculogenesis step: primordial follicles, primary follicles, secondary/antral follicles.Y-axis represents the average follicles number per slide, genotype is indicated in the legend.b Average ovaries weight (mg) in adult females (4–5-month-old, mean ± s.d., each dot represents an independent female).c–e Fertility of WT and Ezhip−/− females monitored during 5 months. c Cumulative number of pups per genotype depending on time (n = 13 cages, breeding scheme represented on top). d The number of litters per female during the 20 weeks monitoring. e Litter size. a, b, d, e Significance: unpaired, non-parametric test of Kologorov–Smirnov, ***P ≤ 0.001, **P ≤ 0.01
Discussion
Gametogenesis entails significant reprogramming of the
epigen-ome. While histone replacement in spermatogenesis and the
progressive loss of DNA methylation during germ cell
specifica-tion are well documented
27,52, less is known about the regulation
of histone posttranslational modifications during this process.
Here, we focus on the Polycomb complex PRC2 to investigate this
question. We identify an additional PRC2 interacting protein
specific to the gonad and showed that it inhibits PRC2 enzymatic
activity. Inactivation of this factor leads to a global increase of
H3K27me3 during both spermatogenesis and oogenesis.
Altera-tion of the epigenetic content of oocytes leads to a severely
compromised fertility.
The PRC2 complex exists in several
flavors, depending on
which enzymatic subunits it is formed around (EZH1 or EZH2)
and depending on which set of cofactors it interacts with
7. It is
known that EZH1 and EZH2 exert redundant functions in
spermatogenesis
25, consistent with this redundancy both subunits
have a similar interactome in adult mouse testis. Among it,
EZHIP contrasts with most of the cofactors identified to date: (i)
its expression seems mostly restricted to germ cells, (ii) homologs
have only been found in Eutherians and it is a fast-evolving
protein, (iii) it is a robust inhibitor of PRC2 enzymatic activity,
and (iv) it pulls down the entire PRC2 interactome. These last two
characteristics are likely linked: it is expected that effective
inhi-bition of PRC2 requires all
flavors of PRC2 to be regulated. The
poor sequence conservation of EZHIP sequence and its rather
disordered structure prediction are more surprising considering
that PRC2 and its cofactors are, in contrast, very well conserved.
This suggests that the specificity of action of EZHIP on PRC2
could be primarily conferred by the conserved stretch of 13
amino acids. Such a mechanism involving a short-linear motif in
direct contact with binding partners (including chromatin
modifiers) is a common strategy for parasites such as toxoplasma
to manipulate the host cellular machineries
53. It will be
particu-larly interesting to perform structural analyses in order to
pre-cisely determine how this interaction occurs, how it interferes
with the binding of AEBP2, JARID2, or PALI1 to PRC2, and how
this impairs the enzymatic activity of PRC2 without impacting its
recruitment to chromatin.
Another interrogation raised by this study is the advantage of
expressing an inhibitor of PRC2 to limit H3K27me3 deposition in
the gonads rather than downregulating the enzyme itself. We
speculate that an inhibitor enables a tighter control over the
timing of the reduction in PRC2 activity. Consistent with this
possibility, Ezhip was recently identified among a set of genes that
is expressed in PGCs, in response to the developmental DNA
demethylation of the germline genome
37. Of note, its localization
on the X chromosome, explains that it remains expressed in
oocytes while it is silenced in spermatocytes due to meiotic sex
chromosome inactivation. The link between the wave of DNA
demethylation and expression of this inhibitor of PRC2 raises the
question of whether both processes are functionally related (i.e.
whether PRC2 has to be inhibited when DNA methylation is
lowered). It will be interesting to map H3K27me3 deposition in
Ezhip−/− oocytes in order to determine whether it maintains
broad enrichment in intergenic regions or at gene deserts
30and
also, whether it could impact on the reestablishment of DNA
methylation during oocyte growth.
Recent reports have shown that H3K27me3 on the maternal
genome is important for the regulation of allele-specific gene
expression
23, and therefore that disrupting PRC2 activity in
oocyte through the deletion of Eed impairs, post-fertilization, the
allelic expression of a subset of genes
54. Conversely, it is tempting
to speculate that PRC2 activity might be limited by EZHIP in
order to prevent it from invading genomic regions and thus
potentially promoting excessive imprinting. Our results also
suggest that excessive H3K27me3 levels resulting from Ezhip
deletion in testicular germ cells are partially retained in mature
spermatozoa. Although it does not seem to impact on the
ferti-lizing properties of the spermatozoa, it will be interesting to
determine whether embryos derived from oocytes fertilized with
Ezhip−/− sperm develop normally. If they do, it would be
con-sistent with the report that paternally inherited H3K27me3 is
rapidly erased in the zygote, and carries limited intergenerational
potential
28.
Finally, both gain and loss of PRC2 function are a recurrent
observation in cancers. While we were completing this study,
another publication reported the identification of EZHIP
(CXORF67) as an inhibitor of PRC2 in two cancer cell lines
(U2OS and Daoy Cells
55). This demonstrates another means by
which cancer cell lines might curtail PRC2 function. Further
studies are required to know whether EZHIP upregulation might
be a recurrent event in cancers and act as a driver of tumor
progression. Of note, EZHIP has also been involved in gene
translocations occurring in endometrial stromal sarcoma, a rare
malignant tumor of the uterus
56. Previous reports revealed
fre-quent fusion between the transcriptional repressor JAZF1 and the
PRC2 core component SUZ12, and it was proposed that this
fusion could alter PRC2 function
57. Interestingly, PRC2-cofactors
can also be involved in fusions with transcriptional regulators, as
it is the case for PHF1 with JAZF1, MEAF6, or EPC1
58. Our study
extends this observation by showing that the fusion between
EZHIP and the nuclear protein malignant brain tumor
domain-containing 1 (MBTD1) could result in aberrant PRC2 targeting
58.
It will be important to investigate how these fusions contribute to
tumor progression and whether the inhibition of PRC2 could
constitute a therapeutic strategy.
Methods
Cloning. mEzhip cDNA clone was obtained from ORIGENE (Ref. MG214772). hEZHIP cDNA clone was amplified from HEK-293T genomic DNA. hEZHIP mutant 1 (a.a. 1–420), EZHIP mutant 2 (a.a.100–503), EZHIP mutant 3 (a.a. 200–503), EZHIP mutant 4 (a.a. 300–503), EZHIP mutant 6 (a.a. 1–450), and EZHIP mutant 7 (a.a. 1–395) were generated by PCR and cloned into pMSCV-Hygromycin retroviral vector and/or pCMV4-HA. EZHIP mutant 5, depleted of 13AA conserved stretch (a.a.1–503, Δ 394–417) was generated by amplifying the twoflanking parts by PCR with overlapping overhangs59. EZHIP and Ezhip cDNA
were amplified by PCR and subcloned into pREV retroviral vector (gift form S. Ait-Si-Ali), downstream a 2 × -Flag-2 × -HA sequence and upstream IRES followed by CD25 cDNA.
Cell lines. U2OS (ATCC) and HEK-293T (Invitrogen) cell lines were grown according to the manufacturer’s instructions. Cell lines were tested for the absence of mycoplasma every month. All transfections were performed using PEI (poly-ethylenimine) and 150 mM NaCl at 6:1 ratio to DNA. U2OS EED−/− cell line was generated by co‐transfecting (i) gRNA targeting EED, (ii) hCas9, and (iii) a tar-geting cassette bearing Hygromycin resistanceflanked by 1 kb sequences homo-logous to EED locus. Hygromycin B clone selection was performed at 0.2 mg/ml. U2OS EZHIP−/− cell line was generated by the same strategy with a targeting construct conferring puromycin resistance (selection was performed at 0,5 mg/ml). Selected U2OS EZHIP−/− clone has also undergone NHJ reparation with around 20 bp deletion at the N-terminal part of the sequence. Rescue experiments on U2OS EZHIP−/− cell line was performed by infection with retroviral vectors expressing EZHIP FL or mutants stably selected with Hygromycin B 0.2 mg/ml.
HeLa-S3 cells (gift form S. Ait-Si-Ali) were grown in the DMEM. pREV retroviruses are produced by transfecting of 293T-Phoenix cell line (gift form S. Ait-Si-Ali) and collecting supernatant after 60 h. HeLa-S3 cells were infected by incubation with viral supernatants for 3 h at 37 °C. Infected cells were then selected by FACS sorting using an anti-CD25-FITC-conjugated antibody and following manufacturer instructions (BD Biosciences 553866). Expression of the recombinant proteins were assessed by WB analysis of nuclear extracts.
Retroviral production. Production of pMSCV-Hygromycin retroviral vectors was performed in 293T cells. Transduction was performed by incubating the cells with viral particles mixed with Polybrene (final concentration, 8 μg/ml) for 3 h at 37 °C and subsequently selected with Hygromycin B was added at 0.2μg/ml.