HAL Id: dumas-02418474
https://dumas.ccsd.cnrs.fr/dumas-02418474
Submitted on 18 Dec 2019HAL is a multi-disciplinary open access archive for the deposit and dissemination of sci-entific research documents, whether they are pub-lished or not. The documents may come from teaching and research institutions in France or abroad, or from public or private research centers.
L’archive ouverte pluridisciplinaire HAL, est destinée au dépôt et à la diffusion de documents scientifiques de niveau recherche, publiés ou non, émanant des établissements d’enseignement et de recherche français ou étrangers, des laboratoires publics ou privés.
Syndrome de Gordon-like induit par les
anticalcineurines : une approche clinique et biochimique
Ludovic Di Ascia
To cite this version:
Ludovic Di Ascia. Syndrome de Gordon-like induit par les anticalcineurines : une approche clinique et biochimique. Sciences du Vivant [q-bio]. 2019. �dumas-02418474�
UNIVERSITE DE BORDEAUX
UFR SANTE
Thèse pour l’obtention du Diplôme d’État de Docteur en Médecine
Discipline : Néphrologie
Thèse N° 3027
Présentée et soutenue publiquement le 19 avril 2019 par Ludovic Di Ascia, né le 10/10/1989 à Marseille (13)
Directeur de thèse :
Monsieur le Professeur Dominique Eladari
Rapporteur :
Monsieur le Professeur Pierre Merville
Membre du jury :
Monsieur le Professeur Lionel Couzi………...Président Monsieur le Professeur Pierre Merville………Juge Monsieur le Professeur Christian Combe………Juge Monsieur le Professeur Henri Vacher-Coponat………..Juge Monsieur le Professeur Dominique Eladari……….Juge
Syndrome de Gordon-like induit par les anticalcineurines:
REMERCIEMENTS
Aux Membres du jury,
M. le Professeur Lionel Couzi, merci d’avoir accepté d’être le directeur de ce jury de thèse et de m’avoir fait confiance pour la mise en place de MANGUE. Les 9 mois dans le service ont permis d’accoucher d’une belle progression, dont tu es l’un des plus éminents parents.
M. le Professeur Pierre Merville, merci d’avoir accepté d’être le rapporteur de ce travail. Après l’encadrement de mon mémoire, vous marquez un peu plus mon internat. Il y aura un peu de vous dans l’air sauvage de Mongolie.
M. le Professeur Christian Combe, merci d’avoir accepté de juger ce travail. Merci pour votre culture encyclopédique, et pour m’avoir initié aux jeans 100% français.
M. le Professeur Henri Vacher-Coponat, merci d’avoir accepté de juger ce travail. Depuis les montagnes marseillaises aux collines réunionnaises, il existe de si jolis parcours.
M. le Professeur Dominique Eladari, merci d’avoir accepté de juger ce travail. Quand je repense à toutes ces étapes franchies…quelle satisfaction de présenter cette thèse !
Docteur Régine Chambrey, merci de m’avoir accueilli dans ton équipe au C.Y.R.O.I et de t’être autant investie dans ce travail. Depuis les premières mises au point jusqu’au dernier western blot analysé dans le laboratoire, tu as fourni énormément de moyens techniques, humains et financiers pour mener à bien le projet. Je sors enrichi de cette année auprès de Jennifer et toi. Un grand merci au Docteur Jennifer-Barraka Vidot, post-doctoresse de très bons conseils, qui travailla les mises au point bien avant mon arrivée, et m’appris (très) patiemment toutes les étapes des techniques utilisées (et ce ne fut pas facile pour moi !). Merci pour ton investissement et ton soutien.
Merci également au Docteur Cyril Ferdynus, statisticien patient et efficace, que répondit toujours présent et avec rapidité !
Ce travail n’aurait pu être réalisé sans l’aide d’autres (nombreux) intervenants. Je pense tout particulièrement à l’aide inestimable de Jeanine, secrétaire mère de toute chose, et à Mélanie; à tout le personnel infirmiers et aide soignants de Bordeaux et la Réunion qui a participé au recrutement des patients, ; aux A.R.C Caroline Aurélie et Audrey, de vraies flèches ; à Céline de la DRCI, guide à travers les méandres de l’administrativo-légal. Merci à ceux qui m’ont aidé à pallier les imprévus : Parmi eux Catherine, et Hervé, qui m’accompagna 4 fois par jour, harnaché de la tenue P3, pour me permettre l’accès à l’ultracentrifugeuse du laboratoire sécurisé d’infectiologie.
Merci également aux « témoins » de l’étude, dont l’anonymat m’empêche de citer les noms : Je sais qui vous êtes.
Merci à tous les médecins qui ont contribués à ma formation humaine et médicale. Anne Hélène, première d’une cordée aujourd’hui alpine, Nicole, Robert et les autres, Karine, femme de décisions et
de repas ponctuels, Yahsou, VDP et Delphine, rayons colorés comme un pantalon de Renaud, Renaud, justement, aux pantalons colorés comme ceux de Lionel, Lionel, ah, c’est déjà fait, Hannah, directrice première, Claire, qui élève ses internes comme du bon vin, et Bruno, coéquipier d’une association pas tirée par les cheveux.
Aux CCA qui m’apprirent plus que ce qu’ils ne le croient : Anna, et Seb, qui toutefois ne m’apprit pas à être raisonnable. A mon équipe actuelle et futur : Delphine, sœur dansante, Anne-sophie, qui gravit monts et palettes, Nicolas, rocker sensible sauf pour les épices, Clément, qui fait mieux de l’histologie que du vélo sans pédale et Henri, qui monte mieux son service que le Dimitile. Une pensée également à tous les médecins que j’ai croisé durant mes stages, depuis la réanimation jusqu’à la cardiologie, en passant par la médecine interne.
Merci à toutes les équipes secrétair(e)s, infirmièr(e)s, aides soignant(e)s, homme et femme de ménages, cadre de santé que j’ai rencontrées. J’ai beaucoup ri et appris, certains souvenirs resteront bien présents.
Merci à tous mes co-internes : Bertrand, dont le duo marqua la néphro péi jusqu’à mon deuxième passage 5ans plus tard, Cyril, dont je ne sais si la piscine installée sur la coursive ou notre prestation devant les caméras amusa plus la médecine interne ; Fred, diable caché ou Pierre, petit diable assumé ; Hugo, qui aime les premières fois, jusqu’à Claire, qui me fait dire qu’une belle relève est assurée. Merci à tous les autres, et particulièrement à la néphrologie bordelaisoréunionnaise, avec qui j’ai tant de souvenir de soirées, et un peu de néphrologie. Mention spéciale à Emma, Aurore, et à Max cou, frère ionique.
Merci à toute l’équipe du master 2 qui m’a accompagné durant cette (dense) année. Vos pipettes resteront toujours dans mes mains.
À tous mes amis, du quartier marseillais à l’île péi, du kipu et d’ailleurs. Je connais certains d’entre vous depuis mes 3 ans, d’autres depuis 3ans ; tous ont été témoins de beaucoup de choses, d’autres vont le devenir un peu plus. Beaucoup de vos noms me viennent en tête et autant d’anecdotes, mais pour développer, il me faudrait milles pages de plus…
À ma famille, nombreuse et unie, dont je suis si fier, A ma future belle famille, reine d’affection et des canards,
A mes parents, qui m’ont toujours soutenu et donné les moyens de réussir. C’est grâce à vos efforts et votre amour constant que j’ai pu autant m’épanouir dans mes projets. Je suis peut-être à 10000 kilomètres de distance, mais tous les jours avec vous. Merci à mon petit frère, aventurier du porto au grand cœur, finalement diplômé bien avant moi !
A Laura, joyau magique si doux à polir, A Martine, ma marraine.
TABLE DES MATIERES
REMERCIEMENTS ... 2
TABLE DES MATIERES ... 4
ABREVIATIONS ... 6
GENESE DU PROJET ... 7
WHAT ARE EXOSOMES? ... 8
ABSTRACT ... 9
INTRODUCTION ... 10
METHODS ... 11
Retrospective cohort of kidney transplants ... 11
Prospective cohort: M.A.N.G.U.E study ... 12
Patients, design and setting ... 12
Urinary Exosome Isolation ... 13
Immunoblotting... 13
Antibodies ... 15
Measurement of urinary creatinine ... 15
Statistical analysis ... 15
RESULTS... 17
Gordon-like syndrome features in a large retrospective cohort of kidney transplant patients ... 17
Characteristics of the patients: ... 17
Gordon-like syndrome is frequent in a retrospective cohort of kidney transplants: ... 19
Gordon-like syndrome phenotype is associated with medications but remains independent from most of classical high blood pressure or acidosis-causing factors... 20
Exosomes evaluation in kidney transplants: M.A.N.G.U.E cohort ... 22
Characteristics of the M.A.N.G.U.E cohort and Volunteers ... 22
Gordon-like phenotype in the M.A.N.G.U.E cohort ... 25
Gordon-like syndrome phenotype is associated with recipient’s age ... 26
CNI-treated kidney transplants don’t have increased NCC, pNCC or pendrin abundance in exosomes compared to CNI-free healthy volunteers. ... 28
Kidney transplants with Gordon-like syndrome phenotype don’t have an increase in NCC and pNCC abundance. Pendrin is appropriately downregulated in response to acidosis ... 31
DISCUSSION ... 36
REFERENCES ... 38
SUPPLEMENTAL MATERIALS ... 41
APPENDIX ... 49
CONCLUSIONS GENERALES ET PERSPECTIVES DU PROJET ... 51
ABREVIATIONS
CHU : Centre Hospitalier Universitaire BMI: Body Mass Index
CNI: Calcineurin inhibitor CsA: Cyclosporin A
CYROI : Cyclotron Réunion Océan Indien DBP: Diastolic Blood Pressure
DTT: Dithiothreitol
(e)GFR: (Estimated) Glomerular filtration rate kDa: kilodalton
KT: Kidney transplant patients L: Liter
M.A.N.G.U.E: Major Activation of NCC in Graft Urinary Exosomes min: Minutes
ml: Milliliter mmol: Millimole
NODAT: New Onset Diabetes After Transplantation OS: Optional Step
PPI: Proton Pump Inhibitor pNCC: phosphorylated NCC SBD: Systolic Blood Pressure
TMP-SMX:Trimethoprim/sulfamethoxazole THP: Tamm-Horsfall protein
TSG101: Tumor Susceptibility Gene 101 WB: western blot
WNK: With No Lysine Kinase
GENESE DU PROJET
L’histoire du projet débuta le mercredi 3 février 2016. Je présentais, lors de la séance hebdomadaire de bibliographie du CHU de Bordeaux, un article de Hoorn et al paru dans Nature en 20111. Cet article liait, chez la souris, prise d’anticalcineurines, augmentation d’expression des transporteurs rénaux NCC et pNCC, et hypertension artérielle. Ces données récapitulaient le phénotype clinique et la physiopathologie d’une maladie génétique appelée syndrome de Gordon. Dans cette dernière, l’activation de NCC entraine une hypertension artérielle, avec acidose métabolique et hyperkaliémie. Est-ce que ce « Gordon-like » existe également chez les patients greffés sous anticalcineurines ? Dans ce cas, devait-on privilégier chez les greffés hypertendus un traitement par diurétiques thiazidiques, inhibiteur de NCC, dont l’effet hypertensif pourrait être particulièrement efficace dans ce contexte ? Autant de questions qui ne trouvaient pas de réponse dans la littérature, et qui conduisirent le Pr Couzi à me dire à la fin de la présentation « eh bien, tu n’as qu’à en faire ta thèse ! ».
Je contactai le Pr Eladari, néphrologue à Paris et futur professeur réunionnais, qui se trouva idéalement intéressé par la problématique : Sa femme, le Dr Chambrey, et lui travaillaient sur le syndrome de Gordon. Courant 2016, nous posâmes les premiers jalons de ce qui constitua, plus tard, notre étude. A partir du flou d’un projet initial qui aurait testé les diurétiques thiazidiques chez les patients transplantés rénaux, nous avons progressivement préciser la nécessité de mieux identifier et caractériser ce syndrome « Gordon-like » sur lequel n’existaient, finalement, que peu de données. En décembre 2016, peu après mon retour à la Réunion, une orientation décisive fut prise lorsque le Dr Chambrey proposa d’utiliser les exosomes urinaires des patients afin de mesurer l’expression de NCC. Nous rajoutâmes à notre démarche l’évaluation de la pendrine, échangeur Cl-/HCO3- dont le rôle dans l’acidose métabolique du patient Gordon venait juste d’être démontré par leur équipe.
Nous validâmes le projet auprès du comité de protection des personnes et inclûmes des patients transplantés rénaux à trois mois de greffe à Bordeaux et à la Réunion. Les techniques d’isolation d’exosomes et de quantification furent réalisées lors de mon année recherche qui s’acheva fin octobre dernier.
WHAT ARE EXOSOMES?
Extracellular vesicles originating from cells have been identified around 30 years ago. Most classifications use the mode of biogenesis to distinguish extracellular vesicles into apoptotic cell-derived vesicles, microvesicles or exosomes. Exosomes are the smallest ones, with a size ranging from 30 to 150 nanometers2. They are generated by reverse budding of the limiting membrane of early endosomes, termed as multivesicular bodies, and secreted by fusion of the multivesicular bodies with the cell membrane3. Exosomes contain numerous factors issued from the parent cells, such as proteins, lipids, and even genetic materials (miRNA, mRNA or DNA)3. The membrane, composed of a bilayer of lipids, contain surface receptors that can mediate organ-specific release of this material4. Consequently, they may play a key role in cell to cell communication, either in healthy or disease state2. Several studies report exosomes influences on physiological processes, such as immune modulation, hemostasis, angiogenesis, matrix modulation or tissue regeneration, and diseases, from cancer to kidney diseases5.
As they can carry markers of the parent’s cells, urinary exosomes have been found very interesting to study diseases involving kidney transporters6. Indeed, collection of urine is non invasive and urinary exosomes can directly inform upon the state of expression of these transporters in the upward tubular cells7. For example, the abundance of the renal NaCl cotransporteur NCC has been found to be increased in urinary exosomes from Gordon syndrome patients8, from patients with primary aldosteronism9, and decreased in Gitelman patients10, who have genetic defect in NCC.
ABSTRACT
Calcineurin inhibitors (CNI) are immunosuppressive treatments widely used in transplantation. In mice, CNI activate the renal NaCl cotransporter (NCC), and thereby they cause high blood pressure, metabolic acidosis and hyperkalemia. This association of symptoms is also observed in patients suffering Gordon syndrome, a genetic disease also caused by inappropriate stimulation of NCC. Recently, it has been reported that acidosis of Gordon syndrome also involves stimulation of the Cl-/HCO3- exchanger pendrin. In humans, little is known about the
prevalence of Gordon-like syndrome phenotype in patients treated with CNI. Interestingly, NCC and pendrin expression can be assessed by immunoblots using urinary exosomes, small extracellular vesicles that reflect the composition of the plasma membrane of their parental cells. We designed two studies including incident CNI-treated kidney transplants 3 months after transplantation: a retrospective study was designed to determine the prevalence of Gordon-like phenotype, then a prospective one to evaluate NCC and pendrin expression in urinary exosomes. 172 patients were included in the retrospective study: 26% exhibited Gordon-like syndrome phenotype. Then, 58 patients were prospectively included and compared to 58 healthy volunteers. Again ~ 24% of kidney transplant recipients exhibited the Gordon-like phenotype. We show, however, that KT with Gordon-like phenotype do not exhibit a significant increase in NCC, pNCC or pendrin abundance. Furthermore, we show that CNI-treated KT have a marked down regulation of NCC, pNCC protein abundance in urinary exosomes compared to healthy volunteers.
Key words: Calcineurin inhibitors - Gordon like syndrome – Urinary exosomes – NCC – Pendrin
Les anticalcineurines sont les immunosuppresseurs les plus utilisés en transplantation rénale. Chez la souris, ils activent le co-transporteur rénal sodium chlore NCC, entrainant un phénotype associant hypertension, acidose métabolique et hyperkaliémie. Ce phénotype est également observé dans une maladie génétique appelée syndrome de Gordon, causée par une stimulation inappropriée de NCC. Récemment, il a été montré que l’acidose dans le Gordon impliquait une stimulation de l’échangeur Cl
-/HCO3- pendrine. Chez l’homme, il existe
peu de données sur la prévalence d’un phénotype Gordon-like syndrome chez les patients traités par anticalcineurines. De manière intéressante, l’expression de NCC et/ou de pendrine peut être appréhendée par immunoblot en utilisant les exosomes urinaires, qui sont des vésicules extracellulaires dont le contenu dépend de l’activité des cellules émettrices. Nous avons mené deux études qui ont inclus des patients greffés rénaux incidents trois mois après la greffe : Une étude rétrospective pour déterminer la prévalence du phénotype Gordon-like, puis une prospective pour évaluer l’expression de NCC et de pendrine dans les exosomes urinaires. 172 patients ont été inclus dans l’étude rétrospective, dont 26 % présentait le phénotype. Nous avons ensuite recruté 58 patients et 58 volontaires sains. A nouveau, 24 % des greffés présentait le phénotype Gordon-like. Nous montrons, cependant, que les greffés ayant ce phénotype ne présentent pas d’augmentation d’abondance de NCC, pNCC ou pendrine. De plus, nous montrons que les patients greffés sous anticalcineurines ont une abondance significativement moindre de NCC, pNCC dans les exosomes urinaires comparativement aux volontaires.
INTRODUCTION
Since the 80’s, calcineurin inhibitors (CNI) are the key drugs used in immunosuppressive protocol11. CNI include two molecules: Cyclosporin A (CsA), which binds to cytoplasmic cyclophilin, and tacrolimus, which binds to cytoplasmic FKBP12. After formation, the complex binds to calcineurin, a calcium- and calmoduline-dependent serine-threonine phosphatase. Calcineurin is implicated in the activation and nuclear migration of NFAT, a transcription factor involved in the transcription of genes regulating the immune response of T lymphocytes. The calcineurin-NFAT axis is, however, not specific of immune cells12 and FKBP12 is involved in various cellular processes13. Thus, the use of CNI is associated with numerous adverse events, including high blood pressure and metabolic acidosis14.
High blood pressure and metabolic acidosis are important complications for physicians, because both of them are associated with higher risk of allograft failure and reduced patient survival15, 16. New onset or aggravated high blood pressure after kidney transplantation is observed in more than 80% patients, with reduced incidence in patients with CNI-free regimen15,17. Metabolic acidosis has been less frequently reported in studies with ~ 58% of patients affected18. Numerous studies have been performed to elucidate the mechanisms of CNI toxicity in kidney transplant patients (KT). Recent findings from animal models showed that, CNI-induced high blood pressure involves activation of the thiazide-sensitive NaCl cotransporter NCC in the distal convoluted tubule1,19. Interestingly, CNI-treated mice also exhibited metabolic acidosis and trend to hyperkalemia, mimicking the phenotype of Gordon syndrome1. Gordon syndrome, also known as pseudohypoaldosteronism type II, or familial hyperkalemic high blood pressure, is characterized by the association of high blood pressure, metabolic acidosis, hyperkalemia and high sensitivity to thiazides diuretics20. It is a rare genetic disorder caused by mutations in genes coding for two serine threonine kinases from the With-No-lysine Kinase family (WNK) WNK1 and WNK4 or in genes modulating the degradation of WNKs. These mutations all lead to a gain of function of NCC by increasing its phosphorylation21. The latter favors renal NaCl retention and ultimately increases blood pressure. Interestingly, tacrolimus, in mice, alters the WNK pathway with enhanced expression of WNK41,22. Hence, the author concluded that CNI provoke an “acquired” Gordon syndrome1. Recently, using a mouse model of WNK4-dependent Gordon syndrome23, our group has demonstrated that while abnormal regulation of NCC causes high blood pressure of Gordon syndrome, metabolic acidosis is caused by abnormal upregulation of pendrin, a Cl-/HCO3- exchanger of the collecting duct involved in renal excretion of bicarbonate24. Whether pendrin is abnormally regulated and might cause metabolic acidosis in humans or mice treated with CNI is unknown.
It is not clear whether CNI in humans, like in mice, increase phosphorylation of NCC causing a “Gordon-like syndrome”. This is an important question because thiazides are not generally used in KT, while they are the most effective treatment of Gordon syndrome.
Our hypothesis was that NCC, pNCC and pendrin are abnormally regulated in KT treated with CNI, provoking thus high blood pressure, metabolic acidosis and hyperkalemia. To test our hypothesis, we first assessed in a retrospective cohort of CNI-treated KT 3 months after transplantation the prevalence of the typical features of Gordon-like syndrome. Then, we performed a prospective study evaluating NCC, pNCC and pendrin abundance in urinary exosomes isolated from the urine of KT treated with CNI three months after transplantation.
METHODS
Retrospective cohort of kidney transplants
We included all kidney transplants using CNI who underwent medical visit three months after transplantation from April 2017 to April 2018 in Bordeaux Transplant Center. Blood pressure was recorded once in routine clinical practice, blood and urines tests were performed in the morning. Patients with estimated Glomerular Filtration Rate (eGFR) < 15 ml/min/1.73m2 were not included. High blood pressure was defined as Systolic Blood Pressure (SBP) 140 mmHg and/or Diastolic Blood Pressure (DBP) 90 mmHg or need of antihypertensive medications. Metabolic acidosis (also called indifferently acidosis in this manuscript) was defined as a blood [HCO3-] < 22 millimole (mmol)/L and/or the need of an alkaline supplementation either as alkaline pills or prescription of alkaline water. Hyperkalemia was defined as plasma potassium > 4.5 mmol/L or by the need of a potassium chelating agent. “Gordon-like” syndrome phenotype was the association of high blood pressure along with metabolic acidosis and hyperkalemia. Uncontrolled high blood pressure was defined as SBP
140 mmHg and/or DBP 90 mmHg at inclusion despite antihypertensive medication. Cardiovascular disease included history of myocardial infarction, congestive heart failure, peripheral artery disease, abdominal aortic aneurysm or stroke. Body Mass Index (BMI) was expressed in kg/m². A diagnosis of diabetes after transplantation was defined as New Onset Diabetes After Transplantation (NODAT). Expanded criteria donor was defined as age ≥ 60 years, or age 50-59 years plus two of the following: cerebrovascular accident as the cause of death, preexisting high blood pressure, or terminal serum creatinine greater than 1.5 milligrams/deciliter. Delayed graft function was defined as the requirement of dialysis within the first week of transplantation. Proteinuria was defined as a proteinuria/creatininuria ratio > 50milligrams/mmol.
Prospective cohort: M.A.N.G.U.E study
Patients, design and setting
M.A.N.G.U.E study was a prospective multicentric observational study conducted in two sites: Bordeaux university hospital, France and Saint Denis university hospital, la Réunion, France. Enrollment occurred from April 14, 2018 through August 31, 2018.
All participants gave their informed consent and the study was approved by institutional review board (Comité de Protection des Personnes Ile de France X, clinical trial number
NCT03503461).
In our center, kidney transplants undergo three months after transplantation either a hospitalization for a protocol biopsy or a systematic routine day hospital evaluation. At that time, all patients who were using CNI were eligible for enrollment. We excluded patients who had been using thiazide diuretics or aldosterone antagonists after transplantation, which can interfere with NCC quantification, and patients with significant artery stenosis of the graft previously diagnosed at systematic doppler ultrasonography. Additional exclusion was done for patient with nephrostomy, or acute disease at the time of inclusion. Healthy volunteers with no treatment and no history of high blood pressure, kidney or metabolic disorders, were recruited as controls in Reunion island.
For kidney transplants, clinical evaluation, blood pressure record, according to European Society of Cardiology guidelines, blood and urine testing were performed in the morning. Routine blood and urine analysis were performed in each center, accordingly to the protocol of these centers. Samples of ∼50 ml of urine were also collected for exosomes study. For healthy volunteers, samples of ∼50 ml of urine were collected in the morning. Collection of urine in the morning could avoid bias from circadian rhythm25. Pierce protease inhibitors tablets were immediately added to the urine to prevent degradation of proteins in exosomes, and samples were stored at -80 °C until use. Urine collected in Bordeaux were transferred to la Reunion center for exosome analysis.
Urinary Exosome Isolation
Urinary exosome isolation was performed using variations of the technique of Pisitkun et al.26. Procedure of optimization of our exosome’s isolation protocol is shown in supplemental data section (see ancillary study).
Frozen urine samples were thawed and vigorously vortexed before transfer of 50-ml sample in Nalgene tubes for analyses. Another 1ml was aliquoted for creatinine measurement and frozen at −20°C until use. The 50-ml samples were subjected to 17 000 g (11 498 rpm) centrifugation (Eppendorf Centrifuge 5810R, Rotor F34-6-38) at 4°C for 12 min to eliminate whole cells and debris and supernatants were kept. Pellet was resuspended in isolation buffer (10 mM Triethanolamine, 250 mM Sucrose, distilled water) for 5mn. This resuspension was followed by a new 17 000 g (13 145 rpm) centrifugation (Eppendorf Centrifuge 5424R; rotor FA-45-24-11) for 4 min at 4°C. The supernatant was kept and pooled with the first one. We then performed two ultracentrifugation (Optima L-80XP; Beckman Coulter, Inc., 70 Ti rotor) in 25 ml high-speed tube (thick wall, polycarbonate tube #355618, Beckman) at 52 000 rpm (277 820 g) for 60 min at 4°C. Pellet were then resuspended in 100 µl of 1X Laemmli buffer during 30 min and frozen at −20°C until use.
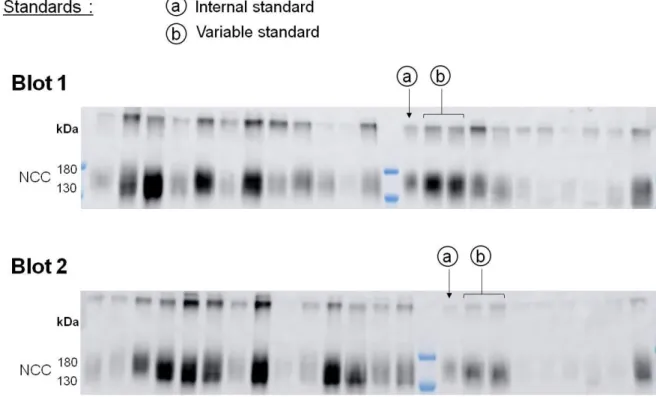
Immunoblotting
Loading of urinary exosomes sample of each subject on SDS-PAGE gel was normalized to urinary creatinine concentration. Validation of the normalization procedure is shown in supplemental data section (see ancillary study). Two Internal standards were loaded on each blot (Figure 1). SDS-PAGE was carried out with 7.5% polyacrylamide gels using Xcell SureLock electropheris apparatus for mini gels (Novex) under a constant voltage of 125 V for 2 hours or Criterion cell electrophoresis apparatus for midi gels (BioRad) under a constant current of 200 mA for 55 min. Proteins were then transferred to nitrocellulose membranes (Protran premium 0.45 µm, Amersham, USA) using XCell blot module for mini gels (Novex) under a constant voltage of 25 V for 1.5 hours at 4°C or Criterion blotter for midi gels (BioRad) under under a constant current of 100 mA for 45 min at 4°C. Midi gels Ponceau Red staining was performed to ensure good quality protein transfer. Membranes were blocked with 5% non-fat dry milk in PBS for 1 hour at room temperature and probed with antigen-specific primary antibodies diluted in PBS containing 1% non-fat dry milk overnight at 4°C. Blots were rinsed twice then washed 5 x 5 min with PBS containing 0.1% tween 20. Blots were incubated with species-specific secondary antibodies conjugated to horse-radish-peroxydase in PBS containing 5% non-fat dry milk for 2 hours at room temperature. Blots were rinsed twice then washed 5 x 5 min with PBS containing 0.1% tween 20. Signals were visualized using enhanced chemiluminescence (Supersignal West pico, Thermo Fischer
Scientific, Waltham, MA, USA) using the Imager 600 (GE Healthcare). Both the dimeric and monomeric forms of the NCC bands on the blots were quantified together (around 260 and 130 kDa) as well as pNCC (320 and 150 kDa). Pendrin was measured as the single dominant band at 130 kDa. The major bands of Tumor Susceptibility Gene 101 (TSG101) were measured at 45 kDa. Relative quantitation of the band densities from immunoblots was carried out with ImageQuant TL software (GE Healthcare) as previously described27.
Figure 1: Description of the internal standards used to take into account the variability of the western blot procedure from one membrane to another, and the wide range of urine dilution between samples of KT and volunteers.
a. 5µL of exosomes of the same control were loaded on each blot.
b. A variable volume of exosomes of the same control was loaded twice on each blot according to the lowest creatininuria of the blot.
Use of an internal standard
Signal intensity of the band recorded using enhanced chemiluminescence depends on the time of exposure, which is automatic and depends on the average signal intensity of the membrane. To adjust for this, we loaded on each blot 5 L of exosomes issued from one sample used as “internal standard”. For this sample, different band intensities were obtained from one membrane to another. The highest intensity recorded was defined as equivalent to 1, and a fold change of this band intensity on each blot was calculated. We then applied the fold change of the internal standard of each blot to the band intensities of the whole blot to all other samples. This adjustment corrects for the variability of the western blot and
chemoluminescence techniques and allow comparison of densitometric analyses of data from the different samples analyzed in different blots.
Second normalization with variable standard.
In order to ensure loading of similar amount of proteins the volume of each sample to load was determined according to the urinary concentration of creatinine assuming that the amount of creatinine excreted by 24h is constant. Since the value of urinary creatinine concentration was wide (from 16 to 230 mg.dl) reflecting very variable urine output. And since the volume that can be loaded by well is limited to a minimum of 2µl and a maximum of 15 µl, samples with similar range of creatininuria were runned on same blot. For each blot, the sample with the lowest creatininuria was assigned to a loading volume of 15 µL and the volume of the other samples was determined according to their urinary creatinine volume. To adjust between blots, each blot included internal standard run in duplicate. This standard had a creatininuria of 101 mg.dl and, depending of the creatininuria of the other samples, was loaded from 2.37 µl to 15 µl. For each band the mean of the two bands was calculated. The highest intensity recorded, which, expectedly was for the volume loading of 15 µl, was defined as equivalent to 1, and densitometric analyses of data were expressed as a fraction of this internal standard.
Antibodies
The following antibodies were used: rabbit anti-total human NCC (Millipore AB3553, 1: 2000); rabbit anti-phosphorylated NCC (pT53NCC) 1: 10000 (kindly provided by Dr J Loffing, University of Zurich, Switzerland), rabbit anti-mouse pendrin 1: 1000 (kindly provided by Dr P Aronson, Yale University, New Haven, USA), TSG101 (rabbit monoclonal anti human TSG 101 1: 1000 (Abcam Ab125011, USA). Secondary antibodies used were peroxidase-conjugated goat anti-rabbit 1: 5000.
Measurement of urinary creatinine
All urinary creatinine were measured in same laboratory in La Réunion using Jaffe’s method28.
Statistical analysis
Data were expressed as medians (first quartile, third quartile). Qualitative data were expressed as frequency and percentages. Bivariate comparisons of quantitative data were assessed using Mann–Whitney test. Bivariate comparisons of qualitative data were assessed using Fisher’s test. For multivariate analysis, we performed logistic regression with backward selection. All covariates with a p-value < 0.20 in the bivariate analysis were entered in the
model and removed if they did not reached the statistical significance. Densitometric analyses of data were normalized to the mean of controls that was defined as 100% and results were expressed as mean ± SD. Statistical significance was assessed by analysis of variance (ANOVA) after normalization using natural logarithm. All analyses were performed using Prism 5 software (GraphPad Software Inc, La Jolla, CA, USA) or SAS 9.4 software (SAS Cary Inc USA). A two-tailed alpha level of 5% was considered as significant.
RESULTS
Gordon-like syndrome features in a large retrospective cohort of kidney
transplant patients
To test whether CNI induce a Gordon-like syndrome, we first assessed in a retrospective cohort of KT the prevalence of the combined parameters high blood pressure/metabolic acidosis/hyperkalemia.
Characteristics of the patients:
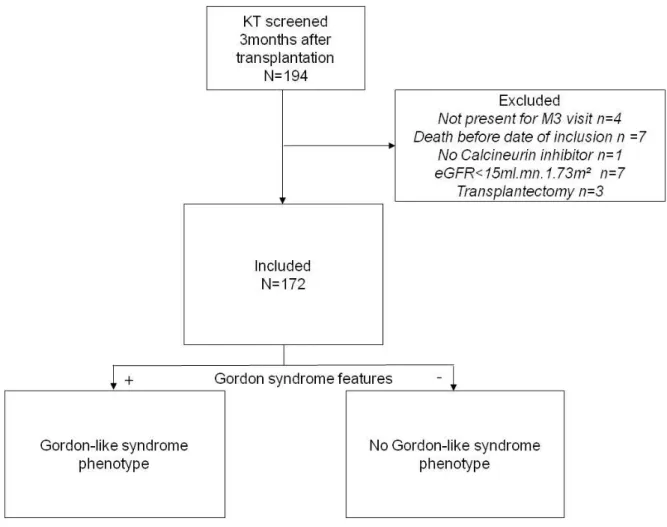
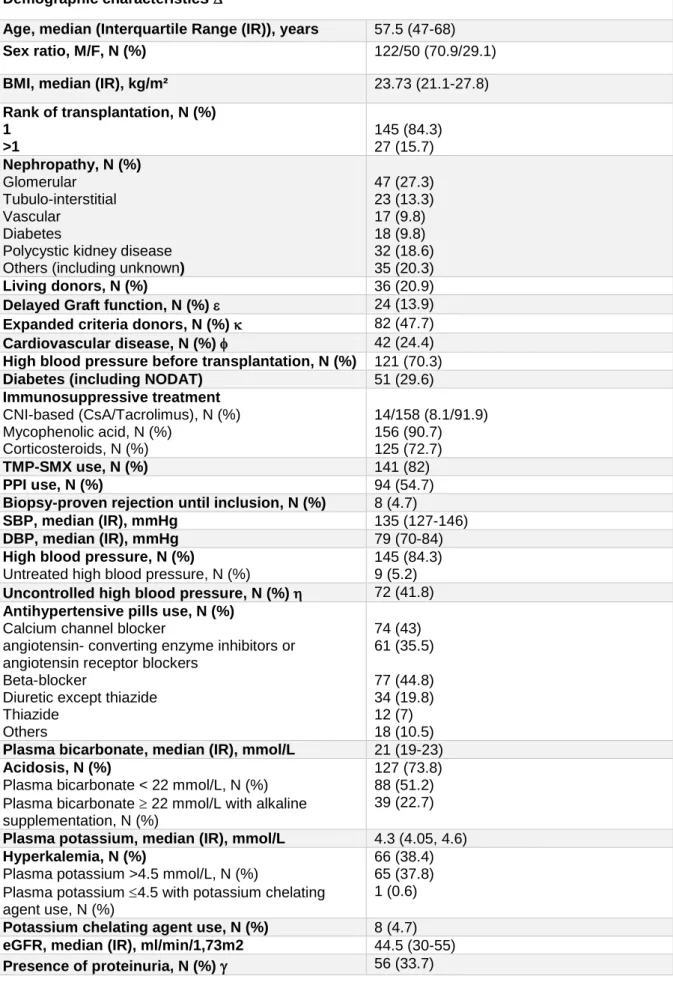
Between 04/04/2017 and 04/13/2018, we screened all KT using CNI who had an eGFR 15 ml/min/1.73 m2 and underwent medical visit three months after transplantation in Bordeaux. Among 194 KT, 172 were included (Figure 2). Characteristics are shown in Table 1. KT were mostly men (70.9%) with a median age of 57.5 (47-68) years, BMI was 23.7kg/m² (21.1-27.8). At inclusion, around 30% were diabetics. eGFR was 44.5 (30-55) ml/min/1.73 m². Most patients received a beta-blocker as antihypertensive treatment (44.8% of patients), only 7% received a thiazide diuretic.
Table 1: Clinical and laboratory characteristics of the retrospective cohort at inclusion (n=172) Demographic characteristics
Age, median (Interquartile Range (IR)), years 57.5 (47-68)
Sex ratio, M/F, N (%) 122/50 (70.9/29.1)
BMI, median (IR), kg/m² 23.73 (21.1-27.8)
Rank of transplantation, N (%) 1 >1 145 (84.3) 27 (15.7) Nephropathy, N (%) Glomerular Tubulo-interstitial Vascular Diabetes
Polycystic kidney disease Others (including unknown)
47 (27.3) 23 (13.3) 17 (9.8) 18 (9.8) 32 (18.6) 35 (20.3) Living donors, N (%) 36 (20.9)
Delayed Graft function, N (%) 24 (13.9)
Expanded criteria donors, N (%) 82 (47.7)
Cardiovascular disease, N (%) 42 (24.4)
High blood pressure before transplantation, N (%) 121 (70.3)
Diabetes (including NODAT) 51 (29.6)
Immunosuppressive treatment CNI-based (CsA/Tacrolimus), N (%) Mycophenolic acid, N (%) Corticosteroids, N (%) 14/158 (8.1/91.9) 156 (90.7) 125 (72.7) TMP-SMX use, N (%) 141 (82) PPI use, N (%) 94 (54.7)
Biopsy-proven rejection until inclusion, N (%) 8 (4.7)
SBP, median (IR), mmHg 135 (127-146)
DBP, median (IR), mmHg 79 (70-84)
High blood pressure, N (%)
Untreated high blood pressure, N (%)
145 (84.3) 9 (5.2) Uncontrolled high blood pressure, N (%) 72 (41.8) Antihypertensive pills use, N (%)
Calcium channel blocker
angiotensin- converting enzyme inhibitors or angiotensin receptor blockers
Beta-blocker
Diuretic except thiazide Thiazide Others 74 (43) 61 (35.5) 77 (44.8) 34 (19.8) 12 (7) 18 (10.5) Plasma bicarbonate, median (IR), mmol/L 21 (19-23) Acidosis, N (%)
Plasma bicarbonate < 22 mmol/L, N (%) Plasma bicarbonate 22 mmol/L with alkaline supplementation, N (%)
127 (73.8) 88 (51.2) 39 (22.7) Plasma potassium, median (IR), mmol/L 4.3 (4.05, 4.6) Hyperkalemia, N (%)
Plasma potassium >4.5 mmol/L, N (%)
Plasma potassium 4.5 with potassium chelating agent use, N (%)
66 (38.4) 65 (37.8) 1 (0.6) Potassium chelating agent use, N (%) 8 (4.7) eGFR, median (IR), ml/min/1,73m2 44.5 (30-55)
Data not shown include previous transplantation (except kidney), HLA immunization, Induction protocol, Diabetes before transplantation, number of antihypertensive pills before transplantation, total ischemia of the graft, hemoglobin, blood urea, creatinine, residual tacrolimus.
Interquartile range were expressed as median (1st and 3rd quartiles)
Delayed graft function was defined as the requirement of dialysis within the first week of transplantation.
Expanded criteria donor was defined as age > or = 60 years, or age 50-59 years plus two of the following: cerebrovascular accident as the cause of death, preexisting High blood pressure, or terminal serum creatinine greater than 1.5 milligrams/deciliter
Cardiovascular disease included history of myocardial infarction, congestive heart failure, peripheral artery disease, abdominal aortic aneurysm or stroke
SBP 140 mmHg and/or DBP 90 mmHg at inclusion
Proteinuria was defined as a proteinuria/creatininuria ratio > 50milligrams/mmol.
IR denotes Interquartile Range, BMI Body Mass Index, CNI CalciNeurin Inhibitors, CsA Cyclosporin A, TMP-SMX Trimethoprim/sulfamethoxazole, PPI Proton Pump Inhibitors, SBD Systolic Blood Pressure DBP Diastolic Blood Pressure and eGFR estimated Glomerular Filtration Rate.
Gordon-like syndrome is frequent in a retrospective cohort of kidney transplants: High blood pressure was observed in 84.3% of patients, with only 9 patients having untreated high blood pressure at inclusion. Acidosis was found in 73.9% of patients, with 51.2% of patients exhibiting biological acidosis and 22.7% with normal plasma bicarbonate values but receiving alkaline supplementation. 38.4% of patients had hyperkalemia, and only one patient had plasma potassium 4.5 mmol/L but with the use of a chelating agent.
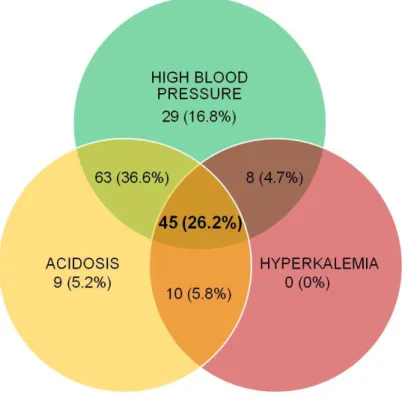
Among the 172 KT, 45 (26.2%) exhibited the full Gordon-like syndrome phenotype (high blood pressure, acidosis and hyperkalemia). The association of high blood pressure and acidosis without hyperkalemia was also found in 63 (36.6%) of patients. Interestingly, only 16.8%, 5.2% and 0% had high blood pressure, acidosis or hyperkalemia alone, respectively (Table 1 and Figure 3).
Figure 3: Distribution of high blood pressure, acidosis and hyperkalemia in the retrospective cohort of 172 kidney transplants 3 months after transplantation.
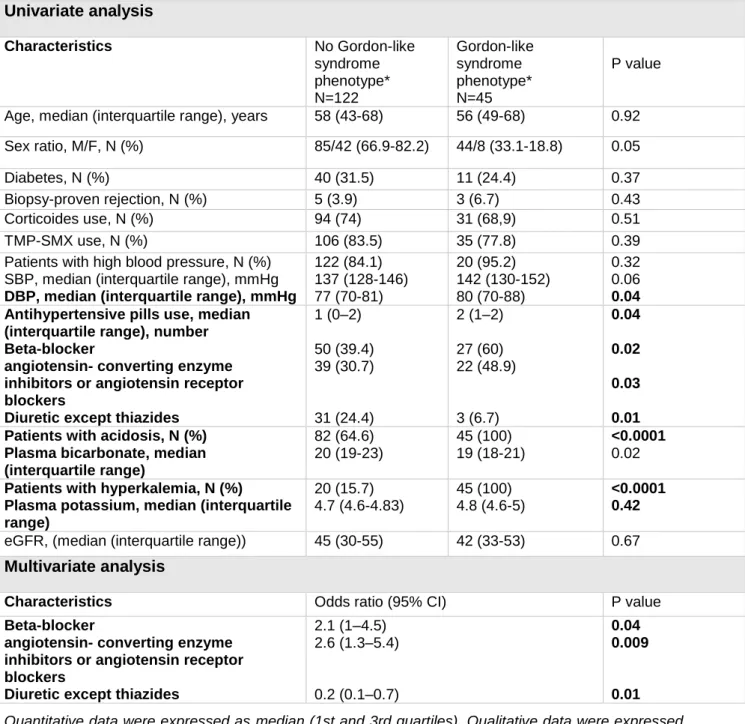
Gordon-like syndrome phenotype is associated with medications but remains independent from most of classical high blood pressure or acidosis-causing factors We separated the KT according to the presence or not of Gordon-like syndrome phenotype and analyzed the distribution of the previously described characteristics. Data are shown in Table 2. In unadjusted analyses, the demographic characteristics of the two groups were similar with no difference in age, sex ratio, BMI. Patients with Gordon-like syndrome phenotype had more severe high blood pressure or acidosis. Hypertensive patients with Gordon-like syndrome phenotype had higher DBP (p=0.04) than hypertensive patients without the phenotype. Patients with Gordon-like syndrome phenotype were taking higher number of antihypertensive medications (p=0.04). Patients with acidosis and Gordon-like syndrome phenotype had lower plasma bicarbonate than patients with acidosis and without the phenotype (p=0.02). Gordon-like syndrome phenotype was associated with the use of beta-blocker (p=0.02), angiotensin converting enzyme inhibitors, or angiotensin receptor blockers (p=0.03) and diuretic (except thiazides) (p=0.01). After multivariate analysis, use of beta-blockers (p=0.02), angiotensin converting enzyme inhibitors or angiotensin receptor blockers (p=0.03) and diuretic (except thiazides) (p=0.01) remained associated with Gordon-like syndrome phenotype. All others factors known to classically cause high blood pressure, acidosis or hyperkalemia, including type of nephropathy, diabetes, delayed graft function,
cardiovascular disease, rejection, corticoids use, low eGFR or use of TMP-SMX, were not associated with Gordon-like syndrome.
Table 2: Univariate and multivariate analysis of factors associated with Gordon-like syndrome phenotype in the retrospective study, using logistic regression with backward selection.
Univariate analysis Characteristics No Gordon-like syndrome phenotype* N=122 Gordon-like syndrome phenotype* N=45 P value
Age, median (interquartile range), years 58 (43-68) 56 (49-68) 0.92
Sex ratio, M/F, N (%) 85/42 (66.9-82.2) 44/8 (33.1-18.8) 0.05
Diabetes, N (%) 40 (31.5) 11 (24.4) 0.37
Biopsy-proven rejection, N (%) 5 (3.9) 3 (6.7) 0.43
Corticoides use, N (%) 94 (74) 31 (68,9) 0.51
TMP-SMX use, N (%) 106 (83.5) 35 (77.8) 0.39
Patients with high blood pressure, N (%) SBP, median (interquartile range), mmHg DBP, median (interquartile range), mmHg
122 (84.1) 137 (128-146) 77 (70-81) 20 (95.2) 142 (130-152) 80 (70-88) 0.32 0.06 0.04 Antihypertensive pills use, median
(interquartile range), number Beta-blocker
angiotensin- converting enzyme inhibitors or angiotensin receptor blockers
Diuretic except thiazides
1 (0–2) 50 (39.4) 39 (30.7) 31 (24.4) 2 (1–2) 27 (60) 22 (48.9) 3 (6.7) 0.04 0.02 0.03 0.01 Patients with acidosis, N (%)
Plasma bicarbonate, median (interquartile range) 82 (64.6) 20 (19-23) 45 (100) 19 (18-21) <0.0001 0.02 Patients with hyperkalemia, N (%)
Plasma potassium, median (interquartile range) 20 (15.7) 4.7 (4.6-4.83) 45 (100) 4.8 (4.6-5) <0.0001 0.42
eGFR, (median (interquartile range)) 45 (30-55) 42 (33-53) 0.67
Multivariate analysis
Characteristics Odds ratio (95% CI) P value
Beta-blocker
angiotensin- converting enzyme inhibitors or angiotensin receptor blockers
Diuretic except thiazides
2.1 (1–4.5) 2.6 (1.3–5.4) 0.2 (0.1–0.7) 0.04 0.009 0.01 Quantitative data were expressed as median (1st and 3rd quartiles). Qualitative data were expressed as frequency and percentages. Bivariate comparisons of quantitative data were assessed using Mann–Whitney test. Bivariate comparisons of qualitative data were assessed using Fisher’s test. Multivariate analyses were performed logistic regression with backward selection. All covariates with a p-value below 0.20 in the bivariate analysis were entered in the model and removed if they did not reached the statistical significance. P<0.05 was considered as significant.
*Gordon like syndrome phenotype: high blood pressure/acidosis/hyperkalemia
Exosomes evaluation in kidney transplants: M.A.N.G.U.E cohort
Characteristics of the M.A.N.G.U.E cohort and Volunteers
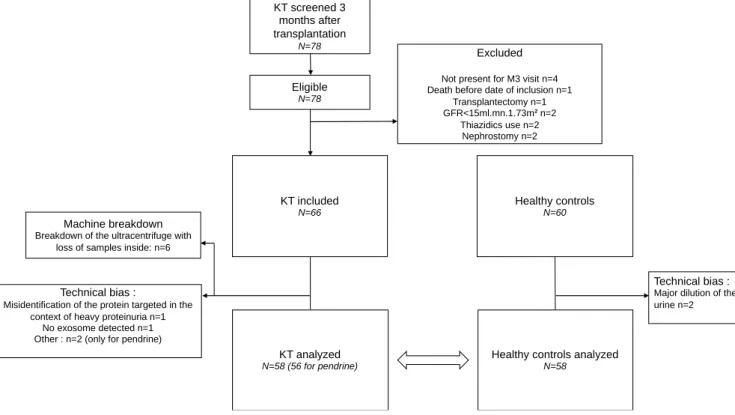
Between April and august 2018, 78 patients were screened and eligible three months after transplantation. 12 were excluded, and 60 patients were initially enrolled in the study. 6 samples were lost during the exosome isolation procedure, thus, 6 additional KT were included to reach the initial goal. Of 60 KT, 2 couldn’t be analyzed: one because of the presence of heavy proteinuria interfering with the immunoblot procedure, and one because no exosomes were detected. In 2 KT, pendrin was not detected. Of 60 healthy volunteers, 2 were not analyzed because they exhibited a polyuria (Figure 4).
Figure 4: Flow chart of the M.A.N.G.U.E study
The baseline characteristics of the participants are presented in Table 3. One potassium value was discarded because the blood sample was hemolyzed.
KT screened 3 months after transplantation N=78 Eligible N=78 KT included N=66 Healthy controls N=60 Excluded
Not present for M3 visit n=4 Death before date of inclusion n=1
Transplantectomy n=1 GFR<15ml.mn.1.73m² n=2
Thiazidics use n=2 Nephrostomy n=2
Technical bias :
Misidentification of the protein targeted in the context of heavy proteinuria n=1
No exosome detected n=1 Other : n=2 (only for pendrine)
KT analyzed N=58 (56 for pendrine)
Healthy controls analyzed N=58
Technical bias :
Major dilution of the urine n=2
Machine breakdown
Breakdown of the ultracentrifuge with loss of samples inside: n=6
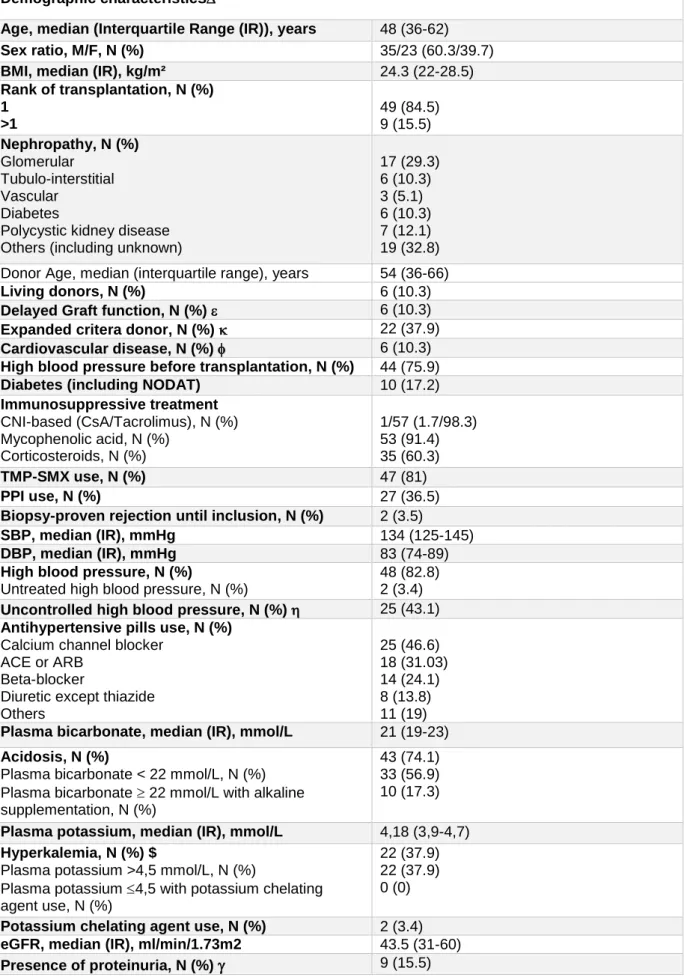
Table 3: Clinical and laboratory characteristics of the MANGUE cohort at inclusion (n=58)
Demographic characteristics
Age, median (Interquartile Range (IR)), years 48 (36-62)
Sex ratio, M/F, N (%) 35/23 (60.3/39.7)
BMI, median (IR), kg/m² 24.3 (22-28.5)
Rank of transplantation, N (%) 1 >1 49 (84.5) 9 (15.5) Nephropathy, N (%) Glomerular Tubulo-interstitial Vascular Diabetes
Polycystic kidney disease Others (including unknown)
17 (29.3) 6 (10.3) 3 (5.1) 6 (10.3) 7 (12.1) 19 (32.8) Donor Age, median (interquartile range), years 54 (36-66)
Living donors, N (%) 6 (10.3)
Delayed Graft function, N (%) 6 (10.3)
Expanded critera donor, N (%) 22 (37.9)
Cardiovascular disease, N (%) 6 (10.3)
High blood pressure before transplantation, N (%) 44 (75.9)
Diabetes (including NODAT) 10 (17.2)
Immunosuppressive treatment CNI-based (CsA/Tacrolimus), N (%) Mycophenolic acid, N (%) Corticosteroids, N (%) 1/57 (1.7/98.3) 53 (91.4) 35 (60.3) TMP-SMX use, N (%) 47 (81) PPI use, N (%) 27 (36.5)
Biopsy-proven rejection until inclusion, N (%) 2 (3.5)
SBP, median (IR), mmHg 134 (125-145)
DBP, median (IR), mmHg 83 (74-89)
High blood pressure, N (%)
Untreated high blood pressure, N (%)
48 (82.8) 2 (3.4) Uncontrolled high blood pressure, N (%) 25 (43.1) Antihypertensive pills use, N (%)
Calcium channel blocker ACE or ARB
Beta-blocker
Diuretic except thiazide Others 25 (46.6) 18 (31.03) 14 (24.1) 8 (13.8) 11 (19) Plasma bicarbonate, median (IR), mmol/L 21 (19-23) Acidosis, N (%)
Plasma bicarbonate < 22 mmol/L, N (%) Plasma bicarbonate 22 mmol/L with alkaline supplementation, N (%)
43 (74.1) 33 (56.9) 10 (17.3) Plasma potassium, median (IR), mmol/L 4,18 (3,9-4,7) Hyperkalemia, N (%) $
Plasma potassium >4,5 mmol/L, N (%)
Plasma potassium 4,5 with potassium chelating agent use, N (%)
22 (37.9) 22 (37.9) 0 (0) Potassium chelating agent use, N (%) 2 (3.4) eGFR, median (IR), ml/min/1.73m2 43.5 (31-60)
Data not shown include previous transplantation (except kidney), HLA immunization, Reactive panel antigen, Induction protocol, CMV status, Diabetes before transplantation, number of antihypertensive pills before transplantation, Donor sex, total ischemia of the graft, donor specific antibodies at inclusion, infection after transplantation and type of infection, tobacco use, white blood cells, neutrophils, lymphocytes, CD4 lymphocytes, CD8 lymphocytes, lymphocytes, hemoglobin, platelets counts, blood sodium, chloride, proteins, venous pH, blood urea, creatinine, uric acid, total calcium, ionized calcium, phosphorus, magnesium, parathormone, vitamin d, residual tacrolimus, urine electrolytes.
Quantitative data were expressed as median (1st and 3rd quartiles).
Delayed graft function was defined as the requirement of dialysis within the first week of transplantation.
Expanded criteria donor was defined as age > or = 60 years, or age 50-59 years plus two of the following: cerebrovascular accident as the cause of death, preexisting high blood pressure, or terminal serum creatinine greater than 1.5 milligrams/deciliter
Cardiovascular disease included history of myocardial infarction, congestive heart failure, peripheral artery disease, abdominal aortic aneurysm or stroke
SBP 140 mmHg and/or DBP 90 mmHg at inclusion
Proteinuria was defined as a proteinuria/creatininuria ratio > 50milligrams/mmol.
BMI denotes Body Mass Index, CNI CalciNeurin Inhibitors, PPI Proton Pump Inhibitors, CsA Cyclosporin A, TMP-SMX Trimethoprim/sulfamethoxazole, SBD Systolic Blood Pressure DBP Diastolic Blood Pressure, ACE or ARA2 angiotensin-converting enzyme inhibitors or angiotensin receptor blockers and eGFR estimated Glomerular Filtration Rate.
KT were mostly men (60.3%). Median age was 48 years (36-62). BMI was 24.3 kg/m² (22-28.5). 84.5% of patients were undergoing their first transplantation. Initial nephropathy was either not identified (32.8%), 30% was glomerular nephropathy and 10% had diabetic nephropathy. Around 10% of patients had living donors and 10% expanded criteria donors. Median age of donor was 54 (36-66). After transplantation, around 10% experimented delayed graft function. At inclusion, nearly 18% of patients were diabetics and 10% had a previous history of cardiovascular disease. More than 90% were taking Mycophenolic acid with CNI, and 60% corticosteroids. 81% were using Bactrim, and 36.5% Proton Pump Inhibitor (PPI). Antihypertensive medication included most frequently calcium channel blocker (46.6%). Patients had a eGFR of 43.4 ml/min/1.73m2 (31-60) and more than 15% had proteinuria. SBP and DBP were 134 mmHg (125-145) and 83 mmHg (74-89), respectively. Plasma bicarbonate concentration was 21 mmol/L (19-23) and potassium was 4.18 mmol/L (3.9-4.7).
Characteristics of the retrospective cohort and the M.A.N.G.U.E cohort were similar except for younger age (p=0.03), higher diastolic pressure (p=0.01), and less proteinuria (p=0.01) in the M.A.N.G.U.E cohort.
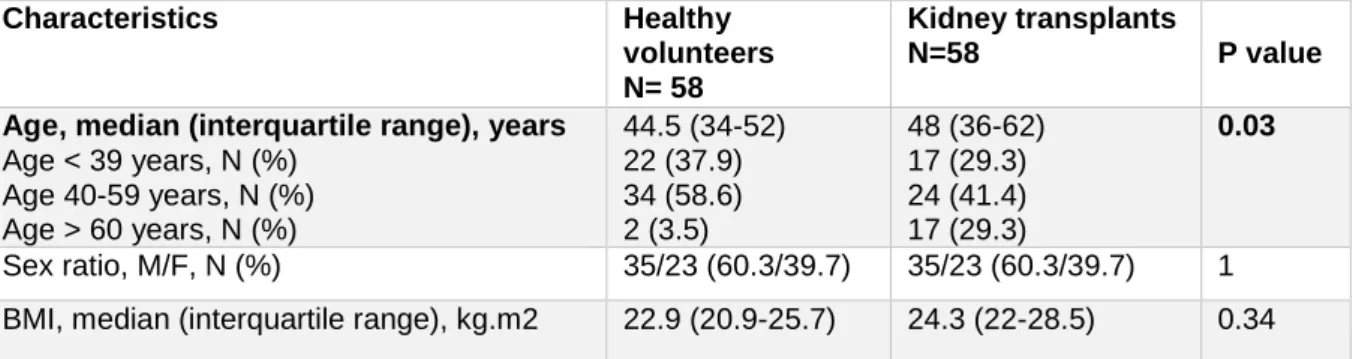
60 healthy volunteers from la Reunion were also included in our study. Both testified that they have no history of high blood pressure, kidney disease or metabolic disorders, and none were taking medications. Compared to M.A.N.G.U.E, median age was 3.5 years lower in volunteers (p=0.03) but there were no difference of sex and BMI (Table 4).
Table 4: Demographic characteristics of healthy volunteers and kidney transplants of M.A.N.G.U.E cohort Characteristics Healthy volunteers N= 58 Kidney transplants N=58 P value
Age, median (interquartile range), years Age < 39 years, N (%) Age 40-59 years, N (%) Age > 60 years, N (%) 44.5 (34-52) 22 (37.9) 34 (58.6) 2 (3.5) 48 (36-62) 17 (29.3) 24 (41.4) 17 (29.3) 0.03 Sex ratio, M/F, N (%) 35/23 (60.3/39.7) 35/23 (60.3/39.7) 1
BMI, median (interquartile range), kg.m2 22.9 (20.9-25.7) 24.3 (22-28.5) 0.34 BMI: Body Mass Index
Gordon-like phenotype in the M.A.N.G.U.E cohort
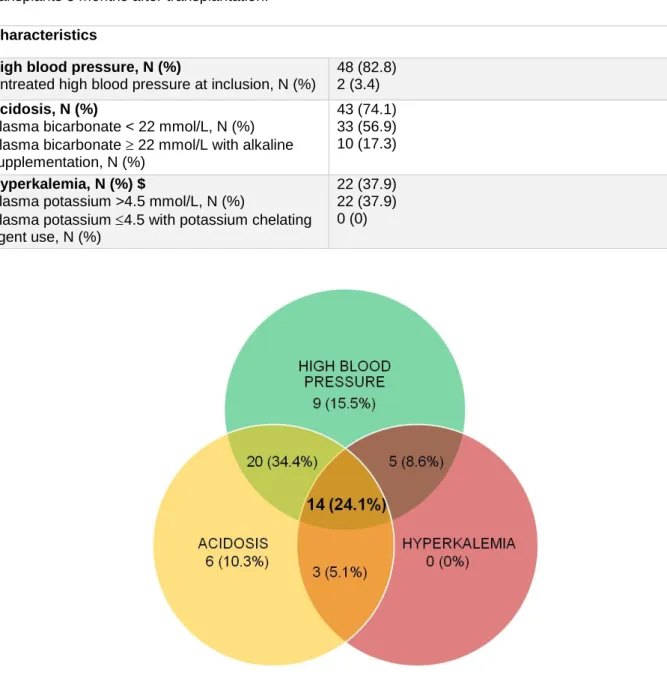
High blood pressure was recorded in 82.2% of patients, with only 2 patients having untreated high blood pressure at inclusion. Acidosis was found in 74.1% of patients, with 56.9 who had biological acidosis and 17.3% plasma bicarbonate>22mmol/L with alkaline supplementation. 37.9% of patients had hyperkalemia, both of them with plasma potassium>4.5 mmol/L. Among the 58 KT, 14 (24.1%) exhibited the Gordon-like syndrome phenotype (high blood pressure, acidosis and hyperkalemia). The association of high blood pressure and acidosis without hyperkalemia were also found in 20 (34.4%) of patients. Only 15.5%, 10.3% et 0% had high blood pressure, acidosis or hyperkalemia alone. Gordon-like features are summarized in Table 5 and Figure 5.
Table 5: Prevalence of Gordon-like syndrome features in the prospective cohort of 58 kidney transplants 3 months after transplantation.
Figure 5: Distribution of high blood pressure, acidosis and hyperkalemia in the prospective cohort of 58 kidney transplants 3 months after transplantation. Data are shown as N (%).
Of note, prevalence of high blood pressure, acidosis and hyperkalemia of the M.A.N.G.U.E cohort was similar to the retrospective cohort (p=0.78, p=0.96 and p=0.91, respectively).
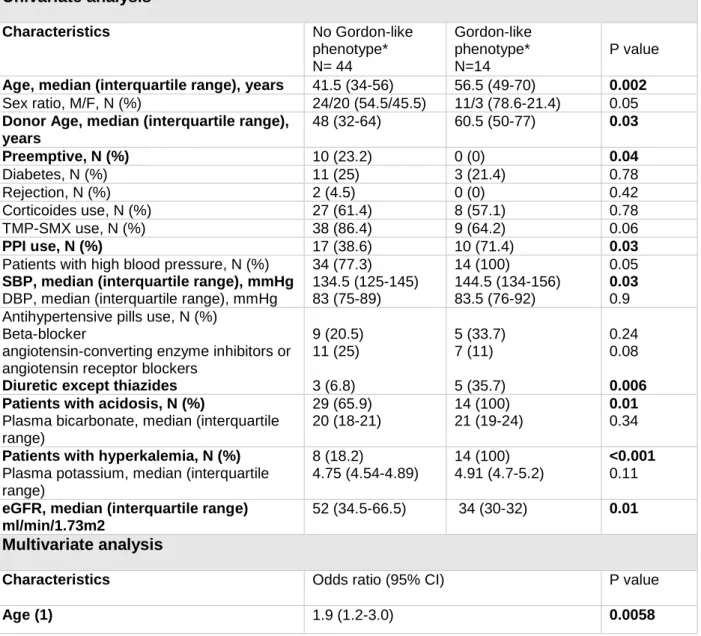
Gordon-like syndrome phenotype is associated with recipient’s age
We separated the KT according to the presence of Gordon-like syndrome phenotype and analyzed the distribution of the previously described characteristics (Table 6). In unadjusted analysis, patients with Gordon-like syndrome phenotype were significantly older (p=0.002). Donor age was significantly older (p=0.03) and they had less preemptive transplantation (p=0.04). Hypertensive patients with Gordon-like syndrome phenotype had higher SBP than Characteristics
High blood pressure, N (%)
Untreated high blood pressure at inclusion, N (%)
48 (82.8) 2 (3.4) Acidosis, N (%)
Plasma bicarbonate < 22 mmol/L, N (%) Plasma bicarbonate 22 mmol/L with alkaline supplementation, N (%)
43 (74.1) 33 (56.9) 10 (17.3) Hyperkalemia, N (%) $
Plasma potassium >4.5 mmol/L, N (%)
Plasma potassium 4.5 with potassium chelating agent use, N (%)
22 (37.9) 22 (37.9) 0 (0)
those without Gordon-like syndrome phenotype (p=0.03). They were using more PPI (p=0.01), diuretic (0.006), eGFR was also significantly lower (p=0.01). In multivariate analysis adjusted with all these variables, only age was still associated with Gordon like syndrome phenotype (OR = 1.9 (IC95%: 1.2-3.0) p=0.0058).
Table 6: Univariate and multivariate analysis of factors associated with Gordon-like syndrome phenotype in the M.A.N.G.U.E study, using logistic regression with backward selection.
Univariate analysis Characteristics No Gordon-like phenotype* N= 44 Gordon-like phenotype* N=14 P value Age, median (interquartile range), years 41.5 (34-56) 56.5 (49-70) 0.002
Sex ratio, M/F, N (%) 24/20 (54.5/45.5) 11/3 (78.6-21.4) 0.05
Donor Age, median (interquartile range), years 48 (32-64) 60.5 (50-77) 0.03 Preemptive, N (%) 10 (23.2) 0 (0) 0.04 Diabetes, N (%) 11 (25) 3 (21.4) 0.78 Rejection, N (%) 2 (4.5) 0 (0) 0.42 Corticoides use, N (%) 27 (61.4) 8 (57.1) 0.78 TMP-SMX use, N (%) 38 (86.4) 9 (64.2) 0.06 PPI use, N (%) 17 (38.6) 10 (71.4) 0.03
Patients with high blood pressure, N (%) SBP, median (interquartile range), mmHg DBP, median (interquartile range), mmHg
34 (77.3) 134.5 (125-145) 83 (75-89) 14 (100) 144.5 (134-156) 83.5 (76-92) 0.05 0.03 0.9 Antihypertensive pills use, N (%)
Beta-blocker
angiotensin-converting enzyme inhibitors or angiotensin receptor blockers
Diuretic except thiazides
9 (20.5) 11 (25) 3 (6.8) 5 (33.7) 7 (11) 5 (35.7) 0.24 0.08 0.006 Patients with acidosis, N (%)
Plasma bicarbonate, median (interquartile range) 29 (65.9) 20 (18-21) 14 (100) 21 (19-24) 0.01 0.34 Patients with hyperkalemia, N (%)
Plasma potassium, median (interquartile range) 8 (18.2) 4.75 (4.54-4.89) 14 (100) 4.91 (4.7-5.2) <0.001 0.11 eGFR, median (interquartile range)
ml/min/1.73m2
52 (34.5-66.5) 34 (30-32) 0.01
Multivariate analysis
Characteristics Odds ratio (95% CI) P value
Age (1) 1.9 (1.2-3.0) 0.0058
Quantitative data were expressed as median (1st and 3rd quartiles). Qualitative data were expressed as frequency and percentages. Bivariate comparisons of quantitative data were assessed using Mann–Whitney test. Bivariate comparisons of qualitative data were assessed using Fisher’s test. Multivariate analysis was performed logistic regression with backward selection. All covariates with a p-value below 0.20 in the bivariate analysis were entered in the model and removed if they did not reached the statistical significance. P<0.05 was considered as significant.
*Gordon-like syndrome phenotype: high blood pressure/acidosis/hyperkalemia (1) Each ten-year increase
TMP-SMX denotes Trimethoprim/sulfamethoxazole, PPI Proton Pump Inhibitors, SBD Systolic Blood Pressure DBP Diastolic Blood Pressure and eGFR estimated Glomerular Filtration Rate
CNI-treated kidney transplants don’t have increased NCC, pNCC or pendrin abundance in exosomes compared to CNI-free healthy volunteers.
NCC, pNCC, pendrin and TSG101 abundance were quantified in KT and volunteers by immunoblot analyses. As shown in Figure 6, NCC and pNCC abundance in urinary exosomes from CNI-treated KT were significantly lower when compared to exosomes isolated from healthy volunteers (p<0.05). Pendrin abundance was not different between KT and healthy volunteers (p=0.05). Surprisingly, TSG101 abundance was lower in KT patients when compared to healthy volunteers suggesting that KT excrete less exosomes. Thus, we tested again the effects of CNI on the different transporters after normalization for TSG101 to take into account the decrease in exosome excretion. These additional experiments yielded exactly same results (i.e., NCC and pNCC were decrease in CNI treated KT vs controls and pendrin was unchanged) (not shown).
Also, we found no differences in NCC, pNCC, pendrin and TSG101 abundance between KT from Bordeaux and la Reunion (not shown).
Figure 6: Densitometric analysis of the western blot of N-terminal sodium-chloride cotransporter (NCC), phosphorylated NCC (pNCC), pendrin and Tumor Susceptibility Gene 101 protein (TSG101) in urinary exosomes of healthy subjects and kidney transplants.
NCC (A) and pNCC (B) abundance were significantly lower in urinary exosomes of kidney transplants compared to healthy volunteers. There was no difference in pendrin abundance (C) in urinary exosomes of kidney transplants and healthy volunteers. TSG101 (D) was also slightly significantly reduced in urinary exosomes of kidney transplants but additional normalization of NCC, pNCC and pendrin with TSG101 didn’t modified our results. Values are mean ± SD normalized to healthy subjects. Blots shown above are representative of individual experiments. n=58 in each group except for pendrin in kidney transplants (n=56). Statistical significance was assessed by analysis of variance (ANOVA) after normalization using natural logarithm *P < 0.05 for NCC and pNCC, 0.05 for pendrine and ***p=0.0007 for TSG101.
Kidney transplants with Gordon-like syndrome phenotype don’t have an increase in NCC and pNCC abundance. Pendrin is appropriately downregulated in response to acidosis
When abundance of the renal transporters in urinary exosomes from KT harboring a complete Gordon-like syndrome was compared to the one from KT without Gordon-like phenotype we found no significant difference (p=0.78 for NCC, 0.85 for pNCC, 0.97 for pendrin, respectively) (Figure 7). No difference in TSG101 abundance between groups was detected, thus, normalization with TSG101 was not necessary (p=0.45).
Figure 7: Densitometric analysis of the western blot of N-terminal sodium-chloride cotransporter (NCC), phosphorylated NCC (pNCC), pendrin in urinary exosomes of kidney transplants according to the presence of Gordon-like syndrome phenotype.
Abundance of NCC (A), pNCC (B) and pendrin (C) was not different between patients with or without Gordon-like syndrome phenotype (p=0.78 for NCC, 0.85 for pNCC, 0.97 for pendrin). Values are mean ± SD normalized to subjects without Gordon-like phenotype. Gordon-like phenotype was defined as the simultaneous presence of high blood pressure, acidosis and hyperkalemia. Subjects without Gordon-like phenotype n=44 and subjects with Gordon-like phenotype n=14. Statistical significance was assessed by analysis of variance (ANOVA) after normalization using natural logarithm
We next compared NCC, pNCC and pendrin abundances in urinary exosomes from patients exhibiting either high blood pressure, or acidosis, or hyperkalemia. There was no difference in TSG101 abundance between KT hypertensive or not, with or without acidosis and with or without hyperkalemia, so normalization with TSG101 wasn’t necessary
As shown in Figure 8, NCC and pNCC abundances were not significantly altered in patients with acidosis (p=0.16 and 0.08). As expected, pendrin abundance was significantly lower in patients with acidosis (p=0.006) indicating that patients treated with CNI keep a normal regulation of pendrin.
Figure 8: Densitometric analysis of the western blot of N-terminal sodium-chloride cotransporter (NCC), phosphorylated NCC (pNCC), pendrin in urinary exosomes of kidney transplants according to the presence of acidosis.
Pendrin abundance (C) was significantly lower in KT with acidosis, whereas there was no difference in NCC (A) and pNCC (B) abundance. Values are mean ± SD normalized to subjects without acidosis. n=15 in subjects without acidosis and 43 in subjects with acidosis except for pendrin (n=14 in subjects without acidosis and 42 in subjects with acidosis). Statistical significance was assessed by analysis of variance (ANOVA) after normalization using natural logarithm. P=0.16 for NCC, 0.08 for pNCC, **p=0.006).
As shown in Figure 9, there was no difference in NCC, pNCC and pendrin abundance between normotensive and hypertensive KT (p=0.29; 0.74; and 0.38, respectively).
When comparing KT according to the presence of hyperkalemia, NCC, pNCC and pendrin abundance were unchanged in hyperkalemic patients (p=0.74, 0.83 and 0.52, respectively).
Figure 9: Densitometric analysis of the western blot of N-terminal sodium-chloride cotransporter (NCC), phosphorylated NCC (pNCC), pendrin in urinary exosomes of kidney transplants according to the presence of high blood pressure and hyperkalemia.
There was no difference of NCC, pNCC and pendrin abundance in hypertensive patients compared to normotensive (A, B and C), as well in hyperkalemic patients compared to normokalemic (D, E and F). Values are mean ± SD normalized to normotensive or normokalemic subjects. A and B: n=10 in normotensive and 48 in hypertensive subjects. p=0.29 and 0.74. C: n=10 in normotensive and 46 in hypertensive subjects. p=0.38. D and E: n=35 in normokalemic subjects and 22 in subjects with hyperkalemia. p=0.74 and 0.83. F: n=33 in normokalemic subjects and 22 in subjects with hyperkalemia. p=0.52. Statistical significance was assessed by analysis of variance (ANOVA) after normalization using natural logarithm.
DISCUSSION
A study performed in mice has proposed that CNI can activate NCC to cause high blood pressure, hyperkalemia and acidosis, mimicking a genetic disease called Gordon syndrome1. Mutations causing Gordon syndrome lead to NCC activation, but, as recently shown, also implicate inappropriate pendrin activation23. Despite the wide use of CNI, particularly in transplantation, the possibility that CNI can induce Gordon-like syndrome in humans is not clear. We speculated that CNI-induced Gordon-like phenotype in human is frequent and might account for the high prevalence of high blood pressure and metabolic acidosis observed in transplant recipients. Here, we confirm that the combination of high blood pressure, acidosis and hyperkalemia, features of Gordon syndrome affect up to 24% of patients 3 months after renal transplantation. We show, however, that KT with Gordon-like phenotype do not exhibit significant increase in NCC, pNCC or pendrin abundance but rather
exhibit a marked downregulation of NCC and pNCC protein abundance in urinary exosomes when compared to healthy volunteers.
Few studies have tried to determine if CNI in humans can induce a Gordon-like syndrome. Here, we report the prevalence of the combination of high blood pressure, metabolic acidosis, and hyperkalemia in a cohort of KT. As already reported previously15, prevalence of high blood pressure was high. The prevalence of acidosis was high in our study, while others have reported a prevalence of low plasma bicarbonate concentration from 11 to 58%29. Hyperkalemia was less common than high blood pressure and acidosis, but data in the literature are too scarce to compare this rate30. The high prevalence of Gordon-like phenotype in renal transplant recipients treated by CNI prompted us to test the possible effects of CNI on NCC and pendrin, the two renal transporters which are central to the pathophysiology of Gordon syndrome.
We therefore included 60 prospective KT 3 months after transplantation and 60 healthy volunteers to evaluate NCC, pNCC and pendrin expression in urinary exosomes. Surprisingly we found that CNI-treated KT have a marked a down regulation of NCC pNCC protein abundance in urinary exosomes. These results contrast with one of the two studies that used urinary exosomes to compare CNI-treated to CNI-free KT or healthy volunteers. If one study found, like us, no difference in NCC abundance between CNI-treated KT and CNI-free31, one other study reported that CNI-treated KT exhibit an up regulation of NCC when compared to CNI-free KT and healthy volunteers27. The latter compared 9 KT treated with ciclosporin and 23 KT treated with tacrolimus to 13 CNI-free KT and 6 male volunteers (supplemental table 1). Our two cohorts were quite similar in term of age, BMI, SBP, DBP, or eGFR. However, we noticed that NCC and pNCC abundance exhibit a great variability within exosomes samples