The electronic states of 2-furanmethanol
„
furfuryl alcohol
…
studied
by photon absorption and electron impact spectroscopies
A. Giuliani
Laboratoire de Spectroscopie d’E´ lectrons Diffuse´s, Universite´ de Lie`ge, Institut de Chimie Baˆt. B6c, B-4000 Lie`ge, Belgium
I. C. Walker
School of Engineering and Physical Sciences, Heriot-Watt University, Riccarton, Edinburgh EH14 4AS, United Kingdom
J. Delwiche
Thermodynamique et Spectroscopie, Universite´ de Lie`ge, Institut de Chimie Baˆt. B6c, B-4000 Lie`ge, Belgium
S. V. Hoffmann
Institute for Storage Ring Facilities, University of A˚ rhus, Ny Munkegade, DK-8000 A˚rhus C, Denmark P. Lima˜o-Vieiraa)and N. J. Masonb)
Department of Physics and Astronomy, University College London, Gower Street, London WC1 E6BT, United Kingdom
B. Heyne and M. Hoebeke
Laboratoire de Spectroscopie Biome´dicale, Institut de Physique Baˆt. B5, Universite´ de Lie`ge, B-4000 Lie`ge, Belgium
M.-J. Hubin-Franskinc)
Laboratoire de Spectroscopie d’E´ lectrons Diffuse´s, Universite´ de Lie`ge, Institut de Chimie Baˆt. B6c, B-4000 Lie`ge, Belgium
共Received 28 April 2003; accepted 2 July 2003兲
The photoelectron spectrum of 2-furanmethanol共furfuryl alcohol兲 has been measured for ionization energies between 8 and 11.2 eV and the first three ionization bands assigned to 3, 2, and no ionizations in order of increasing binding energy. The photoabsorption spectrum has been recorded in the gas phase using both a synchrotron radiation source共5–9.91 eV, 248–125 nm兲 and electron energy-loss spectroscopy under electric-dipole conditions 共5–10.9 eV, 248–90 nm兲. The 共UV兲 absorption spectrum has also been recorded in solution共4.2–6.36 eV, 292–195 nm兲. The electronic excitation spectrum appears to be dominated by transitions between and * orbitals in the aromatic ring, leading to the conclusion that the frontier molecular orbitals of furan are affected only slightly on replacement of a H atom by the – CH2OH group. Additional experiments investigating electron impact at near-threshold energies have revealed two low-lying triplet states and at least one electron/molecule shape resonance. Dissociative electron attachment also shows to be widespread in furfuryl alcohol. © 2003 American Institute of Physics. 关DOI: 10.1063/1.1603733兴
I. INTRODUCTION
The furan molecule plays a central role in many fields of chemistry. Like pyrrole and thiophene it is pseudo-aromatic, but it retains properties related to those of the conjugated dienes and this contributes to its versatility in organic synthesis.1 Compounds incorporating the furan ring are of major importance in pharmaceutical, polymer, and materials science.2 Recently, furan compounds have also been impli-cated in environmental and atmospheric chemistry.3,4 Given
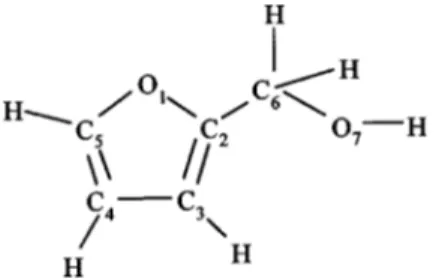
this, it is of interest to explore how the electronic structure of furan is affected on substitution of the ring hydrogen atoms by functional groups. We have already reported on the valence-shell electronic spectroscopy of 2-methylfuran.5We now present a comprehensive spectroscopic study on 2-furanmethanol 共commonly known as furfuryl alcohol兲 the derivative obtained by substitution of an H atom of furan by a CH2OH group共Fig. 1兲.
As well as being of interest because of its relationship to furan, furfuryl alcohol is important in its own right as a syn-thetic reagent. Currently, it is widely employed in the pro-duction of different kinds of resins and polymers used in coating technology;6in fact, potential technological applica-tions make it one of the most important furanic derivatives on the market.7,8
The geometric structure of furfuryl alcohol共Fig. 1兲 has been established from microwave spectroscopy and ab initio
a兲Also at Departamento de Fı´sica, FCT-UNL, Quinta de Torre, P-2829-516
Caparica & Centro de Fı´sica Molecular, Complexo I, IST, Av. Rovisco Pais, P-1049-001 Lisboa, Portugal.
b兲Now at Center for Molecular and Optical Sciences, Department of Physics
and Astronomy, The Open University, Walton Hall, Milton Keynes MK7 6AA, UK.
c兲Directeur de recherche F.N.R.S., author to whom correspondence should
be addressed. Electronic mail: mjfranskin@ulg.ac.be
7282
calculations.9The molecule adopts a skew conformation for C3vC2– C6– O7 in its two most stable rotamers with dihe-dral angles of 105° and 108°, respectively. It belongs to the C1 point group, containing only the identity symmetry ele-ment. However, in interpreting its spectroscopy, we empha-size its relationship to furan and so give the observed spec-tral bands labels from the C2vpoint group, appropriate to the corresponding bands in furan. Although not rigorously cor-rect this approach works because the dominant absorption bands in the spectrum appear to result from transitions be-tween perturbed -orbitals of the parent molecule. This methodology has been previously used successfully in the case of 2-methylfuran, whose spectrum is remarkably similar to that of furan.5 Also, it is a method generally applied to substituted aromatics compounds.10
Little work has been reported on the electronic pro-perties of furfuryl alcohol. This constrasts with furan, whose electronic states have been extensively studied, both by experiment and theory.11–13 In furan the ground-state electronic configuration (1A1 in C2v symmetry兲 is (core) ⫻(2b1)2(1a2)2 where orbitals 2b1and 1a2are2and3, respectively. The lowest unoccupied orbitals are 4*(3b1) and5*(2a2). Excited states arising from→*transitions within this group of orbitals give four singlet * excited states, namely two of symmetry B2 (34* and 25* la-beled 1B2 and 2B2) and another pair of symmetry A1 (35* and 24*).
11 The first optical band of furan spans 5.5–7.2 eV 共225–172 nm兲 with a maximum absorption at 6.04 eV 共205 nm兲. There is agreement that most of the in-tensity is from excitation of1B2. The lower-lying of the two 1A
1 states may also lie within this band, but its oscillator strength is low and it has not yet been established by experi-ment whether it lies below or above the1B2 state. Theoreti-cal Theoreti-calculations give conflicting results.11–13The second pair of A1and B2(1*) states are within an intense absorption band between about 7 and 9 eV. Excitation energies of 7.8 eV 共159 nm兲 and 8.7 eV 共143 nm兲 have been proposed for 2A
1 and2B2, respectively. Sharp Rydberg excitations sit on the two broad valence bands.11
In the present studies, we have recorded the electronic 关vacuum ultraviolet 共VUV兲兴 excitation spectrum of gaseous furfuryl alcohol using a synchrotron radiation source. A high resolution electron energy-loss spectrum 共HREELS兲 has been obtained under conditions which mimic the optical spectrum, and which extend the spectral range of the mea-surements. Electron energy-loss spectra have also been stud-ied using incident electrons of near-threshold energies. The lowest ionization energies have been measured by
high-resolution photoelectron spectroscopy. Finally, we have de-termined the UV spectrum of the compound in a solution of cyclohexane.
II. EXPERIMENT
A. Photoelectron spectrometer
The photoelectron spectrometer has been described in detail.14,15Briefly, HeIphotons共58.4 nm兲 are produced by a dc discharge in helium. The spectra were recorded by sweep-ing a retardsweep-ing voltage in steps of 1 meV between the ion-ization chamber and the entrance slit of a 180° hemispherical selector electrostatic analyzer, working in constant pass en-ergy mode. Spectra were corrected for the transmission of the analyzing system. The overall resolution was about 25 meV. The ionization energy scale was calibrated using the xenon peaks (2P3/2:12.123 eV and 2P1/2:13.436 eV兲.16 The accuracy of the energy measurements is estimated to be ⫾0.002 eV.
B. Gas-phase VUV absorption apparatus
The photoabsorption spectrum was recorded at the UV1 beam line17of the storage ring ASTRID at Århus University, in Denmark. The normal incidence monochromator was op-erated using the 2000 l/mm grating with an overall resolution 共full width at half maximum, FWHM兲 of better than 0.1 nm. The radiation from the monochromator passed through a CaF2 window into a gas cell of length 15 cm. A Baratron capacitance manometer monitored the sample pressure共less than 0.1 mbar兲, and the intensity of the radiation exiting the cell through a second CaF2 window was detected using an UV enhanced photomultiplier tube共Electron Tube Limited兲. The spectral range extended from about 5 eV共248 nm兲 to the CaF2 cutoff at 9.91 eV共125 nm兲. This range was covered in sections of 11 nm each, using steps of 0.1 nm; this step was found to be sufficiently small to resolve the structures in the cross section curves. The radiation transmitted through the empty cell (I0) was first recorded over the limited 共11 nm兲 range. Sample was then introduced into the cell and two scans of transmitted radiation (It) were recorded. The cell was subsequently evacuated and a second (I0) recorded. The mean of each of the of I0 and It values was used in the Beer–Lambert law to evaluate the cross section
It⫽I0exp共⫺Nx兲
where N is the target gas number density and x is the path length.
The averaging procedure compensated effectively for decay of the radiation intensity as the storage ring current decayed. Spectra are presented on an energy共eV兲 abscissa to enable direct comparison with the electron energy-loss data. The accuracy of the cross section is estimated to be ⫾5%.
C. Electron energy loss spectrometer„HREELS…
The instrument used 共VG-SEELS 400兲 has been de-scribed in detail elsewhere.18In this, an electrostatic electron energy monochromator defines a narrow energy spread about FIG. 1. 2-furanmethanol共furfuryl alcohol兲, with atom numbering.
the mean incident electron energy and a three elements lens focuses the electrons into the collision region. The electron beam intersects the gas beam, which flows through an hypo-dermic needle, at 90°. The analyzer system is of the same type as the monochromator. Both electron energy selectors work in the constant pass-energy mode. The scattered elec-tron signal is detected by an elecelec-tron multiplier of the con-tinuous dynode type. The resolution, measured at the FWHM of the peak due to elastically scattered electrons 共elastic peak兲, was about 40 meV. The residual energy of scattered electrons (Er) is related to the impact energy (Ei) as fol-lows: Ei⫽Ep⫹Er, where Ep is the energy-loss. The elastic peak corresponds to electrons with zero residual energy and hence is used to calibrate the electron energy-loss scale. Ac-curacy on the energy scale is ⫾0.008 eV. Spectra were recorded for energy-losses between 4.5 and 12 eV at step
intervals of 8 meV. The operating pressure was
1.5⫻10⫺5mbar during the measurements. The apparatus was used with relatively high incident energy electrons共100 eV兲 and a scattering angle共⬃0°兲, such that electric dipole inter-action conditions apply and the electron energy loss spec-trum is comparable with the photoabsorption specspec-trum. The inelastic scattered intensity was converted to a relative dif-ferential oscillator strength 共DOS兲 distribution, using the method developed previously:19
d f dE⬀I共Ep兲
再
ln冋
1⫹冉
¯ ␥冊
2册
冎
⫺1 and ␥2⫽冉
Ep 2T冊
2冉
1⫺Ep T冊
⫺1 .T is the incident electron energy, Ep is the electron energy loss, I(Ep) is the scattered intensity and¯ is the spectrom-eter angular acceptance共1.25°⫾0.25兲.
To obtain absolute values, the HREELS data must be normalized to a known cross section at a particular wave-length measured in the optical experiment. The cross section may then be calculated from
⫽109.75dEd f ,
whereis in Mb and d f /dE is in eV⫺1.
Comparison of the HREELS cross section values with those recorded using the synchrotron source provides a test for any systematic error in the optical values arising from the line saturation effect and second-order light from the light source and beam line. These were found to be negligible in this work.
D. Trapped electron spectrometer
Near-threshold electron energy loss spectra were re-corded in a trapped electron spectrometer which has been described.20 Briefly, incident electrons emitted from a fila-ment are energy selected by a trochoidal monochromator, which operates through the combined actions of an axial magnetic field and a perpendicular electric field. The energy-selected electrons enter collision region where the
electro-static potentials are such that those scattered electrons whose residual energy, Er⭐eW 共where W is the so-called trap well-depth兲 are trapped and collected along with any stable nega-tive ions formed in dissocianega-tive attachment processes. A negative ion current can be identified because it persists when W⫽0, because the trajectories of the relatively mas-sive ions are not significantly influenced by the axial mag-netic field; ions therefore travel in straight lines from the source and 共unless emerging in a forward direction兲 are in-tercepted by the collector.
The electron energy loss scale was calibrated with refer-ence to the krypton1P
1 peak at 10.04 eV. 21
E. Condensed phase UV photoabsorption spectroscopy
Absorption spectra of the chromophore, in solution in cyclohexane at various dilutions, were measured using a Kontron double beam spectrophotometer共Uvikon 941兲, with the solution in a quartz cuvette 共0.4 cm width and 1 cm length, Hellma兲. Accuracy for molar extinction coefficient is estimated at 30% at the band maximum and that for absor-bance measurement at 10%.
F. The sample
The furfuryl alcohol, stated purity 99%, was purchased from Acros Organics. The compound is highly hygroscopic and produces a strong azeotrope with water; it was, there-fore, handled under a controlled atmosphere of N2. Prior to use in gas phase experiments, the sample was de-gassed by repeated freeze–pump–thaw cycles. For the solution spectra, the cyclohexane solvent was HPLC grade, purchased from Sigma.
III. RESULTS AND DISCUSSION A. General comments
It has been shown that methyl substitution at position 2 of the furan ring affects the spectrum only slightly shifting the * bands to lower energies 共by about 0.1 eV兲 and modifying the intensities, but without introducing any new bands.5 2-methylfuran may be regarded as a precursor of furfuryl alcohol, a H atom in the former being replaced by –OH to give the alcohol. Also, furfuryl alcohol bears the same relation to furan that benzyl alcohol (C6H5CH2OH) does to benzene; the – CH2OH group modifies the spectrum of benzene in much the same way as does the methyl group.22We, therefore, discuss the present results for furfuryl alcohol together with those for furan and 2-methylfuran.
B. The photoelectron spectrum
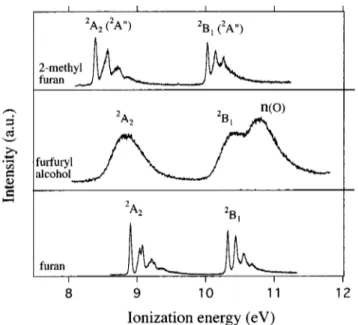
Figure 2 shows the photoelectron spectrum of furfuryl alcohol compared with those of furan5,23and 2-methylfuran5 in the 8 –12 eV ionization energy region. The furfuryl alco-hol spectrum contrasts with those of the other two molecules in that three ionization bands are seen rather than two and none shows vibrational fine structure. Vertical ionization en-ergies (IEV) for furfuryl alcohol are 8.880, 10.339, and 10.777 eV, respectively, the last two showing overlapping
bands. Considering the expected slight effect of the – CH2OH group on the ring -orbitals, we assign the first two ionizations to removal of electrons from -ring orbitals 共Table I兲. The 10.777 eV band is then attributed to ionization of an oxygen lone pair electron, no. This ionization energy is close to the first noionization energy in methanol共10.94 eV兲 and ethanol共10.64 eV兲.24Also, the first noionization in ben-zyl alcohol has been attributed to a band observed at 10.61 eV;25this last assignment was made from comparative stud-ies on gas and liquid-phase photoelectron spectra and so is considered secure.
Differences between the -ionization energies of furfuryl alcohol and those in furan may be explained by / hyperconjugation and inductive effects.26 –28 In 2-methylfuran both effects destabilize the ring -orbitals with a concomitant reduction in ionization energies. The ef-fects are more marked for orbital 3(1a2), in which the electron density is concentrated along C2– C3 and C4– C5 bonds, than for 2 where the density is along C3– C4. For furfuryl alcohol similar arguments apply, but in this case, the –OH group counteracts electron donation from the CH2 group. By withdrawing electrons from the ring, OH stabi-lizes the -orbitals and hence increases their ionization en-ergies. The net result is that, relative to furan, the-electron
ionization energies of furfuryl alcohol are less stabilized that those of the methyl derivative and they fall between those of the other two 共Fig. 2, Table I兲.
Although the effect of substitution on the energies of the
-orbitals of the furan ring appears to be slight, the presence of the –OH group has a profound effect on the ionic poten-tial surfaces; in contrast to 2-methylfuran, none of the cat-ionic states survives sufficiently long to show vibrational structure 共Fig. 2兲. This might be due vibronic couplings and/or dissociation and/or predissociation processes which may occur due to crossings with dissociative electronic states.
It follows that, in the electronic absorption spectrum of the molecule, excitation of a Rydberg-type state共which com-prises a distant electron bound to a positive ion core兲 appears as a broad band 共see below兲.
C. Singlet excited states
Figure 3 illustrates the gas-phase photoabsorption spec-trum共5–9.91 eV兲, the HREEL spectrum 共5–13.9 eV兲 and an FIG. 2. Comparison of the HeIphotoelectron spectra of furfuryl alcohol,
furan共Refs. 5 and 23兲 and 2-methylfuran 共Ref. 5兲 in the 8–11.2 eV region. FIG. 3. Comparison of the spectra of furfuryl alcohol: 共 兲 gas phase, VUV photoabsorption;共䊊䊊䊊兲 gas phase, HREEL; 共䊏䊏䊏兲 solution, UV absorption. The HREELS data were recorded at 100 eV and 0°, converted into differential oscillator strength and normalized to the VUV spectrum at 8.3 eV共149 nm兲.
TABLE I. Vertical ionization energies共eV兲 of furfuryl alcohol. Comparison with furan and 2-methylfuran. Labeling of the ionic states are made in the C2v point group. Vertical ionization energies values have been
obtained by taking the center of the bands.
Compound
EI1(2A2) EI2(2B1)
References
Energy ⌬ Energy ⌬
Furan 9.093 ¯ 10.528 ¯ a
Furfuryl alcohol 8.880 ⫺0.223 10.339 ⫺0.189 This work 2-methylfuran 8.605 ⫺0.488 10.271 ⫺0.257 b aReferences 5 and 23.
optical absorption spectrum recorded for a solution in cyclo-hexane 共4.2–6.36 eV兲. Where they overlap, the VUV and HREEL spectra are concordant. The first absorption band in the gas-phase spectra is reproduced in solution, with a slight red shift in energy;10peak maxima are at 5.87 共211 nm兲 and 5.69 eV 共218 nm兲 in gas-phase and solution respectively. This behavior is similar to that observed for the methyl de-rivative共energy shift⫽⫺0.1 eV兲29and is consistent with the shift expected for excitation of a 1* state.10 A recently reported Emaxof 4.96 eV for furfuryl alcohol in solution can now be discounted as being too far adrift from the gas-phase maximum.30
As predicted above from empirical considerations, the broad spectrum resembles those of furan and 2-methylfuran, stripped of their Rydberg fine structure. The electronic spec-trum has the appearance of a valence-excitation specspec-trum dominated by transitions betweenand*orbitals. Assign-ments for these then follow by analogy with furan. Thus, we suppose the first * band to derive most of its intensity from excitation of 共in C2v symmetry兲 the 11B2 state, Emax ⫽5.87 eV 共235 nm兲; the 11A
1 state is also within this band but is too weak to be identified. The intense peak, Emax ⫽7.65 eV, 162 nm, is assigned to excitation of state 21A
1 with 21B2at 8.5 eV共146 nm兲. These data are compared with those for furan and 2-methylfuran in Table II.
We turn now to excitation of Rydberg states. For a pure Rydberg state, the excitation energy, Eex is given by the Rydberg expression: Eex⫽IE⫺R/(n⫺␦)2 where IE is the ionization energy of the excited electron, n is the principle quantum number of the upper orbital 共here n⭓3) and ␦ is the quantum defect. For s-type states in furan, ␦⬃0.85 and with this value for furfuryl alcohol, the Rydberg state 33s is predicted to lie near 5.9 eV. However, because it is symmetry-forbidden in furan, it is likely to have a low oscil-lator strength in furfuryl alcohol and so not to distort the first absorption band. Rydberg states of type 33 p are expected between 6.4 and 6.8 eV. In fact, the full width at half maxi-mum共FWHM兲 of the first band is broader in the gas phase than in solution. As Rydberg states are suppressed in the condensed phase,10 we ascribe the broadening of the gas-phase absorption to excitation of p-type Rydberg states. Similarly, a weak bulge on the rising side of the second band around 7.3 eV coincides with the predicted excitation energy for 33d Rydberg states.
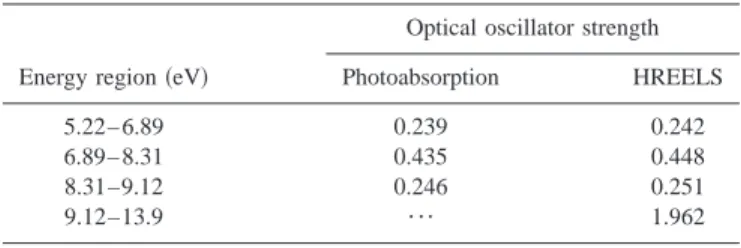
Absolute excitation cross sections for the two optical bands 共Fig. 3兲 are 29 and 52 Mb, respectively. These are close to corresponding values measured for 2-methylfuran 共30 and 48 Mb, respectively兲; for the latter, Rydberg-excited states could be positively assigned.5 Absolute oscillator strengths for furfuryl alcohol, estimated from both the VUV and HREEL spectra, are tabulated in Table III. Agreement between the two data sets is good showing that the optical spectra are free from the line saturation effects or errors due to second-order radiation.
D. Triplet excited states
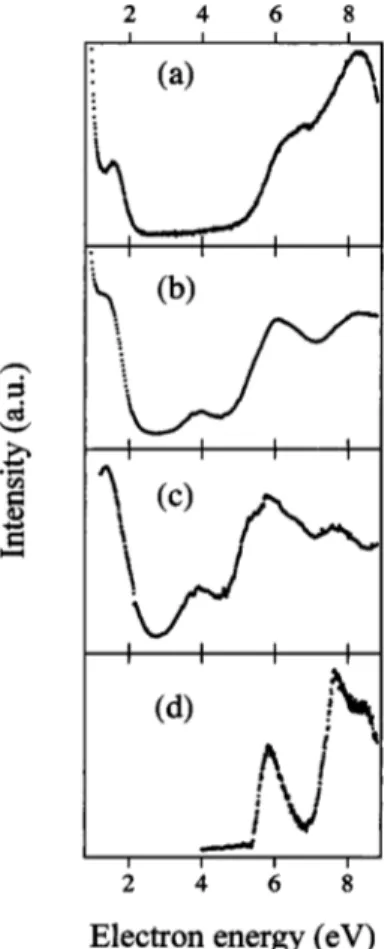
Figures 4共a兲 and 4共b兲, show data recorded in the trapped electron spectrometer for residual electron energies of⬃0.15 and 0.35 eV, respectively; in each case, the signal contains a contribution from negative ions as well as scattered electrons 共see below兲, but electrons predominate. In Fig. 4共c兲, the negative ions have been subtracted out, leaving a spectrum of scattered electrons whose residual energy is about 0.35 eV. For comparison, the HREEL spectrum recorded at 100 eV and 0° is included in 4共d兲.
In analyzing this data, we consider first electron energy-loss processes leading to electronically excited states. The data shows that most important of these are two triplet ex-cited states, positioned at about 3.9 and 5.1 eV, respectively. By analogy with furan, they are assigned as 3* states, 3B
2 and3A1, in that energy order; the corresponding ener-gies in furan are 3.97 and 5.2 eV, respectively 共Table II兲.31 The singlet–triplet splitting for 1,3B2 is then 1.97 eV, which is close to the corresponding values in furan and 2-methylfuran32 共Table II兲. In furan the1,3B2 states are each believed to result from a simple highest occupied molecular orbital 共HOMO兲→lowest unoccupied molecular orbital 共LUMO兲 transition.11–13,33As a singlet–triplet splitting is de-termined by the exchange interaction between the two par-ticipating orbitals,34it may be inferred that the spatial over-lap between the twomolecular orbitals is not changed very much upon substitution. This adds credence to the view that the CH2OH and CH3 groups have only a slight effect on the frontier orbitals of the furan ring.
There is a maximum in the energy-loss spectra at about 6 eV 关Fig. 4共d兲兴, close to that of the first observed optical band, but energy-losses detected at about 7 eV关Fig. 4共c兲兴 are absent from the optical spectrum. Additional experimental work will be required in order for these to be assigned.
TABLE II. Excitation energies共eV兲 of the lowest energy valence states for furfuryl alcohol, furan, and 2-methylfuran.
States
Compounds
Furan 2-methylfuran Furfuryl alcohol
3B2 3.97a 3.85b 3.9c 3A1 5.2a 5.1b 5.1c 11B2 6.06d 5.95e 5.87c 11A1 7.8d 7.7e 7.65c 21B2 8.7d 8.4e 8.5c ⌬(1 B2–3B2) 2.09 2.1 1.97 aReference 31. bReference 32. cThis work dReference 11. eReference 5.
TABLE III. Oscillator strength for furfuryl alcohol bands.
Energy region共eV兲
Optical oscillator strength Photoabsorption HREELS
5.22– 6.89 0.239 0.242
6.89– 8.31 0.435 0.448
8.31–9.12 0.246 0.251
E. Electron–molecule resonant processes
An energy-loss process visible around 1.6 eV in the spectra of Fig. 4共a兲 is ascribed to vibrational excitation of the neutral molecule by formation and subsequent autoionization of a short-lived negative ion. This anion also decays by sociation with the extra electron attaching to one of the dis-sociative fragments共dissociative electron attachment, DEA兲. This explains the negative ion signal collected at around 2 eV共Fig. 5兲. We suppose the common intermediate to be the so-called shape resonance resulting from trapping of the in-cident electron in the lowest unoccupied * molecular or-bital, 3b1*. The present technique does not allow for the
accurate determination of the electron attachment energy, so we cannot comment on subtle effects of the substituent on the energies of the unoccupied molecular orbitals, but our estimate for the attachment energy is around 2 eV. The cor-responding value for furan is 1.76 eV,35,36however in furan the dissociative attachment channel is not observed.
As the incident electron energy is increased additional DEA processes are revealed, resulting in the continuous pro-duction of negative ions 共Fig. 5兲. The threshold for these is about 3 eV which is close to the expected attachment energy for occupation of orbital 2a2, 5* 共3.15 eV in furan兲.
36 The alcohol group is probably implicated in the higher electron attachment processes as dissociative attachment to methanol has been observed leading to production of, mainly, H⫺and O⫺centered around attachment energies of 6.5, 8.5, and 10.5 eV, respectively.37
IV. CONCLUDING COMMENTS
We have made a range of spectroscopic measurements on 2-furanmethanol 共furfuryl alcohol兲, all of which may be interpreted on the assumption that substitution of a ring H by the CH2OH group has only a slight effect on the frontier orbitals of the furan system. This statement applies to the photoelectron spectrum, which has given information on the highest occupied-molecular orbitals; electron impact stud-ies which have yielded information on the normally unoccu-pied *orbitals; and to electronic excitation spectra which have revealed →*transitions, including some which are spin-forbidden. All of the spectra may, therefore, be inter-preted by analogy with furan, about which a great deal is known. A major difference between furan and furfuryl alco-hol is the absence of vibrational fine structure in any of the spectra of the latter. The propensity for bond rupture exists also in its interaction with electrons of low energy, which in contrast to furan, leads to widespread dissociative electron attachment in furfuryl alcohol.
ACKNOWLEDGMENTS
The Patrimoine of the University of Lie`ge, the Fonds National de la Recherche Scientifique and the Fonds de la Recherche Fondamentale Collective have supported this re-search. M.-J.H.-F. wishes to acknowledge the Fonds National de la Recherche Scientifique for a position; I.C.W. thanks them for financial support. The technical assistance of Jacques Heinesch 共University of Lie`ge兲 and Bill Stirling 共Heriot-Watt University兲 is highly appreciated. We are grate-ful to ISA ring facilities at A˚ rhus for the award of beamtime and thank the staff there. We acknowledge the support of the European Community—Access to Research Infrastructure Action of the Improving Human Potential Programme.
1
C. O. Kappe, S. S. Murphree, and A. Padwa, Tetrahedron 42, 14179
共1997兲, and reference therein.
2S. Glenis, M. Benz, E. Legoff, J. L. Schindler, C. R. Kannerwurf, and M.
C. Kanatzidis, J. Am. Chem. Soc. 115, 12519共1993兲.
3F. H. Chang, T.-C. Lin, C.-I. Huang, H.-R. Chao, T.-Y. Chang, and C.-S.
Lu, J. Hazard. Mater. A70, 1共1999兲.
4E. C. Tuazon, A. Alvarado, S. M. Aschmann, R. Atkinson, and J. Arey,
Environ. Sci. Technol. 33, 3586共1999兲.
FIG. 4. Electron energy loss spectra of furfuryl alcohol共a兲 Er⬃0.15 eV; 共b兲 Er⬃0.35 eV 共both contaminated with negative ions; 共c兲 electron only signal, Er⬃0.35 eV; 共d兲 100 eV 0° HREEL spectrum.
5A. Giuliani, J. Delwiche, S. V. Hoffmann, P. Lima˜o-Vieira, N. J. Mason,
and M.-J. Hubin-Franskin, J. Chem. Phys. 119, 3670共2003兲.
6M. Choura, N. M. Belgacem, and A. Gandini, Macromolecules 29, 3839
共1996兲.
7F. B. Benvenuti, A. M. R. Galletti, C. Carlini, G. Sbrana, P. Brushi, and A.
Nannini, Polymer 38, 4973共1997兲.
8P. S. Batista and M. F. de Souza, Polymer 41, 8263共2000兲.
9K.-M. Marstokk and H. Møllendal, Acta Chem. Scand. 48, 25共1994兲. 10
M. B. Robin, Higher Excited States of Polyatomic Molecules共Academic, New York, 1974, 1975兲, Vol. II, 1975, pp. 169 and 224, Vol. I, p. 85.
11M. H. Palmer, I. C. Walker, C. C. Ballard, and M. F. Guest, Chem. Phys.
192, 111共1995兲.
12
L. Serrano-Andre´s, M. Mercha´n, I. Nebot-Gil, B. O. Roos, and M. Fu¨lscher, J. Am. Chem. Soc. 115, 6148共1993兲.
13O. Christiansen and P. Jørgensen, J. Am. Chem. Soc. 120, 3423共1998兲. 14J. Delwiche, P. Natalis, J. Momigny, and J. E. Collin, J. Electron
Spec-trosc. Relat. Phenom. 1, 219共1972兲.
15
F. Motte-Tollet, J. Delwiche, J. Heinesh, M.-J. Hubin-Franskin, J. M. Gin-gell, N. C. Jones, N. J. Mason, and G. Marston, Chem. Phys. Lett. 284, 452共1998兲.
16J. H. D. Eland, Photoelectron Spectroscopy, 2nd ed.共Butterworth,
Lon-don, 1984兲
17
http://www.isa.au.dk/SR/UV1/uv1.htm
18F. Motte-Tollet, M.-J. Hubin-Franskin, and J. E. Collin, J. Chem. Phys. 97,
7314共1992兲.
19R. H. Huebner, R. J. Celotta, S. R. Mielczarek, and C. E. Kuyatt, J. Chem.
Phys. 59, 5434共1973兲.
20G. A. Keenan, I. C. Walker, and D. F. Dance, J. Phys. B 15, 2509共1982兲. 21C. E. Moore, Atomic Energy Levels, Vol. 2, U.S. Natl. Bur. Stand. Circ.
No. 467共1952兲.
22J. M. Gingell, G. Marston, N. J. Mason, H. Zhao, and M. R. F. Siggel,
Chem. Phys. 237, 443共1998兲.
23
P. J. Derrick, L. A˚ sbrink, O. Edqvist, B.-O¨. Jonsson, and E. Lindholm, Int. J. Mass Spectrom. Ion Phys. 2, 471共1969兲.
24K. Kimura, S. Katsumata, Y. Achiba, T. Yamazaki, and S. Iwata, Hand-book of HeI photoelectron spectra of fundamental organic molecules
共Japan Scientific Societies, Tokyo, 1981兲, pp. 105 and 106.
25R. E. Ballard, J. Jones, E. Sutherland, D. Read, and A. Inchley, Chem.
Phys. Lett. 137, 125共1987兲.
26P. Linda, G. Marino, and S. Pignataro, J. Chem Soc. B 1971, 1585. 27
F. Fringuelli, G. Marino, A. Taticchi, G. Distefano, F. P. Colonna, and S. Pignatarro, J. Chem. Soc., Perkin Trans. 2 1976, 276.
28
L. Nyulaszi, T. Vespremi, E. Zimonyi, and J. Nagy, J. Mol. Struct. 114, 35
共1984兲.
29L. Nyulaszi, J. Mol. Struct. 273, 133共1992兲.
30C. R. Mendonc¸a, P. S. Batista, M. F. de Souza, and S. C. Zilio, Chem.
Phys. Lett. 343, 499共2001兲.
31
A. Giuliani and M.-J. Hubin-Franskin, Int. J. Mass. Spectrom. 205, 163
共2001兲.
32A. Giuliani and M.-J. Hubin-Franskin, Chem. Phys. Lett. 348, 34共2001兲. 33K. H. Thunemann and R. J. Buenker, Chem. Phys. 47, 313共1980兲. 34Josef Mich and Vlasta Bonacic-Koutecky, Electronic Aspect of Organic
Photochemistry共Wiley, New York, 1990兲, p. 41. 35E. H. van Veen, Chem. Phys. Lett. 41, 535共1976兲. 36
A. Modelli, Chem. Phys. 6, 57共1997兲.
37M. G. Curtis and I. C. Walker, J. Chem. Soc., Faraday Trans. 88, 2805