HAL Id: dumas-01387098
https://dumas.ccsd.cnrs.fr/dumas-01387098
Submitted on 25 Oct 2016
HAL is a multi-disciplinary open access
archive for the deposit and dissemination of sci-entific research documents, whether they are pub-lished or not. The documents may come from teaching and research institutions in France or abroad, or from public or private research centers.
L’archive ouverte pluridisciplinaire HAL, est destinée au dépôt et à la diffusion de documents scientifiques de niveau recherche, publiés ou non, émanant des établissements d’enseignement et de recherche français ou étrangers, des laboratoires publics ou privés.
Diagnostic non-invasif des stéatohépatites non
alcooliques : évaluation de nouveaux candidats
biomarqueurs plasmatiques
Justine Barthelon
To cite this version:
Justine Barthelon. Diagnostic non-invasif des stéatohépatites non alcooliques : évaluation de nouveaux candidats biomarqueurs plasmatiques. Médecine humaine et pathologie. 2016. �dumas-01387098�
AVERTISSEMENT
Ce document est le fruit d'un long travail approuvé par le
jury de soutenance et mis à disposition de l'ensemble de la
communauté universitaire élargie.
Il n’a pas été réévalué depuis la date de soutenance.
Il est soumis à la propriété intellectuelle de l'auteur. Ceci
implique une obligation de citation et de référencement
lors de l’utilisation de ce document.
D’autre part, toute contrefaçon, plagiat, reproduction illicite
encourt une poursuite pénale.
Contact au SID de Grenoble :
bump-theses@univ-grenoble-alpes.fr
LIENS
LIENS
Code de la Propriété Intellectuelle. articles L 122. 4
Code de la Propriété Intellectuelle. articles L 335.2- L 335.10
http://www.cfcopies.com/juridique/droit-auteur
1 UNIVERSITE GRENOBLE ALPES FACULTE DE MEDECINE Année universitaire 2015 – 2016
Diagnostic non-invasif de la stéatohépatite non alcoolique :
évaluation de nouveaux candidats biomarqueurs
plasmatiques
THESE PRESENTEE POUR L’OBTENTION DU DOCTORAT EN MEDECINE DIPLÔME D’ETAT en Gastro-entérologie et Hépatologie JUSTINE BARTHELON THESE SOUTENUE PUBLIQUEMENT A LA FACULTE DE MEDECINE DE GRENOBLE* Le Mercredi 19 Octobre 2016 DEVANT LE JURY COMPOSE DE Président du jury : Mr le Professeur Jean-Pierre Zarski Directeur de thèse : Mr le Professeur Vincent Leroy Membres : - Mme le Docteur Virginie Brun - Mme Le Professeur Nathalie Sturm - Mme le Docteur Marie-Noëlle Hilleret - Mr le Professeur Jérôme Boursier*La Faculté de Médecine de Grenoble n’entend donner aucune approbation ni improbation aux opinions émises dans les thèses ; ces opinions sont considérées comme propres à leurs auteurs.
2
Table des matières
TABLE DES MATIERES ... 2
REMERCIEMENTS ... 3
LISTE DES PU-PH ET MCU-PH POUR L’ANNEE 2016-2017 ... 4
LISTE DES ABREVIATIONS ... 8
RESUME ... 9
INTRODUCTION ... 11
ARTICLE ... 18
ABSTRACT ... 21INTRODUCTION ... 23
PATIENTS AND METHODS ... 26
RESULTS ... 32
DISCUSSION ... 34
TABLES ... 37
FIGURES ... 42
SUPPLEMENTARY DATA ... 47
SUPPLEMENTARY TABLES & FIGURES ... 53
DISCUSSION ... 56
REFERENCES ... 65
ANNEXES ... 73
CONCLUSION ... 75
SERMENT D’HIPPOCRATE ... 77
3
Remerciements
Je remercie les membres du jury d’avoir accepté de juger ce travail : Au président de ce jury, Monsieur le Professeur Jean-Pierre Zarski, merci infiniment de participer à ce titre. Je suis fière d’avoir pu bénéficier de votre enseignement durant mon internat. J’espère que ce travail sera à la hauteur de vos attentes.
A mon directeur de thèse, Monsieur le Professeur Vincent Leroy, pour avoir accepté de diriger ce travail et s’y être investi. Merci de nous transmettre dès nos premiers semestres au CHU votre passion pour l’hépatologie. Je vous suis profondément reconnaissante pour votre enseignement et la confiance que vous m’accordez.
A Monsieur le Professeur Jérôme Boursier, pour votre expertise dans le domaine des marqueurs non-invasifs, pour avoir accepté de traverser la France pour cette singulière occasion. J’espère que votre regard expert sera indulgent. Au plaisir de pouvoir travailler conjointement entre nos deux CHU. A Madame le Professeur Nathalie Sturm, pour votre expertise dans ce domaine bien particulier, pour votre précieuse aide sur l’interprétation des biopsies hépatiques, les lumières mises sur les scores anatomopathologiques (notamment le nouveau SAF !), et les remarques pertinentes sur la façon d’implémenter la base de données. A Madame le Docteur Virginie Brun, pour ta bonne humeur permanente, ta patience inépuisable l’an passé quand il s’agissait de m’apprendre à faire des dilutions ou lire des résultats de MS, pour ton dynamisme inestimable ayant permis de mener à bien ce master 2. Merci de m’avoir ouvert les portes du monde mystérieux de la Recherche. Tu as presque réussi à me convaincre de me lancer en thèse de science !
A Madame le Docteur Marie-Noëlle Hilleret, pour t’être prêtée au jeu le plus assidûment dans l’inclusion de cette base (la reine du périmètre de hanches !), pour tes bons conseils, que ce soit en termes de transplantation hépatique ou de ski de fond. Merci de ta façon de nous former à l’hépato « socio-addicto-psychiatrique » grâce à tes patients des plus reconnaissables, et aux moments de détente « look » précédent souvent le début de la visite le mardi.
4
Liste des PU-PH et MCU-PH pour l’année 2016-2017
7
8
Liste des abréviations
Par ordre alphabétique :
ADH1B: Alcohol Dehydrogenase 1B
ADH4: Alcohol Dehydrogenase 4
AHA: American Heart Association
ALT: Alanine Transaminase
AQUA: Accurately QUantitate low Abundance protein
AST: Aspartate Transaminase
BHMT1: Betaine-homocysteine Methyl-Transferase 1
CK18: Cytokeratin 18
CNIL: Commission Nationale Informatique et Liberté
EASL: European Association for the Study of Liver
ELISA: Enzyme-linked Immunosorbent Assay
HDLc: HDL cholesterol
HMGB1: High Mobility Group Box 1
HNF4α: Hepatocyte Nuclear Factor 4α
IDF: International Diabetes Federation
LC-MS/SRM: Liquid Chromatography coupled to Mass Spectrometry/Selected
Reaction Monitoring
MS: Mass Spectrometry
NAFL: Non Alcoholic Fatty Liver
NAFLD: Non Alcoholic Fatty Liver Disease
NAS: NAFLD Activity Score
NASH: Non Alcoholic Steato-Hepatitis
NGAL: Neutrophil gelatin associated lipocalin
NHLBO: National Heart, Lung and Blood Institute Organization
PSAQ: Protein Standard for Absolute Quantification
PT: Prothrombin Time
SAF: Steatosis, Activity, Fibrosis
SAS: Sleep Apnea Syndrom
SRM: Selected Reaction Monitoring
TSC: Transferrin Saturated Coefficient
WHO: World Health Organization
9
Résumé
Les stéatopathies dysmétaboliques, ou NAFLD, sont devenues un véritable problème de santé publique, en lien avec l’explosion épidémiologique de l’obésité et du syndrome métabolique dans le monde. La biopsie hépatique reste à ce jour l’examen de référence, permettant un diagnostic positif fiable et une évaluation robuste de la sévérité de la maladie hépatique. Cependant, elle reste un mauvais gold standard, en raison de nombreuses limites. Les alternatives moins invasives, biologiques notamment, manquent de spécificité (transaminases). Il existe donc un réel besoin de biomarqueurs circulants capables de limiter le recours à la biopsie. L’objectif principal de cette étude est d’évaluer une sélection de candidats biomarqueurs plasmatiques, clarifiant la sévérité de la NAFLD, en particulier la distinction entre stéatose et stéatohépatite.
Nous avons sélectionné 4 candidats protéiques (i.e BHMT1, ADH1B, ADH4 and CK18), par le biais de recherches bibliographiques exhaustives, de données “omiques”, et d’investigations préalables de notre équipe en protéomiques. Les concentrations de chaque candidat ont été obtenues pour 53 plasmas issus de patients porteurs d’une NAFLD prouvée histologiquement. Deux sous-groupes ont été définis selon le score SAF. La combinaison de tests immunologiques et d’analyses protéomique ciblée (mode LC-MS/SRM) fait la force de ce travail.
Les résultats obtenus pour CK18 concordent avec ceux de la literature, avec des taux plasmatiques plus élevés dans le groupe “maladie significativement active”, comparativement au groupe “maladie modérément active”, que ce soit pour la forme complète de CK18 M65, que pour son fragment M30 (respectivement p=0.0001;
10 histologiques de necroinflammation, tout comme la stéatose et la fibrose, ce qui en fait un biomarqueur de choix pour évaluer la sévérité globale des NAFLD. BHMT1 n’a en revanche pas pu être quantifié par test ELISA. Aucune différence n’a été observe entre les deux sous-groupes pour ADH1B et ADH4.
CK18 reste une protéine très intéressante pour l’appréciation de la sévérité globale des NAFLD. Concernant BHMT1, ADH1B et ADH4, les résultats d’analyses en protéomique ciblée manquent incontestablement pour se prononcer.
11
12 Les modifications récentes des comportements sociaux et environnementaux ont changé le profil épidémiologique des hépatopathies. Certaines ont émergé comme de nouveaux problèmes de santé publique1. Ainsi, les stéatopathies métaboliques ou NAFLD (Non Alcoholic Fatty Liver Disease) sont actuellement la cause la plus fréquente de maladie hépatique chronique aux Etats- Unis, affectant approximativement 80 millions de personnes2. Elle est en passe de devenir, dans la décennie qui vient, la première hépatopathie conduisant à la transplantation hépatique3,4. Sous ce terme de NAFLD sont en fait rassemblées plusieurs entités histo-pathologiques allant de la stéatose pure (ou NAFL pour Non Alcoholic Fatty Liver) considérée comme relativement bénigne, à la stéatohépatite (ou NASH pour Non Alcoholic Steatohepatitis), qui peut être associée à une fibrose d’intensité variable pouvant aller jusqu’à la cirrhose, et faire le lit du carcinome hépatocellulaire5. Le plus souvent observée chez des malades porteurs d’un syndrome métabolique, elle est considérée comme la manifestation hépatique de ce syndrome. La prévalence de la stéatose à l’échelle mondiale varie entre 6,3% et 33% avec une médiane de 20% en population générale. La prévalence estimée pour la NASH s’échelonne entre 3 et 5% selon les études. Dans certains groupes à risque, tels que les patients obèses subissant une chirurgie bariatrique, la prévalence des NAFLD peut atteindre 90%, dont 5% sont déjà au stade de cirrhose infra clinique6. Parmi les patients diabétiques de type 2, celle-ci peut dépasser les 22%7.
Plusieurs études ont montré qu’il existait une hausse de la mortalité toutes causes confondues chez les patients atteints de NAFLD, comparativement à la population générale ; en revanche seuls les patients porteurs d’une NASH ont une mortalité d’origine hépatique plus élevée8,9. Celle-ci est dix fois supérieure chez les sujets
13 NASH comparativement à la population générale9. Considérant le lien étroit entre NAFLD et syndrome dysmétabolique, sans surprise, la première cause de mortalité est cardiovasculaire, représentant 38% des étiologies6,10,11.
La biopsie hépatique est à ce jour le seul examen permettant de confirmer le diagnostic de NAFLD, plus spécifiquement de NASH, et d’en établir la sévérité. Il s’agit toutefois d’un acte invasif, coûteux, dont le taux de complication grave est de l’ordre de 1%12,13. Ses performances ne sont pas parfaites, en raison de problèmes de variabilité d’échantillonnage de la biopsie, et de reproductibilité des scores histologiques14. Il est de plus évident que cette procédure n'est pas appropriée en
tant que test de dépistage.
Les dosages utilisés en clinique quotidienne telles que les transaminases (ALAT et ASAT) ne répondent pas à ces critères. Elles ne sont pas un bon outil de dépistage, avec une sensibilité de 40% dans une population d’obèses opérées par by-pass. En outre, des lésions de NASH peuvent être observées chez des patients à transaminases normales15. Inversement, chez les patients ayant une cytolyse inexpliquée, seul un tiers ont des lésions de NASH à la biopsie16. Des scores composites clinico-biologiques ont fait l’objet de nombreuses publications ces dernières années, s’attelant sur l’évaluation de la fibrose (Fibromètre17, NAFLD Fibrosis Score18), sur celle de la stéatose (Steatotest)19, ou encore de la
composante nécrotico-inflammatoire amenant au diagnostic de NASH (oxNASH20, Nashtest21). Tous se heurtent malheureusement à des problèmes de définition de seuils optimaux, limitant les intervalles de diagnostic fiable et laissant de nombreuses zones diagnostiques grises. D’ailleurs, les dernières recommandations européennes sur les tests non-invasifs de fibrose hépatique, éditées en 2015, stipulent le manque d’études de validation externe dans le champ des NAFLD22.
14 Certaines publications récentes soulèvent néanmoins des résultats encourageants, notamment concernant la corrélation pronostique de ces tests23,24.
Sur le plan biologique, seulement quelques candidats biomarqueurs protéiques ont émergé ces dernières années. Cela concerne notamment la cytokératine 18 (CK18), intégrale, nommée antigène M65, et surtout son fragment clivé par la caspase 3 (nommé antigène M30), reflétant respectivement la mort cellulaire, et l’apoptose hépatocytaire25,26. Néanmoins, un manque de spécificité compromet toujours son utilisation, et donc sa disponibilité en routine clinique. En association au sein de scores composites, tels que le Nice Model27 ou le NASH Model of NAFLD Diagnostic
Panel28, la problématique de définition de seuils optimaux permettant un compromis entre sensibilité et spécificité reste de mise.
Par conséquent, il existe un réel besoin de mise au point de biomarqueurs circulants, qui à la fois permettraient la distinction entre NASH et NAFL, mais aussi évalueraient la sévérité de l’hépatopathie (i.e « stage » et « grade »).
Une des raisons à cette carence de biomarqueurs en hépatologie clinique provient du phénomène “d’entonnoir” technologique concernant leur développement. Ce dit “pipeline” correspond au processus amenant de la découverte à l’utilisation quotidienne du biomarqueur en clinique. Il souffre d’un manque de continuité entre laboratoires académiques et industrie orientée dans la mise au point de tels outils diagnostiques. Nos méthodes d’analyses doivent aussi être développées pour accéder plus rapidement à la phase d’évaluation des candidats, précédent la validation de ces derniers. Durant cette phase, la spécificité des candidats doit être étudiée29. Ceci implique la selection des candidats qui se révèlent significativement différents entre patients et donneurs sains. Généralement le test ELISA quantitatif est le test analytique privilégié pour ces études d’évaluation, grâce à sa haute
15 sensibilité et son important rendement. Néanmoins, comme la plupart des candidats échoueront en tant que biomarqueurs, le développement de ces tests immunologiques pour chaque candidat n’est pas viable30. En revanche, les analyses en spectrométrie de masse (MS) quantitative sont de plus en plus utilisées dans ce domaine. Lorsque le type d’échantillon est complexe, tel que le plasma, l’analyse MS est réalisée en mode “ciblé”, dit “targeted”. Parmi d’autres, le mode Selected Reaction Monitoring (SRM) s’avère prometteur pour palier à ces obstacles technologiques31,32, grâce à sa capacité d’analyse multiplexée. Cette approche repose sur l’analyse sélective préalable de peptides “signatures” issus des candidats biomarqueurs. Pour leur quantification absolue, c’est-à-dire pour déterminer leur concentration dans le plasma étudié, des standards isotopiques marqués sont couramment utilisés. Ces standards peuvent être des peptides ou des protéines, et génèrent les mêmes peptides signature que les protéines candidates33. Grâce au marquage isotopique, ils peuvent alors être détectés distinctement pendant l’analyse MS. La quantification est possible par la comparaison des signaux obtenus par les peptides signatures non marqués, avec ceux obtenus pour les marqués (qui sont injectés à des concentrations connues préalablement définies). Parmi les méthodes d’analyse MS quantitative ayant recours à des peptides isotopiquement marqués, la méthode PSAQ™ fournit les meilleures performances analytiques34.
Cette méthode utilise des protéines intégrales entièrement marquées isotopiquement, comme standard de quantification. Comme ces standards PSAQ sont ajoutés directement dans les échantillons à la phase initiale, ils suivent l’exact même processus analytique que les cibles protéiques, et fournissent donc des résultats quantitatifs robustes.
16 fibro-inflammatoires sont complexes et probablement multiples. L’insulinorésistance joue un rôle central dans la pathogénie de ces lésions35,36. Le stress oxydant, l’apoptose, la sécrétion de cytokines pro-inflammatoires telles que le TNFα sont incontestablement impliqués. L’hypothèse historique du « double-hit » (accumulation lipidique hépatique relative au mode de vie et à l’insulinorésistance, responsable secondairement d’une sorte de sensibilisation du foie à une cascade d’évènements biochimiques promoteurs de fibrogénèse et d’inflammation), est maintenant abandonnée, au profit du « multiple-hit », développé par Buzzetti37 récemment. Basé
sur les principaux acteurs de la pathogénèse, ce projet s’inscrit dans le cadre des recherches translationnelles visant à utiliser les données et les méthodes d’analyse protéomique comme outil de développement de nouveaux biomarqueurs. Dans le domaine de l’hépatologie, ces nouveaux biomarqueurs permettront de restreindre les indications et donc la morbimortalité des biopsies hépatiques. Ainsi, ce travail prend part à un plus vaste projet qui a permis la sélection initiale d’un pool de protéines candidates : BHMT1 (Betaine-Homocysteine-S-Methylransferase 1), ADH1B et 4 (Alcohol Deshydrogenase 1B et 4), NGAL (Neutrophil Gelatined Associated Lipocalin), HMGB1 (High Mobility Group Box 1), HNF4α (Hepatocyte Nuclear Factor 4α), auxquelles CK18 a été ajoutée. Ces protéines, exprimées par le foie et détectables dans le plasma, ont été obtenues en croisant des bases de données bioinformatiques, génomiques et protéomiques, développées plus loin. L’objectif de cette étude est d’évaluer ces protéines candidates biomarqueurs pour le diagnostic différentiel entre stéatose et NASH, reposant sur le pouvoir analytique de la protéomique “ciblée”, consolidé par des tests immunologiques. Les objectifs en toile de fond sont de permettre le diagnostic plus précoce de la progression au sein du spectre NAFLD, donc de mieux en apprécier le pronostic, ainsi qu’à long terme
17 pouvoir optimiser la prise en charge thérapeutique.
18
19
Non-invasive diagnosis of non-alcoholic steatohepatitis:
evaluation of new plasma biomarker candidates
Justine Barthelon2,3,4, Floriane Pailleux1,2,3, Michel Jaquinod1,2,3, Ninon Zala1,2,3,
Mathilde Louwagie1,2,3, Benoit Gilquin1,2,3, Cindy Fenoll4, Laure Bordy4, Marie-Noëlle Hilleret4, Thomas Decaens4, Jean-Pierre Zarski4, Nathalie Sturm5, Virginie Brun1,2,3,
Vincent Leroy4 1: CEA, iRTSV-BGE, F-38000 Grenoble, France 2: INSERM, BGE, F-38000 Grenoble, France
3: Université Grenoble Alpes, iRTSV-BGE, F-38000 Grenoble, France 4: Clinique universitaire d’Hépatogastroentérologie, CHU A. Michallon, F-38000 Grenoble, France
5 : Service d’anatomopathologie, CHU A. Michallon, F-38000 Grenoble, France Corresponding authors :
- Barthelon Justine: Clinique universitaire d’Hépatogastroentérologie, CHU A. Michallon, F-38000 Grenoble, France ; Tel +33 4 76 76 54 50 ; E-Mail :
jbarthelon@chu-grenoble.fr
- Brun Virginie: CEA, IRTSV, Biologie à Grande Echelle, F-38054 Grenoble, France ; Tel +33 4 38 78 96 57 ; Fax +33 4 38 78 50 51 ; E-Mail : virginie.brun@cea.fr
- Leroy Vincent: Clinique universitaire d’Hépatogastroentérologie, CHU A. Michallon, F-38000 Grenoble, France ; Tel +33 4 76 76 54 50 ; E-Mail : vleroy@chu-grenoble.fr
Keywords: NAFLD, NASH, biomarkers, proteomic, SRM, ELISA, plasma, steatosis
20
Abbreviations: in order of appearance
NAFLD: Non Alcoholic Fatty Liver Disease NAFL: Non Alcoholic Fatty Liver
NASH: Non Alcoholic Steato-Hepatitis AST: Aspartate Transaminase
ALT: Alanine Transaminase CK18: Cytokeratin 18
ELISA: Enzyme-linked Immunosorbent Assay MS: Mass Spectrometry
SRM: Selected Reaction Monitoring
PSAQ: Protein Standard for Absolute Quantification IDF: International Diabetes Federation
AHA: American Heart Association
NHLBO: National Heart, Lung and Blood Institute Organization WHO: World Health Organization
CNIL: Commission Nationale Informatique et Liberté SAF: Steatosis, Activity, Fibrosis
EASL : European Association for the Study of Liver HNF4α: Hepatocyte Nuclear Factor 4α
HMGB1: High Mobility Group Box 1
BHMT1: Betaine-homocysteine Methyl-Transferase 1 NGAL: Neutrophil gelatin associated lipocalin
ADH1B: Alcohol Dehydrogenase 1B ADH4: Alcohol Dehydrogenase 4
AQUA: Accurately QUantitate low Abundance protein
LC-MS/SRM: Liquid Chromatography coupled to Mass Spectrometry/Selected Reaction Monitoring
SAS: Sleep Apnea Syndrom
TSC: Transferrin Saturated Coefficient PT: Prothrombin Time
HDLc: HDL cholesterom NAS: NAFLD Activity Score
21
Abstract
Background
In parallel with obesity and metabolic syndrome, NAFLD has become a Public Health problem in developed countries. Liver biopsy remains as the gold standard examination for reliable diagnosis and staging. However limitations, such as cost, stay problematical. Alternatives (transaminases, alone or integrated to composite scores) lack specificity. Thereby there is a clear need for circulating biomarkers. Our main objective was to evaluate some biomarker candidates in human plasma for assessing the severity of NAFLD, in particular discriminating NASH from steatosis. Methods
We have selected 4 biomarker candidates (i.e BHMT1, ADH1B, ADH4 and CK18) from omics databases, literature searches and previous proteomics/immunoassays investigations. Concentrations of the candidates have been determined in 53 plasmas from biopsy-proven NAFLD patients thanks to immunoassays. Two subgroups were defined according to SAF score. Orthogonal analyses thanks to targeted proteomics in the LC-MS/SRM mode, coupled with isotope dilution standards, are about to be finished.
Results
Quantification of CK18 with ELISA confirmed literature data, by the demonstration of higher plasmatic concentrations among significant disease group compared to mild disease group, for total as well as caspase-cleaved CK18 (respectively p=0.0001;
p=0.0004). Both CK18 are correlated with necroinflammatory histological
parameters, but also steatosis and fibrosis, looking as accurate biomarker for appreciating overall NAFLD severity. BHMT1 was not quantifiable by immunoassay.
22 No difference has been observed between 2 subgroups in terms of ADH1B and ADH4 plasma levels. Results from LC-MS/SRM are only preliminary.
Conclusions
Total CK18 and CK18 fragments are serious candidate biomarkers for assessing NAFLD severity, including discriminate NASH from NAFL. Regarding BHMT1, ADH1B and ADH4, results from targeted proteomics are long awaited. Larger-scale studies are necessary to confirm these preliminary results.
23
Introduction
Along with the spread of obesity, insulin-resistance and metabolic syndrome in Western countries, NAFLD (Non Alcoholic Fatty Liver Disease) has reached epidemic proportions and has emerged as a major public health concern38. This syndrome includes several histopathological entities, such as simple steatosis (NAFL: Non Alcoholic Fatty Liver) or NASH (Non Alcoholic SteatoHepatitis). While NAFL is considered as relatively benign, NASH can evolve rapidly to hepatocarcinoma and/or cirrhosis. The worldwide prevalence for steatosis ranges from 6.3% to 33% with a median of 20% in the general population, whereas the estimated prevalence for NASH ranges from 3 to 5%39. In high-risk groups, such as severely obese patients undergoing bariatric surgery, the prevalence of NAFLD can exceed 90% and up to 5% of patients may have unsuspected cirrhosis39. Among
type 2 diabetes patients, NAFLD prevalence could reach at least 22.3%40. Several studies have proven that patients with NAFLD have increased overall mortality compared to matched control population, but only those with NASH have an increased liver-related mortality rate41,42.
Liver biopsy remains as the gold standard examination for reliable diagnosis, in other words to stage NAFLD, to differentiate NASH from simple steatosis, and to grade fibrosis. However, this procedure is hampered by cost, invasiveness (severe complication rate is about 1%43,44) and its performances are still imperfect (sampling variability, histological scores reproducibility)45. Moreover, it is not appropriate as a screening test.
Thus, there is a clear need for circulating biomarkers that both accurately distinguishes NASH from NAFL, and determine stage and grade of the disease. To achieve this goal, NAFLD pathogenesis should be explored via different molecular
24 aspects, including necroinflammation (apoptosis46) - partly relative to steatosis - and fibrogenesis.
The dosage of transaminases (AST, ALT) is not suited for this application, because of a lack of sensibility and sensitivity. For instance, only 40% sensitivity for ALT was observed in a by-passed obese population. On the contrary histological NASH lesions can be noted among patients with normal transaminases47. Some composite scores have been proposed, focusing either on fibrosis staging, such as Fibrometer48 or NAFLD Fibrosis Score18, or on steatosis and/or necroinflammation severity assessment, such as Steatotest19. These scores meet with some troubles regarding
the definition of optimal thresholds, limiting reliable diagnosis21,49. Notably, few plasma biomarker candidates have recently been described. This is the case of CK18 (cytokeratin18), under both total and caspase-cleaved fragment, whom respective assays M65 and M30 measure total cell death and hepatocyte apoptosis25,26. Nevertheless, a lack of specificity still hampers its isolated use in daily
practice.
A main reason for the dearth of new biomarkers in clinical Hepatology is a technological bottleneck in the biomarker development pipeline. The biomarker development pipeline is the process leading from discovery to the clinical use of biomarker. This pipeline suffers from a lack of follow-through and synergy between the activities of academic laboratories and the diagnostics industry. Analytical tools must also be developed to help speeding the evaluation phase. During evaluation, the specificity of candidates must be checked by assaying them in plasma and determining their reference concentration intervals29. This involves first the selection of candidates that display different and significant abundances between patients and healthy donors. Most often quantitative ELISA (Enzyme-Linked ImmunoSorbent
25 Assay) is the favourite assay format for evaluation studies, thanks to its high sensitivity and high throughput. Nonetheless, as most candidates are likely to fail as pertinent biomarkers, ELISA development for all candidates is not feasible30. Quantitative mass spectrometry-based analysis is increasingly used to evaluate protein biomarker candidates. When working with highly complex samples like plasma, MS analysis (mass spectrometry) is generally performed in a “targeted” mode. Among others, Selected Reaction Monitoring (SRM) has shown promise as a solution to this technological hindrance 31,32, thanks to high multiplexing capacities. This approach involves the selective analysis of signature peptides produced from biomarker candidates. For absolute quantification of these biomarker candidates, i.e. to determine their concentrations in the samples studied, stable-isotope labeled standards are commonly used. These standards can be peptides or proteins and generate the same signature peptides as the target biomarkers33. Thanks to the isotopic labeling they can be distinguished from their non-labeled counterparts during MS analysis. Quantification is performed by comparing the signals generated by the non-labeled signature peptides to those generated by the corresponding labeled peptides (which are present at known concentrations). Among the quantitative MS-based methods using stable isotope standards, the PSAQ™ method provides the best analytical performance34. This method uses whole isotopically labeled proteins
as quantification standards. As PSAQ standards are spiked directly into the samples, they follow the same analytical process as their target analytes and provide highly accurate quantification results.
The goal of this study was to assess new protein biomarker candidates in plasma, for the differential diagnosis between steatosis and NASH, leaning on analytical power of targeted proteomics and immunoassays.
26
Patients and methods
Clinical samples
A prospective cohort of Caucasian patients suffering from NAFLD (i.e. “NAFLD cohort”) has been constituted within the Hepatology Clinic of Grenoble’s University Hospital, starting from November 2014. Inclusion period extended from November 2014 to May 2016. They were untreated, over the age of legal majority patients consulting for persistent increases of liver enzyme levels and/or steatosis discovered through ultrasonography, nearby one of the five hepatologists of the Clinic. Each patient who presented a cytolysis (AST and/or ALT > N), and/or GGT > 1N and/or hyperferritinemia (>200 µg/L), in the presence of at least one component of metabolic syndrome (according to the IDF/AHA/NHLBO definition in 200950; see Supplementary Table 1) could be suspected of NAFLD, and thus be proposed for inclusion in the cohort. Alcohol daily consumption had to respect World Health Organization (WHO)’s standards (i.e ≤ 30g/j or 21 units per week for men and ≤ 20g/j or 14 units per week for women).
Liver disease of other evident aetiologies such as alcohol-induced or drug-induced liver disease, viral hepatitis, cholestatic or metabolic/genetic liver disease (including hemochromatosis), and malignancies, were systematically searched, using specific clinical, laboratory, radiographic and/or histological criterions. Patients were excluded if such cofactor was identified. Subjects in whom an alcohol history was not provided, or when history was not enough precise concerning years ago, were also excluded. Serology for viral hepatitis B and C, as well as HIV, was performed in all patients, and all tested negative.
A total of 53 patients were identified. A complete medical history and physical examination was performed in all patients at the time of the first senior consultation.
27 Extensive laboratory data were collected thanks to twelve hours-fasting blood samples, taken once for each patient, of which a part was collected in EDTA tubes (BD Biosciences) to implement a bio-bank. These tubes were next centrifuged at 4400 g for 10 min to obtain plasma supernatants, immediately aliquoted and frozen at -80°C. Plasma samples from 11 healthy donors, paired by sex and age for 11 patients, were also collected during the same period, recruited on a voluntary basis. The study protocol conforms to the ethical guidelines of the 1975 Declaration of Helsinki as reflected in a priori approval by the institution's human research committee (registered number from the hospital’s institutional review board: DC 2008-727; registered number from the National Commission for Data Protection and Liberties (CNIL-France): 1806433v0). Written informed consent was obtained from each patient included in the study (See Supplementary Data section I).
Liver Histology
A liver biopsy was systematically performed to confirm the diagnosis of NAFLD, as the reference for the definitive diagnosis of NASH. Delay between collecting blood samples (most often the day of the first appointment or the day of the liver biopsy) and liver biopsy had to be less than 26 weeks. Histologic examinations were performed by two experienced hepatopathologists. Histopathological findings were reported according to the Non-Alcoholic Steatohepatitis Clinical Research Network Scoring System51, and the SAF score52, now recommended by EASL53 (See Supplementary Table 2A et 2B). Grade of steatosis (S from 0 to 3), grade of activity (A from 0 to 4) calculated by addition of grades of ballooning (from 0 to 2) and lobular inflammation (from 0 to 2) were separately assessed. Stage of fibrosis was defined using a 4-point scale according to Kleiner system51 (0 = no fibrosis; 1 =
28 perisinusoidal or portal; 2 = perisunusoidal and portal /periportal; 3 = septal or bridging fibrosis; 4 = cirrhosis). We did not consider the subtypes 1 a-b-c because of the small size of our cohort, but preferred the simplified pattern. Biopsies were split into 2 subgroups according to SAF, as defined by Bedossa54: mild disease (A<2 and
F<2) and significant disease (A≥2 and/or F≥2). This strategy allows a definition of overall histological severity of disease independently of a diagnosis of NASH, but based on activity and fibrosis.
Selection of protein biomarker candidates
This study fits into a larger project that is still in progress, which has started with the selection of plasma biomarker candidates thanks to an original bioinformatics approach (see Supplementary Data section II for detailed explanations). Five targeted proteins have been selected. All are implicated in cellular death mechanisms and/or inflammation, except HNF4α (Hepatocyte Nuclear Factor 4α) involved in lipid metabolism. These included HMGB1 (High Mobility Group Box 1), BHMT1 (Betaine-homocysteine Methyltransferase 1), NGAL (Neutrophil gelatin associated lipocalin), ADH1B (Alcohol Dehydrogenase 1B), HNF4α, to whom CK18 (cytokeratin 18) is added as an already “reference” biomarker (under both total and caspase-cleaved fragment).
Screening of candidates
Next step was about selecting those proteins clinically relevant for NASH diagnosis. Concentrations have been determined in 11 plasma from NASH patients compared to 11 plasma from healthy donors, paired by sex and age. To complete the multiplex dosage of these candidates, we harnessed the analytical power of targeted
29 proteomics in the LC-MS/SRM mode, coupled with isotope dilution PSAQ standards (for BHMT1, ADH1B and NGAL provided by Promise Advanced Proteomics). Immunoassays have been used for orthogonal analytical validation. HMGB1, HNF4α, and CK18 (total and caspase-cleaved fragment) plasmatic concentrations in the 22 samples were determined using Human HMGB1 ELISA Kit (IBL International), Human HNF4α ELISA Kit (BlueGene), Human M65 + Human M30 ELISA Kit (Peviva VLV Bio), respectively. Plasmatic concentrations were defined using the ELISA analysis software (http://www.elisaanalysis.com/app). Four-parameter logistic or polynomial cubic regressions have been used for fitting algorithm, as recommended by providers.
Evaluation of candidates
Then we focused on the 2 biomarker candidates that performed well in this previous step (i.e BHMT1, ADH1B). This involved evaluation of their specificity among the cohort of 53 patients described above, thanks to targeted proteomics in the LC-MS/SRM mode, and immunoassays. ADH4 (Alcohol Dehydrogenase 4) was added to the panel, whereas CK18 (total and caspase-cleaved) was kept as a control candidate.
Biochemical preparation and LC-MS/SRM Analysis
This step is still in progress. Samples are submitted to the same kind of biochemical process than for screening set. LC-MS/SRM method has been developed to be more accurate.
30
ELISA Assays
CK18 (total M65 and caspase-cleaved fragment) plasmatic concentrations in the 53 samples were determined using the same kit as previously. ADH4, ADH1B and BHMT1 plasmatic concentrations in the 53 samples were determined using the Human ADH4 BioAssay™ ELISA Kit (US Biological life sciences), Human ADH1B ELISA Kit (Cloud-clone corp) and Human BHMT1 ELISA Kit (Cusabio). The three kits were purchased via Antibodiesonline website. Assays and data analysis were performed in accordance with the manufacturer’s instructions. Concentrations from immunoassays that were above the highest concentration standard were controlled after a dilution of plasma sample according to the manufacturer’s instructions and submitted to a new assay. The optical density was measured at 450 nm using a microplate reader (BMG Labtech). Plasmatic concentrations were defined using the same ELISA analysis software. Four-parameter logistic or linear regressions have been used for fitting algorithm. ELISA assays were performed for all samples in a single session by two trained investigators.
Statistical analysis
Statistics were calculated with Excel 2010, online website BiostaTGV (http://marne.u707.jussieu.fr/biostatgv/), and Prism software (Version 2014). Descriptive statistics were computed for all variables, including medians, 25th and 75th percentiles for continuous factors. Percentages were calculated for categorical variables. Mann-Whitney’s tests were used to assess if there were any differences in terms of continuous clinical ou biological characteristics between the 2 groups. Fisher’s exact test was used for categorical factors. Spearman’s correlation test was
31 used to evaluate the association between each protein candidate and several factors of interest, mainly histological. p < 0.05 was considered at statistically significant.
32
Results
Patientsand biopsies
Table 1 sums up baseline clinical and biological characteristics of patients cohort, whereas Table 2 their histological characteristics. There was no statistical difference between two subgroups except for diabetes, waist circumference, HDL cholesterol, hyaluronic acid, revised Quicki. There was no statistical difference either regarding biopsy length, with a median of 26 mm.
Screening of candidates
LC-MS/SRM underlined higher plasma levels of BHMT1 and ADH1B in NASH patients compared to healthy donors (p=0.004; p=0.008 respectively). Respective box plots are presented in Figure 1A/B. Quantification of CK18 with ELISA confirmed literature data, by the demonstration of higher plasmatic concentrations among NASH patients compared to controls (p=0.001 for M65; p=0.002 for M30). NGAL, HMGB1 and HNF4α were not quantifiable by mass spectrometry, essentially because of a low signal/noise ratio, suggesting low plasma levels, with a LC-MS/SRM method insufficiently sensitive for reliable quantification. No difference has been observed between NASH and controls using ELISA assays for HMGB1 and HNF4α (respectively p=0.42; p=0.77).
33
Evaluation of candidates
We focused on BHMT1, ADH1B, ADH4 and CK18 under both total and fragment forms.
LC-MS/SRM Analysis
No result can be developed at this point. Analyses are still in progress, especially concerning BHMT1.
ELISA Assays
Tables 3 and 4 sum up statistical results for biomarker candidates.
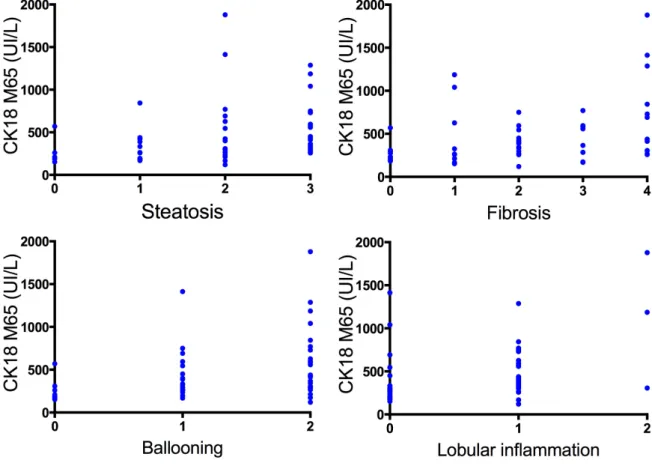
Regarding CK18, total as well as caspase-cleaved, statistical differences between mild and significant diseases (respectively p=0,0001 and p=0,0004) were underlined. Indeed we observed higher plasma levels in the subgroup with significant disease, compared to the second one. This suggests that both proteins are linked with the severity of NAFLD. Logically we observe correlations between plasma levels and histological parameters of necro-inflammation (i.e ballooning and lobular inflammation), but also with steatosis (especially for M30; p<0,0001) and fibrosis (see Figure 2A/B/C).
Regarding both ADH, we could not show any statistical differences in terms of concentrations between mild and significant diseases (see Figure 3A). No correlation could be observed either with the main histological variables (see Figure 3B/C). Interestingly, looking at routinely used prediction scores of liver fibrosis in NAFLD, we noted that Fibroscan seemed to be more accurate than Fibrotest (respectively
p=0,008; p=0,41), as summarized in Table 5.
We could not obtain any reliable data concerning BHMT1 dosage. Thus far there is no robust commercialized immunoassay available.
34
Discussion
NAFLD is nowadays the most common liver disorder in Western countries and Americas, reaching between 10 and 30% of adults, depending on age, sex, ethnicity, and diagnostic method. Presence of metabolic syndrome, or at least some components, can seriously increase its prevalence55. Moreover mortality is directly impacted by the presence of NAFLD or NASH5. Fibrosis is its main prognostic
factor10,11 demonstrated at this time. Liver biopsy stays the only reliable way to assess activity (i.e steatosis, necroinflammation) and severity (i.e fibrosis), but its invasiveness, variability and cost remain unsolvable problems in front of epidemic incidence. Therefore we need to deliver new biomarker candidates to overcome these limits, to achieve earlier prediction of disease progression (prognosis) and to improve therapeutic management.
Our investigations enabled the qualification of biomarker candidates with the selection of those that were effectively leaked in the plasma and that display different abundances between patients and healthy donors (i.e ADH1B, BHMT1, total CK18 and CK18 fragments). Then, adding ADH4, we evaluated their capacity to differentiate NASH from NAFL, and to assess fibrosis, compared to histological standardized parameters. Currently none of our candidates seem to be able to reach the performances of CK18. Nevertheless these first conclusions rest only on non-clinical immunoassays, and we are undeniably missing data from LC-MS/SRM, particularly concerning BHMT1. Thus we can point out some strengths of this work. To our best knowledge, we are among the first teams using SAF score for histological description, more accurate than NAS. In parallel we chose to classify patients according to overall histological severity, as proposed by Bedossa28. Among
35 other advantages, this attitude allows to better classify NASH patients with advanced fibrosis and consecutively more or less no activity. In most previous published studies regarding non-invasive biomarkers27,56, categorizing patients (« NASH », « Non-NASH », +/- « Borderline NASH ») was performed only with respect to NAS. Obviously this study has some limitations, whose several are shared with many previous studies in fact. First the size of our cohort is surely behing power insufficiency. Second alcohol intake was only declarative, which can lead to underestimation of drinking, particularly in France. Usefullness of questionnaires, such as AUDIT57,58, has been demonstrated to limit this confusion factor. Thirdly liver
histology was taken as reference but we know that it is an imperfect standard, as previously exposed. We did not perform double blinded analyses of liver biopsies either. Moreover delay between plasma collection and biopsy was fixed to a maximum of 26 weeks. Ideally any delay should be respected to minimize differences due to changes over time. Besides our data suffer from « one-time » point regarding biological and histological variables. Indeed variations of biomarkers over time compared to histology are probably more interesting to point out some correlations59.
The idea of finding a test that can diagnose NASH at a given moment looks really difficult, if not impossible. In 2014 Chan60 hypothesized that it may be more realistic
to search for biomarkers or composite scores that would reflect changes in severity of NASH when followed over time. Better than focusing on NASH, we should be able to detect during follow-up the time when necroinflammatory processes starts.
Facing epidemic proportions of NAFLD worldwide, find a way to accurately identify patients with active and/or advanced disease is mandatory. Test combinations with different biological biomarkers may be the best option. CK 18 has definitely proved
36 its interest in assessing NAFLD activity. BHMT1 and both ADH could be promising additional biomarkers, subject to proteomics awaited results. Longitudinal data correlating changes in histological severity and non-invasive measurement are urgently needed.
37
Tables
Table 1. Clinical and laboratory characteristics of Patient population
38 Table 2. Histological characteristics of Patient population
39 Table 3. Plasmatic concentrations for each protein biomarker candidate according to Mann-Whitney’s test.
40 Table 4. Spearmann’s correlation test between biomarker candidates and main histological parameters
41 Table 5. Performance of non-invasive routinely used fibrosis tests
* p value corresponds to the comparison of the two subject groups ° n = 35 for elasticity in the significant disease subgroup
42
Figures
Figure 1A. Box plot comparing plasma levels of BHMT1 between healthy donors (n = 11) and NASH patients (n = 11)
Figure 1B. Box plot comparing plasma levels of ADH1B between healthy donors (n = 11) and NASH patients (n = 11)
Mann-Whitney’s test was applied for both. p < 0.05 was considered as threshold of significance.
(µ g /m L ) ADH1 B (µ g /m L )
43 Figure 2A. Scatter-plot representing CK18 plasmatic levels according to histological activity of NAFLD (Mann-Whitney’s test)
Figure 2B. Individual data for total CK18 according to main histological parameters (Spearmann’s correlation test). Statistical signifiance was obtained for the four tests.
44 Figure 2C. Individual data for CK18 fragments according to main histological parameters (Spearmann’s correlation test). Statistical signifiance was obtained for the four tests.
45 Figure 3A. Scatter-plot representing ADH1B and ADH4 plasmatic levels according to histological activity of NAFLD (Mann-Whitney’s test)
Figure 3B. Individual data for ADH1B according to main histological parameters (Spearmann’s correlation test). No statistical difference was reported.
46 Figure 3C. Individual data for ADH4 according to main histological parameters (Spearmann’s correlation test). No statistical difference was reported.
47
Supplementary Data
I – Patients: Information and consent
Clinique d’HEPATOGASTROENTEROLOGIE Centre Hospitalier Universitaire de Grenoble CS 10217 – 38043 Grenoble Cedex 9
Version n°3 du 22/10/14
FORMULAIRE D’INFORMATION CONCERNANT LA REALISATION D’UNE BIOTHEQUE (PLASMATHEQUE, SEROTHEQUE, DNATHEQUE)
Madame, Monsieur,
Vous venez d’être reçu(e) en consultation spécialisée pour explorer des manifestations médicales d’ordre hépatique. Au décours de cette consultation, nous allons réaliser différents types de prélèvements tels que des prélèvements sanguins ou de tissus, qui serviront au diagnostic de votre maladie ou à l’adaptation du traitement qui vous sera proposé.
Le service d’hépato-gastroentérologie travaille sur la mise en place de banques biologiques pour l’évaluation de bio-marqueurs diagnostiques et pronostiques dans les pathologies hépatiques.
Objectifs de ces banques biologiques :
1) Faciliter la recherche médicale fondamentale et appliquée dans le domaine des maladies hépatiques, pour mieux les comprendre, et développer des traitements adaptés afin d’optimiser le suivi thérapeutique. 2) Améliorer la mise au point de techniques de laboratoire dans ce domaine.
Ces collections biologiques sont cruciales pour favoriser les progrès de notre discipline médicale.
Ce que nous vous proposons…
Nous vous proposons de conserver une partie de vos échantillons biologiques (plasma, sérum, ADN et tissus) à -80°C, dans le strict respect de la confidentialité et de l’anonymat, de façon à constituer des banques biologiques spécifiques. Ces recherches pourront éventuellement concerner vos caractéristiques génétiques mais ne porteront en aucun cas sur votre identification génétique, autrement dit, elles n’auront pas pour objet de créer des données nominatives, mais elles permettront d’accroître les connaissances de façon globale sur le rôle de facteurs génétiques dans votre maladie.
Conformément à la loi (art. 16-1 et 16-6 du code civil), ces prélèvements ne pourront pas être cédés à titre commercial ni donner lieu à une rémunération à votre bénéfice. Ils pourront être utilisés pour des recherches effectuées en partenariat avec un ou plusieurs organismes de recherche publics ou privés.
Cette constitution de banque biologique doit se faire avec votre consentement. Si vous acceptez de participer à la constitution de ces banques, les échantillons concernés rejoindront la Biothèque du CHU de Grenoble, officiellement déclarée auprès de notre ministère de tutelle (n° d’enregistrement DC 2008-727 et DC 2014-2295), dont le fonctionnement est légalement encadré. En cas de refus, cela ne modifiera en rien vos relations avec l’équipe médicale et la prise en charge qui est adaptée à votre cas.
Contrôle des données vous concernant :
Cette procédure est réalisée sous le contrôle strict des autorités sanitaires et est conforme à la Loi de Bioéthique du 6 août 2004. Vos données médicales associées au prélèvement seront réunies dans un fichier informatique anonymisé permettant leur traitement statistique en cas de projet de recherches. Ce fichier est soumis à l’autorisation de la Commission Nationale de l’Informatique et des Libertés (CNIL), conformément à la loi « Informatique et Libertés » du 6 janvier 1978 modifiée en 2004.
Vous bénéficiez d'un droit d'accès et de rectification aux informations qui vous concernent, droit que vous pouvez faire valoir auprès de votre médecin. Vous pouvez également, pour des motifs légitimes, vous opposer au traitement des données vous concernant.
48
Clinique d’HEPATOGASTROENTEROLOGIE Centre Hospitalier Universitaire de Grenoble CS 10217 – 38043 Grenoble Cedex 9
Version n°3 du 22/10/14
FORMULAIRE DE CONSENTEMENT CONCERNANT LA REALISATION D’UNE BIOTHEQUE
Je soussigné(e)……… Né(e) le ………
Certifie avoir pris connaissance du document d’information sur la constitution de banques biologiques en Hépato-gastroentérologie au CHU de Grenoble, qui m’a été remis lors de ma consultation.
☐ J’autorise que des prélèvements de sang et de tissus soient utilisés à des fins de recherche.
☐ Je m’oppose à ce que des prélèvements de sang et de tissus soient utilisés à des fins de recherche. ☐ J’autorise les recherches sur les caractéristiques génétiques (ADN).
☐ Je m’oppose aux recherches sur les caractéristiques génétiques.
Je suis informé(e) que mon consentement est révocable à tout moment auprès des médecins suivants :
Dr Hilleret 04 76 76 62 57 / Pr Leroy 04 76 76 93 68 / Dr Decaens 04 76 76 93 68 / Pr Zarski 04 76 76 54 41
Fait à : Le :
Signature du patient :
Nom et signature du médecin ayant recueilli le consentement :
Fait à : Le :
Dr :
Signature du médecin:
Fait en 2 exemplaires :
1 exemplaire conservé dans le dossier du patient 1 exemplaire remis au patient
49 II – Methods
Selection of protein biomarker candidates
This study fits into a larger project that is still in progress, which has started with the selection of plasma biomarker candidates thanks to an original bioinformatics approach. First, we established lists of proteins with restricted or liver-predominant expression (in fact, less than 2% of human proteins have a unique tissue profile). For this, we combined data from two main databases: TIGER (http://bioinfo.wilmer.jhu.edu/tiger/), which provides information about tissue-specific gene expression profiles, and Human Protein Atlas (www.proteinatlas.org), which presents the tissue and cellular expression profiles for human proteins using data from antibody-based analyses.
Second, the list of proteins was filtered to retain only those with a cytosolic localization, as we hypothesized that cytosolic proteins would reach the bloodstream faster, as cardiac biomarkers (i.e troponin). For each protein, we also confirmed its
tissue-specific function based on entries in the KEGG database
(http://www.genome.jp/kegg/) for metabolic pathways, the GO database (http://www.geneontology.org) and/or the scientific literature.
Thirdly, we searched for clues indicating that these proteins would be detectable in plasma thanks to targeted proteomics (and of course immunoassays). We used the Peptide Atlas database (www.peptideatlas.org), which is a multi-organism, web- accessible repertoire of peptides (obtained from protein trypsin digestion), which have been previously detected by mass spectrometry in a variety of matrices, including human plasma.
Finally five targeted proteins have been selected. All are implicated in cellular death mechanisms and/or inflammation, except HNF4α involved in lipid metabolism. These
50 included HMGB1, BHMT1, NGAL, ADH1B, HNF4α, to whom CK18 is added as an already “reference” biomarker (under both total and caspase-cleaved fragment).
Screening of candidates
Next step was about selecting those proteins clinically relevant for NASH diagnosis. Concentrations have been determined in 11 plasma from NASH patients compared to 11 plasma from healthy donors, paired by sex and age. To complete the multiplex dosage of these candidates, we harnessed the analytical power of targeted proteomics in the LC-MS/SRM mode, coupled with isotope dilution PSAQ standards (for BHMT1, ADH1B and NGAL provided by Promise Advanced Proteomics). AQUA peptides were used for HNF4α and HMGB1 quantification (Thermo Fisher Scientific). Samples (14 µL) were submitted to a biochemical process starting with the depletion of the six most abundant proteins using the Human Multiple Affinity Removal Spin cartridge (Agilent technologies). Then in-solution digestion was performed using Trypsin/Lys-C mix (Promega), before purification using a C18 reverse-phase column (Harvard Apparatus). Finally LC-MS/SRM analyses were performed randomly, in a single batch, on a 6500 QTrap mass spectrometer (400 to 1000 m/z range) equipped with a TurboV™ source and operating with Analyst™ Software (version 1.6.1, AB Sciex), coupled to an Ultimate 3000 micro-LC system (Thermo Scientific). Data analysis was performed using Skyline.
Immunoassays have been used for orthogonal analytical validation. HMGB1, HNF4α, and CK18 (total and caspase-cleaved fragment) plasmatic concentrations in the 22 samples were determined using Human HMGB1 ELISA Kit (IBL International), Human HNF4α ELISA Kit (BlueGene), Human M65 + Human M30 ELISA Kit (Peviva VLV Bio), respectively. Plasmatic concentrations were defined using the ELISA
51 analysis software (http://www.elisaanalysis.com/app). Four-parameter logistic or polynomial cubic regressions have been used for fitting algorithm, as recommended by providers.
Evaluation of candidates
Then we focused on the 2 biomarker candidates that performed well in this previous step (i.e BHMT1, ADH1B). This involved evaluation of their specificity among the cohort of 53 patients described above, harnessing again analytical power of targeted proteomics in the LC-MS/SRM mode, and immunoassays. ADH4 was added to the panel, whereas CK18 (total and caspase-cleaved) was kept as a control candidate.
Biochemical preparation and LC-MS/SRM Analysis
This step is still in progress. Samples are submitted to the same kind of biochemical process than for screening set. LC-MS/SRM method has been developed to be more accurate.
ELISA Assays
CK18 (total M65 and caspase-cleaved fragment) plasmatic concentrations in the 53 samples were determined using the same kit as previously. ADH4, ADH1B and BHMT1 plasmatic concentrations in the 53 samples were determined using the Human ADH4 BioAssay™ ELISA Kit (US Biological life sciences, purchased via Antibodiesonline), Human ADH1B ELISA Kit (Cloud-clone corp, bought via Antibodiesonline) and Human BHMT1 ELISA Kit (Cusabio, acquired via Antibodiesonline), respectively. Assays and data analysis were performed in accordance with the manufacturer’s instructions. Concentrations from
52 immunoassays that were above the highest concentration standard were controlled after a dilution of plasma sample according to the manufacturer’s instructions and submitted to a new assay. The optical density was measured at 450 nm using a microplate reader (BMG Labtech). Plasmatic concentrations were defined using the same ELISA analysis software. Four-parameter logistic or linear regressions have been used for fitting algorithm. ELISA assays were performed for all samples in a single session by two trained investigators.
53
Supplementary Tables & Figures
Table 1. IDF/AHA/NHLBO definition of metabolic syndrome Triglycerides > 1.5g/L or under treatment
Waist circumference > 94 cm for men and > 80 cm for women (European population)
High blood pressure with systolic > 130 mmHg and/or diastolic > 85 mmHg or under treatment
HDLc < 0.4 g/L for men and < 0.5 g/L for women Fasting glycaemia > 1 g/L or under treatment for diabetes
54 Table 2A. NASH-CRN scoring system (components of NAS only shown here)
55 Table 2B. SAF score
56
57 Cette étude a permis de soulever plusieurs problèmes actuellement rencontrés en recherche clinique sur les stéatopathies métaboliques.
Tout d’abord, se pose la question de l’utilisation des scores histologiques, la biopsie étant encore à ce jour un incontournable au diagnostic de NASH. Elle constitue la pierre angulaire dans l’évaluation des études sur les NAFLD, qu’elles concernent les performances d’un outil diagnostique, la définition de critères pronostiques, d’un essai thérapeutique…Notamment, le choix des critères histologiques utilisés pour classer les malades impactent directement sur notre façon d’interpréter les résultats. Ainsi, pendant plusieurs années, le score NAS, développé par Kleiner51, a été utilisé
pour séparer les patients en plusieurs catégories (« NASH – Non-NASH » ou « NASH, Borderline, Not-NASH »), où certains seuils du score, notamment NAS ≥ 5, a été pris -probablement « abusivement »- comme substitut au diagnostic histologique de NASH. Ce score n’est pas par définition un score diagnostique, en attestent différents avertissements de la part des anatomopathologistes, menée par E. Brunt, D. Kleiner et P. Bedossa61–63. Dès la publication du score semi-quantitatif, D. Kleiner écrivait : « the primary purpose of the NAS is to assess overall histological change; it is not intended that numeric values replace the pathologist’s diagnostic determination of steatohepatitis. The NAS has not also been studied as a measure of the rapidity of disease progression, nor should it be taken as an absolute severity scale»51. Ceci est d’autant plus vrai que cette façon de séparer les malades, par manque de stringeance du score (mais il n’est pas fait pour ça !), peut être générateur de classification erronée de certains patients. En effet, il n’est pas rare de constater que les patients atteints d’une cirrhose NASH avancée puissent avoir de rares ballonisations ainsi qu’un infiltrat inflammatoire polymorphe très modéré, se traduisant par un score NAS facilement ≤ 4, alors que le diagnostic de NASH est
58 avéré. En 2016, l’EASL suggère le score SAF comme alternative au NAS ; propose d’ailleurs de ne plus avoir recours au terme « borderline » ; et évoque le terme « burned-out NASH » pour désigner le cas des NASH à un stade de fibrose avancé avec régression des lésions princeps53. Le score NAS n’est par ailleurs pas corrélé à
la mortalité64,65, et sa valeur pronostique n’est toujours pas établie61,62,66. Pourtant il a été utilisé comme critère de jugement principal dans nombreux essais thérapeutiques, notamment les essais PIVENS et FLINT67–69.
De façon plus globale, certains patients sont également « oubliés » des études, le cas par exemple des patients non NASH mais porteurs d’une stéatose avec un fond d’activité, qui restent à risque de progression malgré tout, comme Adams et al le mettent en avant70. Aussi, deux études récentes, basées sur la comparaison de couple de biopsies hépatiques, constatent que la progression vers la fibrose se voit chez les patients NASH, tout comme les patients NAFL71,72, bien que dans une proportion moindre pour ces derniers.
Ces données soulignent aussi le problème de l’évaluation jusqu’à présent trop « statique » des variables, telles que la fibrose73, puisque fondées sur l’histologie (il n’est pas éthique d’envisager biopsier les patients tous les ans, bien que tentant sur le plan intellectuel). Or, les études physiopathologiques sont de plus en plus nombreuses à souligner l’importance de la continuité entre stéatose et stéatohépatite37, et l’impact de multiples facteurs intriqués sur la progression de la fibrose. L’enjeu serait donc davantage de trouver des outils non invasifs pour dépister et suivre les patients NAFLD, en termes de grading (i.e activité) et de staging (i.e fibrose), en intégrant la notion de marqueurs « cinétiques » reproductibles. Ce point est d’ailleurs abordé selon une perspective très intéressante par J. Boursier et al.23 concernant l’évaluation de la fibrose par marqueurs
non-59 invasifs, en introduisant le concept d‘échelle semi-quantitative pronostique du Fibroscan® et du Fibromètre®, sans recours à la biopsie.
En ce sens, notre étude présente l’avantage de se pencher sur l’utilisation du score SAF au travers d’une cohorte prospective de patients de «vraie vie », en optant pour une classification des patients en fonction de la sévérité globale histologique de leur NAFLD, et non du NAS exclusivement. Il est néanmoins vrai qu’à ce jour le SAF n’a pas été étudié pour savoir s’il est corrélé avec la mortalité.
En outre, nos résultats sont concordants avec les données de la littérature au regard de la cytokératine 18, pour laquelle les dosages ELISA sont validés, bien que non encore du domaine de la routine clinique. Son intérêt au sein de scores composites ne fait plus de doute. Pour n’en citer que deux, Polyzos et al.74 ont introduit un index nommé CHAI (acronyme pour CK18 M30, HOMA-IR, AST, Index), visant à la distinction entre NAFL et NASH. CHAI était significativement plus élevé chez les NASH (24.2 [15.1-214.0]) comparativement aux NAFL (15.7 [6.8-22.7]) et aux contrôles (5.1 [2.4-7.6]) (p < 0.001). Il était d’autant plus élevé que les lésions histologiques princeps étaient avancées. De façon similaire, Grigorescu et al.75 ont
comparé les taux plasmatiques de CK18 M65 entre 20 patients “non-NASH” and 59 NASH. En analyse multivariée, M65 était un facteur prédictif indépendant de NASH, avec une AUROC à 0.791. Associée avec l’adiponectine et l’IL-6, l’AUROC atteignait 0.903, avec 85.7% de spécificité et 84.5% de sensibilité.
Ce n’est pas le cas des ELISA utilisés pour le dosage de nos candidats biomarqueurs, notamment pour BHMT1. En effet les dosages ont été tentés avec différents kits mais les gammes de standard se sont avérées incohérentes, remettant en cause la fiabilité des produits. La mise au point d’une méthode protéomique ciblée SRM est en cours d’optimisation, qui sera indéniablement plus