HAL Id: hal-00662321
https://hal.archives-ouvertes.fr/hal-00662321
Submitted on 23 Jan 2012
HAL is a multi-disciplinary open access
archive for the deposit and dissemination of
sci-entific research documents, whether they are
pub-lished or not. The documents may come from
teaching and research institutions in France or
abroad, or from public or private research centers.
L’archive ouverte pluridisciplinaire HAL, est
destinée au dépôt et à la diffusion de documents
scientifiques de niveau recherche, publiés ou non,
émanant des établissements d’enseignement et de
recherche français ou étrangers, des laboratoires
publics ou privés.
Local 3D Shape Analysis for Facial Expression
Recognition
Ahmed Maalej, Boulbaba Ben Amor, Mohamed Daoudi, Anuj Srivastava,
Stefano Berretti
To cite this version:
Ahmed Maalej, Boulbaba Ben Amor, Mohamed Daoudi, Anuj Srivastava, Stefano Berretti. Local
3D Shape Analysis for Facial Expression Recognition. 20th International Conference on Pattern
Recognition (ICPR 2010), Aug 2010, Istanbul, Turkey. pp.4129 - 4132. �hal-00662321�
3D Face Analysis for Facial Expression Recognition
Ahmed Maalej
LIFL, Universit´e de Lille 1, France.
ahmed.maalej@telecom-lille1.eu
Boulbaba Ben Amor, Mohamed Daoudi
LIFL, Universit´e de Lille 1, France.
Institut TELECOM/TELECOM Lille 1, France.
Anuj Srivastava
Departement of Statistics, Florida
State University, USA.
Stefano Berretti
Dipartimento di Sistemi e Informatica,
University of Firenze, Italy.
Abstract
In this paper, we investigate the person-independent 3D facial expression recognition. A 3D shape analy-sis is applied on local regions of 3D face scan. The correspondent regions of different faces under different expressions, are extracted and represented by a set of closed that capture their shapes. A framework is ap-plied to quantify the deformations between curves and compute the geodesic length (or distance) that sepa-rates them. These measures are employed as inputs to a commonly used classification techniques such as Ad-aBoost and Support Vector Machines (SVM). A quanti-tative evaluation of our novel approach is conducted on the publicly available BU-3DFE database.
1
Introduction and recent advances
Facial expression analysis and recognition is an ac-tive and challenging research topic in computer vision, which guided researchers to develop applications in the field of Human-Machine Interaction. To study the way in which humans synthesize their emotions, we need to start to study the anatomical and biomechanical foun-dation of facial expression morphology. The pioneer-ing work of Ekman et al. [1] introduced in the early 70s the Facial Action Coding System. FACS is anatom-ically based and allows the reliable coding of any facial action in terms of the smallest visible units of muscu-lar activity. These units are called Action Units (AU), each referred to by a numerical code. AU combina-tions allow humans to build up prototypical facial ex-pressions of basic emotions which can be categorized to six classes : happiness, fear, sadness, surprise,
dis-gust, and anger. In the last few years, 3D face shape
analysis has emerged as a major research trend in face
recognition for its robustness to changes in lighting con-ditions and pose variations. However, one still needs to deal with intra-class variations related to facial ex-pressions. In fact, serious deformations caused by facial expressions, sometimes difficult to model (open mouth problem), present a very challenging problem. Thanks to these deformations, the 3D facial shape presents an interesting way to study facial expressions. This new method has attracted researchers to conduct work in 3D expressions recognition. Wang et al. [2] proposed to extract and label primitive surface features, and de-rive their statistical distributions for selected regions on the face scan. A person-independent facial expression recognition evaluation is conducted on the BU-3DFE database with an overall recognition rate of 83.6%. In [4], Tang etal. proposed an automatic feature selec-tion method, the features are normalized Euclidean dis-tances between a set of 83 ground truth points. Using a regularized multi-class AdaBoost classification algo-rithm, they achieve recognition rate of 95.1% .
In this paper, we further investigate the problem of 3D facial expression recognition. We propose a novel approach based on shape analysis of facial surfaces. More specifically, we are interested in studying local re-gions that we will call patches on the face and quantify their deformations under expressions. Finally, to cate-gorize a given expression, we use two of the commonly used classifiers AdaBoost and SVM. The remainder of this paper is organized as follows: In section 2, we de-scribe how we define and extract the patches around se-lected landmarks from facial surfaces. In section 3, we present our shape analysis framework for the 3D curves comparison and its extension to 3D patches analysis. In section 4, we report the experimental results and quanti-tative evaluation using the AdaBoost and the SVM algo-rithms for unbalanced classification problems. Finally, conclusion and future work are presented in section 5.
2
3D Facial Surfaces Representation
To recognize people, Samir et al. [5] represented facial surfaces by an indexed collection of 3D closed curves. These facial curves were characterized by one reference point, that is the nose tip, and were extracted over all the face surface. Then, the authors use a shape analysis framework to compare faces. In con-trast, the proposed approach is oriented to study locally facial patches. Thus, instead of starting from only one reference point, we choose multiple reference points
{rl}1≤l≤N, and we extract curves {clλ}1≤λ≤λ0over the
face regions centered in these points. In the Binghamton University 3D facial expression (BU-3DFE) database, collected by Yin et al. [3], there is an MPEG4 specifica-tion of 83 facial feature points marked on all 3D facial expression cropped models of the 3D static database. The main purpose of these points is to provide spa-tial references to key positions on a human face, and they are chosen to reflect the best facial anatomy and biomechanical behavior of face’s regions. We consider these feature points as reference points to locate patches and extract curves. Let rl be a reference point
corre-sponding to a specific patch Pl on the facial surface,
denoted by S. Then, we define an Euclidean distance function d : S × S −→ R+, from rl to any point p
of the facial surface S, with rl and p ∈ R3, so that
d(rl, p) = kp − rlk. Using this function, one can define
the facial curves as the level sets of d(rl, .):
cl
λ= {p ∈ S|d(rl, p) = λ} ⊂ S, λ = λ0. (1)
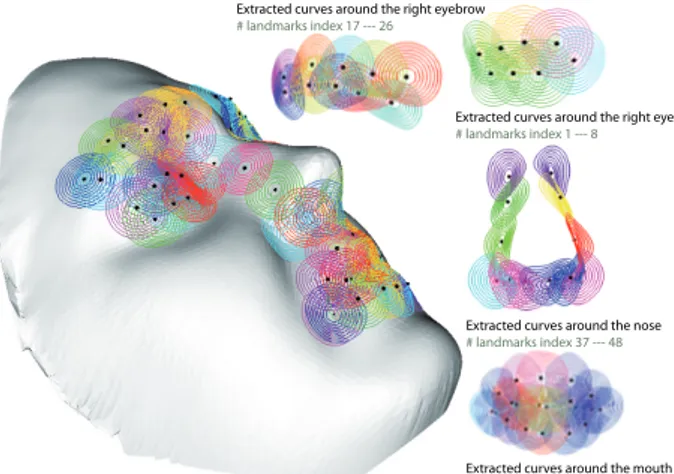
Each Cλl is a closed curve, consisting of a collection of points belonging to S and situated at an equal distance λ from rl. The Figure 1 illustrates examples of extracted
level curves over different regions of a face scan after surface smoothing.
3
Framework for 3D Shape Analysis
Having these patches around some landmarks on the facial surfaces, study of their shapes can learn us about the localization of muscle deformations on the face and consequently its emotional state. Under the general hy-pothesis that the subjects on the database smile, or con-vey any other expression, the same way, or more prop-erly the local regions that take place in the specific ex-pression may undergo practically the same process of dynamical deformations. Consequently we expect that the value of the distance, computed by the framework, between two patches associated to the same expression is smaller than the one computed between two patches belonging to two different expressions. In the following
Extracted curves around the right eye
# landmarks index 1 --- 8
Extracted curves around the nose
# landmarks index 37 --- 48
Extracted curves around the mouth
# landmarks index 49 --- 68
Extracted curves around the right eyebrow
# landmarks index 17 --- 26
Extracted curves on the facial surface except border ones
# landmarks index 1 --- 68
Figure 1. Curves extraction for facial re-gions representations centered on multi-ple reference points.
sections, we first present our framework for 3D curves analysis, then, we extend the ideas to capture shapes of 3D Patches.
3.1
3D Curve Shape Analysis
Thanks to the developed framework by Joshi et al. [6], we are able to perform curve-shape analysis to mea-sure the distance between curves and to compute the geodesic path, which represent the optimal deformation from one shape to another. To find geodesic paths tween patches, one needs to find the geodesic paths be-tween corespondent curves. The framework presents a square-root velocity function (SRVF) denoted by q, that captures the shape of a given curve β. For more details about the proposed curve shape analysis frame-work, reader can refer to [6]. In the next we will use the notation d(β1, β2) to denote the geodesic distance, or
the length of the geodesic in S, between the two curves
β1and β2.
3.2
3D Patches Shape Analysis
Now we extend ideas developed in the previous sec-tion for analysing shapes of curves to the shapes of patches. As mentioned earlier, we are going to rep-resent a patch of a facial surface S with an indexed collection of the level curves of the d function (eu-clidean distance from the reference point rl). That is,
Pl↔ {clλ, λ ∈ [0, λ0]} , where clλis the level set
been represented as an element of the set C[0,λ0]. In our framework, the shapes of any two patches are compared by comparing their corresponding level curves. Given any two patches Pl1 and Pl2, and their level curves
{cl1
λ, λ ∈ [0, λ0]} and {clλ2, λ ∈ [0, λ0]}, respectively,
our idea is to compare the patches curves c1λ and c2λ, and to accumulate these differences over all λ. More formally, we define a distance dsgiven by:
ds(Pl1, Pl2) =
Z L
0
d(cl1
λ, clλ2)dλ . (2)
It has been shown in [5] that this distance is actually a proper distance between the elements of the C[0,λ0]. In addition to the distance ds(Pl1, Pl2), which is useful in
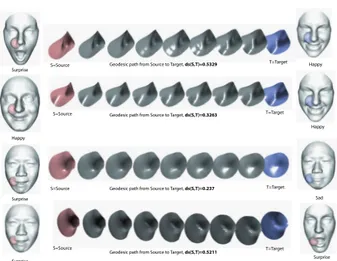
biometry and other classification experiments, we also have a geodesic path in C[0,λ0] between the two points represented by S1and S2. This geodesic corresponds to the optimal elastic deformations of facial curves and, thus, facial surfaces from one to other. Shown in Figure 2 are examples of such geodesic paths between given facial surfaces. For both sides of each geodesic path, the first surface is reconstructed from the set of 3D curves extracted from the patch indicated on the nearby face scan, between the two surfaces we illustrate the computed optimal elastic deformations. The top two rows correspond to geodesic paths that involve the same source, a person under a happy expression (right), and two different targets (left), the same person under a sur-prise state (first row) and a different person with happy expression (second row). We note that the geodesic dis-tance between the same face under different expressions is greater than the one that separates the two different persons conveying the same expression.
4
Experimentations and evaluations
In this section, we present preliminary results of our approach, and an evaluation of its performance on the Binghamton University 3D facial expression (BU-3DFE) database, created by Yin et. al. [3] for facial be-havior research. In the BU-3DFE there is 100 subjects, partitioned into two genders 56 females and 44 males, with variety of ethnicity and racial ancestries. Each sub-ject was asked, while capturing 3D data, to perform a neutral facial expression as well as the six prototypic facial expressions as categorized by most studies
Ek-man [1]. Each facial expression has 4 level of
intensi-ties low (01), middle (02), high (03) and highest (04), except for neutral faces which have only one intensity level (00). We conduct our experiments on 20 subjects, each one presents the 6 facial expressions (ha, an, di,
f e, su and sa) of the highest level (04). Then we extract
S=Source T=Target Surprise Geodesic path from Source to Target, ds(S,T)=0.5329 Happy
S=Source T=Target Happy Geodesic path from Source to Target, ds(S,T)=0.3263
Happy
Sad Surprise
S=Source Geodesic path from Source to Target, ds(S,T)=0.237 T=Target
S=Source T=Target Geodesic path from Source to Target, ds(S,T)=0.5211
Surprise Surprise
Figure 2. Illustration of some geodesic paths between patches.
patches centered on a finite number of feature points for each face. Based on the the hypothesis of symmet-ric property of the human face, we optimize our study by using only the feature points laying on half a face model (left part). The total number of the chosen fea-ture points is 24 as illustrated, with black points, in Fig-ure 3. After patches extraction, we compute a similarity
Hapiness Angry Sadness Surprise Fear Disgust
Figure 3. 24 Selected feature points for patch extraction.
matrix P with dimension 120 × 120, the data in P are arranged to form six submatrices of dimension 20 each. For the first submatrix we have in rows the 20 corre-sponding patches of the 20 chosen persons relative to a happy expression, in columns we have the same per-sons under all the prototypic expressions, we can fur-ther decompose the submatrix into six blocks; the first 20 columns represent the patches of the same persons, in the same order as in rows, and with the same
ex-pression, while the second 20 columns represent the an-gry expression, the third 20 ones represent disgust, and so on till the sad expression. We end up with a ma-trix M of dimension 120 × 120 × 24, where M (i, j, k) is the distance that separates between two patches be-longing to subjects i and j according to the same fea-ture k. Thus, this matrix contains ha vs. ha compar-isons, ha vs. ha comparcompar-isons, an vs. an comparcompar-isons,
an vs. an comparisons, and so on. This matrix
al-lows us to learn six binary classifiers for each classi-fication ha/ha, an/an, di/di, f e/f e, su/su, sa/sa. We employ two commonly used classification techniques, AdaBoost and SVM. Both algorithms take as input a set of training samples (x1, y1), .., (xN, yN) where each xi
(i = 1, ..., N ) is an sample that belongs to some do-main or instance space X, and each label yiis a boolean
value that belongs to the domain Y = {−1, +1}, indi-cating whether xn is positive or negative sample. In
our case we consider the submatrix Pha of dimension
20 to classify the happy vs. non-happy expression, we
label positively the block 20 and the rest is labelled negatively. Half of this submatrix is retained for train-ing (10)the classifiers while the other half is used for testing. The results of binary classification using Ad-aBoost, linear-SVM, Polynomial-SVM and Radial Ba-sis Functions RBF-SVM, are presented in Figure 4.
ha/non−ha an/non−an di/non−di fe/non−fe su/non−su sa/non−sa
80 81 82 83 84 85 86 87 88 89 90 91 92 93 94 95 96 97 98 99 100
Facial Expression Classes
R e cog nition Rate (%) AdaBoost SVM Linear kernel SVM Polynomial kernel SVM RBF kernel 94.67% 96.50% 97.00% 94.50% 97.83% 96.00%
Figure 4. Results of AdaBoost and SVM performances for facial expression clas-sification.
Although RBF-SVM gives better classification per-formances, the application of the AdaBoost algorithm enrich our face analysis in the way that it permits to identify most relevant patches for the expressions clas-sification. In Figure 3 we labelled the six expressions with different colors and we marked with the appropri-ate color, the feature points that are highly involved, ac-cording to the affected weight across the AdaBoost test set, in characterizing the deformation under a given ex-pression. The resulting average classification rates, us-ing the mentioned techniques, are summarized in Table
AdaBoost SVM-Linear SVM-Polynomial SVM-RBF
93.12% 89.03% 95.63% 96.08%
Table 1. Average classification rates.
1, the highest one is achieved with RBF-SVM rate equal to 96.08%.
5
Conclusion
In this paper we investigate the problem of 3D face analysis for person independent facial expression recog-nition. We propose a novel approach based on the mea-sure of inter-face expressional variations over multiple selected regions on the 3D face model. These curves-based representation is applied to to capture the de-formation between corespondent patches on different faces under different expressions. A quantification of this deformation in terms of distance (or length) of the geodesic paths is computed based on the Riemannian framework, these measures are then used as samples for AdaBoost and SVM binary classifiers. Since the proposed approach evaluate inter-class variations, it can be extended to perform identity recognition. As future work, we intend to enlarge our dataset to perform mul-ticlass facial expression recognition.
References
[1] P. Ekman, W. V. Friesen, and J. C. Hager. The Facial
Action Coding System (FACS): Manual. Palo Alto, CA:
Consulting Psychologists Press, 1978.
[2] J. Wang, L. Yin, X. Wei and Yi. Sun. 3D Facial
Ex-pression Recognition Based on Primitive Surface Feature Distribution. IEEE Conference on Computer Vision and
Pattern Recognition (CVPR). pp. 1399-1406, 2006. [3] L. Yin, X. Wei, Y. Sun, J. Wang and M. J. Rosato A
3D Facial Expression Database For Facial Behavior Re-search. 7th IEEE International Conference on Automatic
Face and Gesture Recognition (FG2006), pp.211-216. [4] H. Tang and T.S. Huang. 3D facial expression
recogni-tion based on automatically selected features. Computer
Vision and Pattern Recognition Workshops (CVPRW), pp. 1-8, June 2008.
[5] C. Samir, A. Srivastava, M. Daoudi and E. Klassen An
Intrinsic Framework for Analysis of Facial Surfaces.
In-ternational Journal of Computer Vision, vol. 82, no. 1, pp. 80-95, 2009.
[6] S. Joshi, E. Klassen, A. Srivastava and I. H. Jermyn.
A Novel Representation for Efficient Computation of Geodesics Between n-Dimensional Curves. IEEE