UNIVERSITÉ DE MONTRÉAL
MICROSCOPIC STUDIES OF NEUROVASCULAR COUPLING DURING EPILEPSY IN THE MOUSE BRAIN
CONG ZHANG
INSTITUT DE GÉNIE BIOMÉDICAL ÉCOLE POLYTECHNIQUE DE MONTRÉAL
THÈSE PRÉSENTÉE EN VUE DE L’OBTENTION DU DIPLÔME DE PHILOSOPHIAE DOCTOR
(GÉNIE BIOMÉDICAL) DÉCEMBRE 2016
UNIVERSITÉ DE MONTRÉAL
ÉCOLE POLYTECHNIQUE DE MONTRÉAL
Cette thèse intitulée:
MICROSCOPIC STUDIES OF NEUROVASCULAR COUPLING DURING EPILEPSY IN THE MOUSE BRAIN
présentée par : ZHANG Cong
en vue de l’obtention du diplôme de : Philosophiae Doctor a été dûment acceptée par le jury d’examen constitué de : M. LEBLOND Frédéric, Ph. D., président
M. LESAGE Frédéric, Ph. D., membre et directeur de recherche M. STIKOV Nikola, Ph. D., membre
DEDICATION
ACKNOWLEDGEMENTS
First and for most I would like to express my thanks to my supervisor, Professor Frédéric Lesage, for giving me this wonderful opportunity as a Ph. D. student in his research group, and mostly for his careful guidance, administration, and support through my entire Ph. D. study. A talk with Prof. Lesage is always inspiring and enjoyable, thanks to his profound knowledge in optical brain imaging, as well as his great patience at all times. His confidence and immense knowledge in my work and prompt corrections contributed enormously to finish this thesis.
I would like to sincerely thank Dr. Philippe Pouliot, who instructed me from time to time as if I were his own student. From the talk with him, I gained much knowledge about the analyzing data. I also would like to thank all staffs from the Montreal Heart Institute animal facility, in particular Marc-Antoine Gillis and Natacha Duquette, whose assistance in animal preparation, animal monitoring and animal administration undoubtedly promoted my research.
I am also grateful to thank coauthors of my three papers, Maryam Tabatabaei, Hélène Girouard and Mohammad Moeini, who spent quite a lot of their time to discuss my research. I would like to thank Samuel Bélanger for his suggestions to improve the quality of the French text in this thesis and for useful discussion on my research. I thank all past and current members of the laboratory of molecular and optical imaging at Polytechnique of Montreal who shared many pleasant moments and supplied much help through my studies: Clément Bonnéry, Michèle Desjardins, Baoqiang Li, Edgar Guevara, Mahnoush Amiri, Maxime Abran, Alexandre Castonguay, Hanieh Mohammadi, Joël Lefebvre, Parikshat Sirpal, Yuankang Lv, Ghada Jerbi, Xuecong Lv, Maryam Tabatabaei, Pier-Luc Tardif, Luis Akakpo, Azadeh Naderian.
Next, it was very grateful to know kind friends in Montreal, with whom I took many of our holidays and week-ends to find new and interesting aspects in here. This provided a lot of fun in my studies.
In the end, I gratefully acknowledge the China Scholarship Council (CSC) that supplied a scholarship from the “Chinese government graduate student overseas study program”, and my supervisor for providing me with financial support through my doctorate. I would like to express my endless thankfulness to my parents and my family, who left everything behind to accompany
me on this work; without their encouragement and support this work would not have been finished at all.
RÉSUMÉ
Les mécanismes liant l’activité neuronale au changement local du flot sanguin sont regroupés dans un ensemble nommé couplage neurovasculaire. Ce lien neurovasculaire, qui est à la base de plusieurs principes d’imagerie fonctionnelle du cerveau, est altéré par l’épilepsie. Ces dernières années, des techniques d’imagerie tel l’IRMf, IOS et la NIRS ont été utilisées pour l’étude de cette maladie, montrant une forte corrélation entre l’activité épileptique et le signal mesuré. Par contre, la plupart de ces travaux se sont concentrés sur les changements d’hémoglobine, qui peuvent être liés à des phénomènes non-linéaires et qui ne renseignent pas directement sur la quantification de l’oxygène délivré localement. Le but de cette thèse est d’investiguer l’utilisation de la microscopie avec de nouvelles sondes moléculaires permettant l’imagerie de l’oxygénation des tissus durant les évènements épileptiques dans le cortex sensori-moteur de la souris.
Dans un premier temps, une méthode de mesure de la pression partielle d’oxygène (PO2) en
microscopie confocale du temps de vie de phosphorescence fut développée. Ce système permet une mesure minimalement invasive du PO2 dans les tissus corticaux à haute fréquences spatiale et
temporelle lorsqu’il est utilisé conjointement avec la sonde phosphorescente OxyphorG4. Les mesures réalisées durant les crises épileptiques, induites avec l’agent 4-aminopyridine (4-AP), montrent des changements significatifs de l’oxygénation tissulaire. De plus, la distribution spatio-temporelle de la chute initiale de la réserve en oxygène, à proximité du point d’injection et le long des artérioles, a été caractérisé durant ces mêmes épisodes épileptiques. Une corrélation positive entre la variation du PO2 durant cette première phase et la durée de la crise épileptique a
aussi été mesurée. Cette mesure pourrait s’avérer utile dans la localisation des foyers épileptique et dans la prédiction de la durée des crises.
La deuxième étude présentée dans cette thèse se concentre sur le possible rôle joué par les astrocytes, qui sont un des acteurs importants dans le couplage neurovasculaire, dans la propagation des crises épileptiques. La concentration en ions calciques libres à la base axonale des astrocytes, conjointement avec le diamètre des artérioles adjacentes a été mesuré in-vivo en simultané sur des souris durant les épisodes épileptiques. Pour la mesure du calcium, la sonde fluorescente OregonGreen BAPTA-1 AM (OGB-1) a été utilisée en imagerie du temps de demie-vie de fluorescence avec un microscope 2-photons. Les résultats montrent que l’augmentation de calcium induirait une vasodilatation à chaque ictus dans la région du foyer épileptique. Dans les
régions plus éloignées, cette même mesure corrèlerait plutôt avec une vasoconstriction dans les premiers moments de la crise, suivi par une vasodilatation selon la durée de l’épisode. De plus, une augmentation lente du niveau absolu de la concentration calcique a été observé lors de longues séquences d’évènements. Cette tendance à la hausse semble induire à son tour une constriction des artérioles dans les régions adjacentes. Ces observations confirment le rôle des astrocytes dans le contrôle local de la microcirculation et suggèrent un second rôle de modulation du niveau de la concentration calcique autour de leur base axonale.
Puisqu’il n’a pas été possible de mesurer le PO2 en profondeur dans le cerveau ou de pouvoir
imager adéquatement les réseaux de capillaires en microscopie confocale, et suivant le développement d’une sonde sensible aux ions d’oxygène en microscopie 2-photons, il a donc été possible, dans le cadre de la dernière étude de cette thèse, d’acquérir cette mesure en profondeur durant des épisodes épileptiques. Des changements significatifs du PO2 dans les tissus et les
vaisseaux ont pu être observés. La distribution spatiale de la chute initiale de ce paramètre autour des artérioles, des capillaires, des veinules et du tissu près du foyer a pu être caractérisée. Les résultats obtenus pourraient avoir des implications profondes dans notre compréhension des mécanismes de livraison de l’oxygène dans les tissus en profondeur et leur capacité à supporter le cortex adéquatement dans les situations pathologiques. Le potentiel de la microscopie dans l’étude du couplage neurovasculaire et des changements liés à des pathologies a pu être pleinement démontré par les travaux de cette thèse.
ABSTRACT
Neurovascular coupling (NVC) is the mechanism that links a transient neural activity to the corresponding increase of cerebral blood flow (CBF). It underlies the local increase in blood flow during neural activity, forms the basis of functional brain imaging and is altered in epilepsy. For the last decades, functional imaging using BOLD fMRI, IOS and fNIRS and others have been applied to epilepsy, and yielded good correlation between epileptic activity and the measured signal. However, most previous work on epilepsy focused on the measurement of hemoglobin changes which sometimes leads to non-linear phenomena and does not quantify oxygen delivery in tissue. The aim of this thesis is to study oxygen delivery using microscopy with new oxygen sensitive molecular probes during epileptic events in the mouse somatosensory cortex.
First, a confocal phosphorescence lifetime microscopy system for measuring brain oxygen partial pressure (PO2) was developed. This system enabled minimally invasive measurements of oxygen
partial pressure in cerebral tissue with high spatial and temporal resolution using a dendritic phosphorescent probe, Oxyphor G4. Significant changes of PO2 in tissue were found at the
epileptic focus and in remote areas during 4-aminopyridine (4-AP) induced epilepsy. The spatio-temporal distribution of the “initial dip” in PO2 near the injection site and along nearby arterioles
was characterized by investigating epileptic events. A positive correlation between the percent change in the PO2 signal during the “initial dip” and the duration of seizure-like activity was
revealed in this work, which may help localize the epileptic focus and predict the length of seizures. Because astrocytic calcium signalling is involved in neurovascular coupling, the second study investigated the role of this pathway in epilepsy. The free calcium concentration in astrocytic endfeet and diameter of adjacent arterioles were simultaneously monitored with the calcium-sensitive indicator OGB-1 by two-photon fluorescence lifetime measurements following 4-AP injection. Our results revealed that, increases in calcium concentration induced vasodilation for each ictal event in the focus. In the remote area, increases in calcium concentration correlated with vasoconstriction at the onset of seizure and vasodilation during the later part of the seizures. Furthermore, a slow increase in absolute calcium concentration following multiple seizures was observed, which in turn, caused a trend of arteriolar constriction both at the epileptic focus and remote areas. These observations confirmed the role of astrocytes in the control of local microcirculation and suggest a modulating role for baseline absolute calcium concentration in
astrocytic endfeet. Since the confocal phosphorescence microscopy system was not able to measure PO2 deep in the cortex or resolve capillaries, two-photon phosphorescence microscopy
was then used in the last project to study the PO2 delivery during epilepsy in deep tissue and
vessels. Significant changes of PO2 in tissue and vasculature were observed during epileptic
events. The spatial landscape of “initial dip” in PO2 signals around arterioles, veins and tissue
near the injection site was characterized. These results may have profound implications for evaluating microvascular oxygen delivery capacity to support cerebral tissue in disease. The results of this thesis confirmed the potential of using microscopy to study neurovascular coupling during epilepsy.
TABLE OF CONTENTS
DEDICATION ... III ACKNOWLEDGEMENTS ... IV RÉSUMÉ ... VI ABSTRACT ... VIII TABLE OF CONTENTS ... X LIST OF TABLES ... XVLIST OF FIGURES ... XVI
LIST OF SYMBOLS AND ABBREVIATIONS ... XXI
CHAPTER 1 INTRODUCTION ... 1
1.1 Overview ... 1
1.2 Epilepsy ... 2
1.3 Organization of the thesis by objectives ... 3
CHAPTER 2 LITERATURE REVIEW ... 5
2.1 Brief literature review ... 5
2.1.1 Neurovascular coupling in the brain during normal cortical processing and epilepsy 6 2.2 Review of observations from functional neuroimaging during epilepsy ... 8
2.2.1 Single-photon emission computed tomography (SPECT) ... 8
2.2.2 Positron emission tomography (PET) ... 10
2.2.3 Combined EEG-fMRI ... 11
2.2.4 Functional near-infrared spectroscopy (fNIRS) ... 12
2.2.5 Optical imaging of intrinsic signals ... 14
2.2.6 Confocal and two-photon microscopy ... 15
CHAPTER 3 THEORY AND METHODOLOGY ... 19
3.1 Confocal microscopy ... 19
3.1.1 Principle and application of confocal microscopy ... 19
3.2 Oxygen dependent phosphorescence imaging ... 21
3.2.1 Principle of oxygen dependent phosphorescence imaging ... 21
3.2.2 Phosphors for measuring oxygen by oxygen-dependent quenching of phosphorescence ... 22
3.2.3 Principle of the calibration for phosphors ... 23
3.2.4 Overview of the confocal phosphorescence lifetime microscopy system and experiment ... 24
3.2.5 Characterization of confocal phosphorescence lifetime microscopy ... 26
3.3 Two-photon microscopy ... 28
3.3.1 Principle of two-photon excitation microscopy ... 28
3.3.2 Application of two-photon excitation microscopy ... 30
3.4 Krogh-Erlang Model for oxygen diffusion in tissue ... 31
CHAPTER 4 ARTICLE 1: MEASUREMENT OF LOCAL PARTIAL PRESSURE OF OXYGEN IN THE BRAIN TISSUE UNDER NORMOXIA AND EPILEPSY WITH PHOSPHORESCENCE LIFETIME MICROSCOPY ... 33
4.1 Abstract ... 33
4.2 Introduction ... 34
4.3 Materials and Methods ... 35
4.3.1 Principle of phosphorescence quenching imaging ... 35
4.3.2 Phosphorescent probe Oxyphor G4 ... 36
4.3.3 Animal preparation ... 37
4.3.5 Normal and variable FiO2 experiments ... 41
4.3.6 PO2 values and LFP data analysis in 4-AP injected mice ... 41
4.4 Results ... 41
4.4.1 PO2 in normoxia and during variable FiO2 ... 41
4.4.2 Tissue oxygenation at the focus and in the surrounding area during seizure-like activity ... 44
4.4.3 Correlation between the percent of initial dip and distance from the artery ... 46
4.4.4 Correlation between initial dip and seizure duration ... 47
4.5 Discussion ... 48
4.5.1 Tissue PO2 gradient near arteries in normoxia ... 48
4.5.2 Acute seizure activity leads to transient dip of PO2 near epileptic focus ... 49
4.5.3 The relationship between the initial dip and distance from arterioles ... 49
4.5.4 The relationship between initial dip and seizure duration ... 50
4.5.5 Limitation ... 50
4.6 Conclusion ... 51
4.7 Acknowledgments ... 51
4.8 References ... 52
CHAPTER 5 ARTICLE 2: ASTROCYTIC ENDFOOT CA2+ MODULATES ARTERIOLAR RESPONSES DURING EPILEPSY: AN IN VIVO TWO-PHOTON LIFETIME MICROSCOPY STUDY ... 57
5.1 Abstract ... 57
5.2 Introduction ... 58
5.3 Materials and Methods ... 60
5.3.1 Animal preparation ... 60
5.3.3 Epileptogenesis and electrophysiology ... 61
5.3.4 Two-Photon fluorescence lifetime setup ... 63
5.3.5 Fluorescence lifetime calibration ... 63
5.3.6 Data analysis ... 64
5.4 Results ... 64
5.4.1 Diameter changes in the epileptic focus and remote areas during the seizure-like activity ... 65
5.4.2 Astrocytic endfoot baseline Ca2+ determines the level of arterial response during seizures ... 67
5.4.3 Astrocytic endfoot baseline Ca2+ determines the level of arteriole constriction first then of dilation with seizures in remote areas ... 70
5.5 Discussion ... 72
5.5.1 Center-surround phenomena during acute seizure activity ... 73
5.5.2 The relationship between calcium and diameter ... 73
5.5.3 Non-linear hemodynamic responses to seizures ... 74
5.6 Conclusion ... 74
5.7 Acknowledgements ... 75
5.8 Declaration of conflicting interests ... 75
5.9 Reference ... 75
CHAPTER 6 ARTICLE 3: SPATIAL LANDSCAPE OF OXYGEN IN AND AROUND MICROVASCULATURE DURING EPILEPTIC EVENTS ... 80
6.1 Abstract ... 80
6.2 Introduction ... 81
6.3 Materials and Methods ... 82
6.3.2 Epileptogenesis and electriohysiology ... 83
6.3.3 Two-photon microscopy setup, acquisition and processing ... 83
6.3.4 Simulation of oxygen diffusion in tissue using a Krogh-Erlang Model ... 84
6.4 Results ... 84
6.4.1 PO2 changes in tissue at the epileptic focus during seizure-like activity ... 84
6.4.2 Epileptic seizures induced PO2 response in vasculature at the epileptic focus ... 87
6.5 Discussion ... 87
6.5.1 The relationship between the initial dip and distance from arterioles ... 88
6.5.2 The relationship between the initial dip and diameter of arteries and veins ... 88
6.6 Conclusion ... 89
6.7 Acknowledgments ... 89
6.8 References ... 89
CHAPTER 7 GENERAL DISCUSSION ... 92
7.1 Objective 1 ... 92
7.2 Objective 2 ... 93
7.3 Objective 3 ... 94
CHAPTER 8 CONCLUSION ... 96
LIST OF TABLES
LIST OF FIGURES
Figure 2-1: Physiological signal detected with classical functional neuroimaging techniques
(Huneau et al., 2015). ... 7
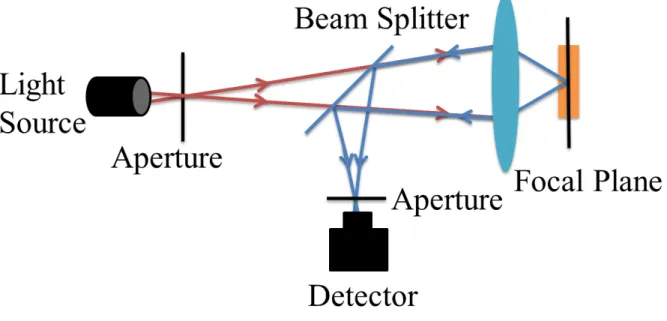
Figure 3-1: The principle of confocal microscopy. ... 20
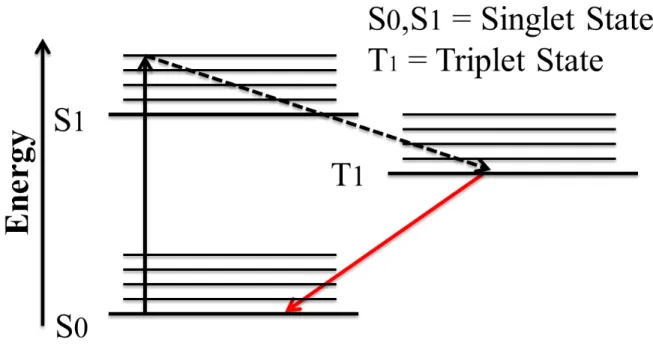
Figure 3-2: Simplified Jablonski energy diagram of phosphorescence progress ... 22
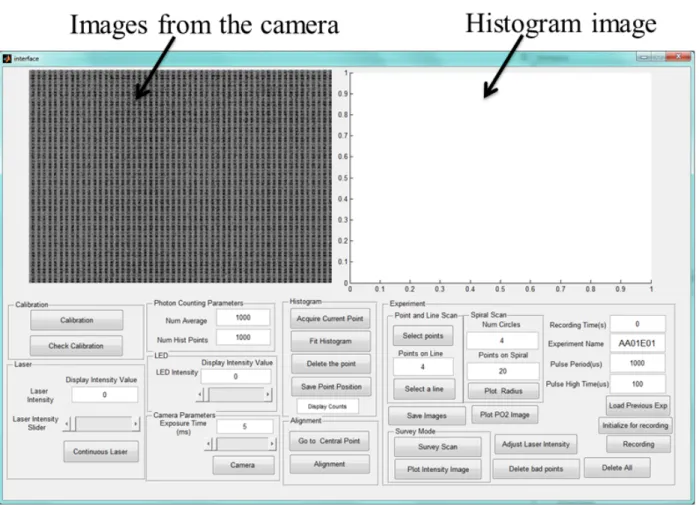
Figure 3-3: The interface of the confocal phosphorescence microscopy system ... 25
Figure 3-4: Overview of the confocal phosphorescence microscopy system. ... 26
Figure 3-5: Simplified Jablonski diagram of one-photon excitation (a) and two-photon excitation (b) (So et al., 2000). ... 29
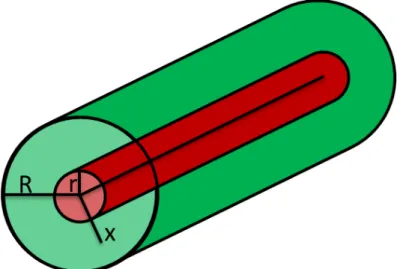
Figure 3-6: Sketch of the Krogh cylinder model where the blood vessel (radius r) provides oxygen with a tissue cylinder (radius R) by diffusion. ... 32
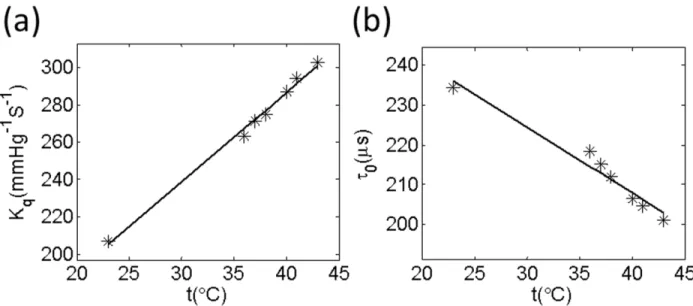
Figure 4-1: Temperature dependencies of oxygen quenching constants (Kq) and lifetimes (τ0) for G4 (a and b). The measurements were performed using 50 µM solutions of the probes, pH 7.23. ... 37
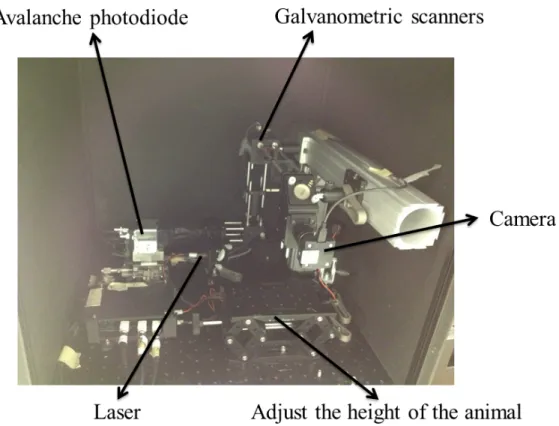
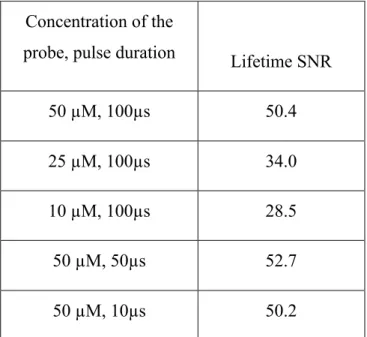
Figure 4-2: (a) Schematic of the confocal lifetime imaging system. Excitation light is provided by a laser diode (λ=637nm, 170 mW maximum power, which is collimated by a convex lens (L1) and travels through the objective for illumination. It is focused onto the cranial window by a 10×magnification objective (Obj), which is directed to the specific points using galvanometric scanners (xy). Emitted phosphorescence light is separated from excitation light using a beam splitter (BS2) and filter (F) and detected with an avalanche photodiode (APD). The system is controlled by a computer through a data acquisition card (DAQ). (b) In vivo measurements of PO2 vs mean counts per millisecond as controlled by the diode laser power. Higher laser powers correlate with higher consumption of O2 leading to a significant decrease of PO2 estimates over time (seen in the first point when average counts exceed 10000). When limiting to 3000 average counts, no significant decrease in PO2 could be measured over time. (c) Example of phosphorescence decay profiles under conditions where photo-consumption is negligible. Higher O2 concentration causes more quenching of phosphorescence signal, and consequently a faster decay (red profile). ... 39
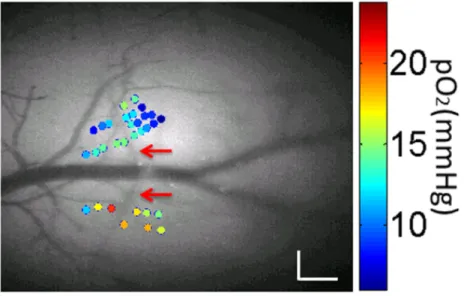
Figure 4-3: Measured PO2 values during normoxia (color dots), overlaid with a grayscale
angiogram of cortical pial tissue from an exposed window (with an artery shown by the red arrows) The size of scale bar is 0.2mm. ... 42
Figure 4-4: (a) Grayscale angiogram of cortical pial tissue with points of interest (red dots). Scale bar size: 0.2mm (b) Corresponding temporal profiles of PO2 measured while altering FiO2.
The gray segments denote the 10 minutes period during which FiO2 was increased up to 40%. ... 43
Figure 4-5: Electrophysiology of 4-AP induced epileptic activity. Top: example of ictal discharges after the 4-AP injection. Middle: zoom on an ictal discharge. Bottom: expanded view of showing the onset of the discharge, the intermediate phase and the offset. ... 45
Figure 4-6: Obtained PO2 values in tissue near the focus and surround. (a) Grayscale angiogram
of cortical surface and locations for pO2 measurement (red: focus; blue: surround). The
artery was shown by the red arrows. Scale bar size: 0.2mm (b) Epileptic activity induced a transient dip in tissue PO2 followed by an increase in PO2 in the focus. A sustained increase
in PO2 was seen in the surround. The dashed vertical lines show the ictal onset (left) and
offset (right). (c) Distribution of percent of initial dip at multiple locations (color dotted) during epileptic activity. The 4-AP injection site is shown by green circle. The artery was shown by the red arrows. Scale bar size: 0.2mm ... 45
Figure 4-7: Correlation between percent change of the initial dip at multiple locations and distances from an artery (a) Measured PO2 values of different points near an artery during
the epileptic seizure (color dots), overlaid with a grayscale anatomy (with an artery shown by the red arrows). Scale bar size: 0.2mm (b) Relationship between distance from an artery for multiple points and initial dip during one epileptic seizure. The line of linear fit is, R2 = 0.70. (C) Boxplots of slopes of linear fits in 3 mice over 25 seizures. ... 46
Figure 4-8: a) Correlation between initial dip (% change) and duration of epileptic activity. The line of linear fit was, R2=0.81 (b) Statistical distribution of the slopes for all mice. M1 was the name of mouse and number in the bracket was the number of seizures that was calculated. The outliers were plotted with red plus sign. The average of goodness of fit (R2) was listed for each mouse. ... 47
Figure 5-1: (A) Schematic of the two-photon lifetime microscopy system. Excitation light is provided by a MaiTai-BB laser oscillator (Mai Tai-BB) through an acousto-optic modulator (AOM) followed by a polarizer (P) to adjust the gain. A telescope (L1 and L2) expands the
galvo-mirrors image onto the microscope objective pupil for illumination. Emitted fluorescence is separated using a first dichroic mirror (DM1). The return beams are then split
by a second dichroic mirror (DM2) sending the signal to detectors centered at wavelengths of 520nm (F1) and 593nm (F2). The Ca2+ concentration was monitored in the 520nm channel
using a photon-counter for FLIM imaging. (B) In vivo fluorescence staining of neurons in green, astrocytes in yellow and vasculature in red. (C) Pictogram of measurement areas on the mouse brain. The craniotomy was done on the left side. The 4-AP injection location and electrode recordings were done at the same site. The remote area was defined to be that further than 1.5 mm from the focus. (D) Calibration of the fluorescence decay of OGB-1 at 10 different buffer Ca2+ concentrations. In this range, fit lifetime varied from ~4.86ns to ~0.65ns for high/low concentrations respectively. (E) Typical images at 593nm for longitudinal vessel scan, used to measure the diameter. The right figure shows measurements of absolute [Ca2+]
i in one astrocytic endfoot during resting state. ... 62
Figure 5-2: Paired t-test of [Ca2+]
i in astrocytic somata and endfeet during resting state. (A)
Boxplot of the average of [Ca2+]i in somata and endfeet in basal state. The [Ca2+]i in somata
was significantly larger than endfeet (p<0.001). (B) Boxplot of the standard deviation (SD) of [Ca2+]i in somata and endfeet during baseline over time. There was no difference in SD of
[Ca2+]i between the somata and endfeet. ... 65
Figure 5-3: Simultaneous measurements of absolute Ca2+ in astrocytic endfoot and diameter of adjacent arterioles during epileptic events in local (A) and remote (B) areas. The time course of LFP indicates seizure initiation (top of (A) and (B) panels). (A) Nearby the injection site, simultaneous measures of Ca2+ and diameter show that Ca2+ and diameter display a monophasic increase with ictal discharge. (B) In remote areas, arteriole constricted at the onset of ictal event, then dilated while Ca2+ remains elevated throughout seizures. ... 66
Figure 5-4: The relationship between [Ca2+]i in astrocytic endfoot and the arteriolar changes in
diameter during epileptic events in the focus ((A), (B) and (C)) and remote areas ((D), (E) and (F)). (A) Relationship between the relative [Ca2+]i (rCa2+) and relative changes in
diameter (rDiameter) during epileptic events at the focus over 8 seizures from one animal. Note that during ictal events, [Ca2+]i increases in the encasing astrocytic endfoot are
accompanied by arteriolar dilations. (B) Correlation between the absolute baseline [Ca2+]i
and relative changes in diameter in the focus (from 7 mice, 90 seizures). (C) Relationship between the relative [Ca2+]i and absolute [Ca2+]i at the focus (from 7 mice, 90 seizures). (D)
Relationship between the relative [Ca2+]i and relative changes in diameter during epileptic seizures in a remote area over two recording sessions (8 seizures) from one mouse. For each seizure, [Ca2+]i increased in the endfoot with arterioles constricting at the beginning of
seizures followed by dilation. (E) Correlation between the absolute [Ca2+]i and relative
diameter changes in remote areas (from 4 mice 58 seizures). (F) Relationship between the relative [Ca2+]i during seizures and absolute [Ca2+]i in remote areas (from 4 mice, 58
seizures). ... 68
Figure 5-5 Scatter plot illustrating the relationship between absolute [Ca2+]i in one astrocytic
endfoot and the arteriolar diameter. (A) Correlation between the absolute [Ca2+]i and
diameter during epileptic events in local area (over two recording sessions, 8 seizures from one animal). The linear fit is: y = -0.004x + 1.70, R2 = 0.13. (B) Correlation between the
absolute [Ca2+]
i and relative diameter change during epileptic seizures in remote areas (over
two sessions (8 seizures) from one animal). The linear fit for undershoot is: y = -0.004x + 1.241, R2 = 0.22 while for the overshoot: y = -0.005x + 1.676, R2 = 0.35. (C) The relationship between the absolute [Ca2+]i and median of diameter over all measurements.
The Spearman correlation coefficient is R=0.09. ... 69
Figure 5-6: Relationship between absolute [Ca2+]i in the astrocytic endfeet and arteriole diameter
over all mice (7 mice). (A) Paired t- test of the average and SD of [Ca2+]i values during
baseline and epileptic seizures for all mice. The average [Ca2+]i during ictal discharges was
higher than baseline (p<0.001). The SD of [Ca2+]i did not significantly vary between the
seizure and basal level. (B) Paired t-test of the average and SD of diameter in all mice. The mean diameter had a significant increase with ictal events (p<0.001) and there were no significant differences in the SD of diameter between seizures and baseline. (C) Bar plots of the slopes of linear fits (as shown in Figure 5-4A and Figure 5-4B) in 21 astrocytes of 7 mice over 90 seizures. Slopes were significantly negative (both for basal (p=0.05) and for seizures (p=0.006), one sample t-test). ... 70
Figure 5-7: Relationship between absolute [Ca2+]i in the astrocytic endfoot and diameter in
arteriole over all mice (4 mice) in the remote area. (A) Paired t- test of the average and SD of absolute [Ca2+]i values during undershoot or overshoot and baseline for all mice. The
average of [Ca2+]i during the beginning of seizure and the duration of seizure was higher
than baseline (p=0.025 and p=0.028). The SD of [Ca2+]i did not significantly vary between
the undershoot or overshoot and basal level. (B) Paired t-test of the average and SD of the percent change of diameter in all mice. The mean diameter had a significant decrease during the beginning of seizure (p=0.001) and the average of diameter during the duration of seizure was higher than the baseline (p =0.038). There were no significant differences in the SD of diameter between undershoot or overshoot and baseline. (C) Bar plots of slopes of linear fits between relative diameter changes and absolute [Ca2+]i (as shown in Figure 5-5D)
in 13 astrocytes of 4 mice over 58 seizures. Slopes were negative (For basal, p=0.014, for seizure, p=0.009, one sample t-test). ... 71
Figure 6-1: Representative changes in oxygen partial pressure (PO2) in tissue (A) and artery (B),
in response to epileptic events in a local area. Grayscale angiogram of cortical pial tissue with points of interest (with arteries shown by the red arrows, a vein shown by the blue arrow and a typical PO2 time course shown for the blue points, top of (A) and (B) panels).
The time course of LFPs indicates seizure initiation. (A) Epileptic activity induced a transient dip in tissue PO2 followed by an increase in PO2 at the focus. (B) In the artery, the
PO2 profile was also biphasic with an early dip followed by an increase. ... 85
Figure 6-2 : (A) Changes in the amplitude of the percent initial dip around small and large arterioles, as a function of the perpendicular distance. The solid line and dashed line show simulated results with small and large arterioles separately. Error bars represent standard error of the mean (SEM). (B) Timing of the dip extrema as a function of arteriolar size and perpendicular distance with simulated results. (C) Percent change of the initial dip in arteries and veins in response to seizure-like activity, grouped by vessel diameter, with corresponding standard error reported. (D) The undershoot-minima time in arteries and veins, grouped by vessel diameter, with corresponding SEM. ... 86
LIST OF SYMBOLS AND ABBREVIATIONS
CBF Cerebral blood flow
fMRI Functional magnetic resonance imaging
PET Position emission tomography
BOLD Blood oxygenation level dependent CMRO2 Cerebral metabolic rate of oxygen
IOI Intrinsic optical imaging
PO2 Partial oxygen pressure
MRI Magnetic resonance imaging
IOZ Ictal onset zone
IISs Interictal spikes
SPECT Single-photon-emission computer emission tomography
NVC Neurovascular coupling
CBV Cerebral blood volume
NADH Nicotinamide adenine dinucleotide rCBF Regional cerebral blood flow
[99mTc]-HMPAO Tc-99m Hexamethyl-propylene Amine Oxime [99mTC]-ECD Tc-99m Ethyl Cysteinate Dimer
EEG Electroencephalography
18F-FDG Fluorine-18 fluorodeoxyglucose
TLE Temporal lobe epilepsy
SISCOM Subtraction ictal SPECT coregistered to MRI IGE Idiopathic generalized epilepsy
fNIRS Functional near-infrared spectroscopy
HbO Oxygenated hemoglobin
HbR Deoxygenated hemoglobin HbT Total hemoglobin SO2 Saturation of oxygen CW Continuous wave TD Time domain FD Frequent domain
OIIS Optical imaging of intrinsic signal IOS Intrinsic optical signal
CCD Charge-coupled device
SNR Signal to noise ratio
TPM Two-photon microscopy
DAQ Data acquisition
APD Avalanche photodiode
4-AP 4-Aminopyridine
FiO2 Fraction of inspired oxygen
SE Standard error
LFP Local field potential
FLIM Fluorescence lifetime imaging
OGB-1 Oregon Green 488 BATPA-1
[Ca2+]i Calcium concentration
Ca2+ Calcium
EETs Epoxyeicosatrienoic acids 20-HETE 20-hydroxyeicosatetraenoic
VPR Volume-pressure recording
PMT Photomultiplier tube
AODs Acousto-optic deflectors
MEG Magnetoencephalography
HR-EEG High-resolution electroencephalogram
CHAPTER 1
INTRODUCTION
1.1 Overview
While neuron functioning consumes energy, the brain itself does not keep a reserve of energy substrates such as glucose or oxygen (Lecrux and Hamel, 2011). Instead, it relies on a constant supply of blood flow to provide these substrates, particularly during neural hyperactivity (Siesjö and Plum, 1971), and to remove metabolites, e.g. lactic acid. There is a tight coupling between the cerebral blood flow (CBF) and neural activity (Lecrux and Hamel, 2011). In the cortex, the adequate supply of blood during neural activation is ensured by the complex interactions among neurons, astrocytes and microvessels (Hamel, 2006). This mechanism is the basis of neuroimaging techniques that infer neural activity from the observation of the associated vascular responses, for example, variations in local blood volume or blood oxygenation levels. Currently there are various imaging techniques that indirectly record metabolic changes of neural activity in the central nervous system. In functional neuroimaging, participants are often asked to perform a task (e.g. finger-tapping) while their neural activity is measured non-invasively. Since the difference in neural activity between the task period and the resting period is believed to reflect the mental capacities of the subjects, the imaging of brain function can be used to observe human psychological state (Kosslyn, 1999).
Human functional brain imaging techniques play a prominent role in neuroscience and physiological research nowadays. From the 1990s, functional magnetic resonance imaging (fMRI) has been used to detect blood-oxygenation-level-dependent (BOLD) signals associated with neuronal activity, based on the different paramagnetic properties of oxygenated and deoxygenated hemoglobin (Ogawa et al., 1990a).Using a surrogate marker of oxygen, positron emission tomography (PET) is another method that has been widely applied in brain imaging. With the application of these techniques, researchers invested substantial effort in improving our understanding of neuronal activity and brain functioning.
The neurovascular coupling describes the relationship between neural activity and triggered hemodynamic changes (i.e. cerebral blood volume (CBV), oxygenation levels, and cerebral blood flow (CBF)), which are measurable with neuroimaging techniques. Important insights have been obtained by using animal models, in which researchers can use functional brain imaging and/or
neuronal and hemodynamic events to specifically underpin them (Berwick et al., 2005; Boorman et al., 2010; Mathiesen et al., 2000; Vazquez et al., 2012). Using animal models enables the exploration of neuroimaging signal changes of each component in the complex brain system. With such models, the general validity of BOLD signal changes obtained from fMRI as indicators of varied neuronal activity has been established: increased neuronal activity in healthy cortical structures is reflected by increases in BOLD signals in those structures (Logothetis et al., 2001). However, the generalizability of this broad statement is becoming increasing important with brain studies now performed in both health and disease models.
1.2 Epilepsy
Epilepsy represents a chronic neurological disordered state that is characterized by recurrent, spontaneous seizures. Unlike normal neural processing, epileptic seizures consist of abnormal, excessive neuronal discharges, and therefore require supernormal energy to meet the demand of increased neural activity (Folbergrová et al., 1981; Zhao et al., 2009). Therefore, the neurovascular coupling in the normal brain processing state may not be applied to epileptic conditions. Between these ictal events (i.e. seizures), brief short-duration events may occur, and are thus called interictal spikes (de Curtis and Avanzini, 2001). Previous work studying neurovascular coupling in epilepsy has presented contradictory results both in humans and animals, using neuroimaging techniques such as PET, fMRI and intrinsic optical imaging (IOI). For example, although a local increase in blood perfusion associated with ictal events is generally observed in those studies, some showed that the increase in blood perfusion oversupplied the consumption of oxygen due to increased metabolism (Bénar et al., 2002; Lemieux et al., 2001; Nersesyan et al., 2004; Tenney et al., 2004), while other studies discovered the opposite, i.e. the blood hyperperfusion was inadequate to compensate for the oxygen loss(Ingvar, 1986; Kreisman et al., 1991; Tanaka et al., 1990). Therefore, the explicit relationship between oxygenation and perfusion during epileptiform events remains elusive. Given that perfusion is necessary for oxygen delivery and that brain tissue might be damaged in hypoxic conditions, understanding potential un-couplings in epilepsy is essential.
The goal of this thesis is to study the neurovascular coupling during epilepsy using novel optical imaging techniques such as two-photon fluorescence lifetime microscopy and confocal phosphorescence microscopy. Phosphorescence lifetime imaging provides a measurement of the
partial oxygen pressure (PO2) in tissue and vessels, which leads to estimations of oxygen
metabolism and therefore is considered to be more directly related to neural activity than hemoglobin concentration (Brieu et al., 2010). The recent emergence of this technique in two-photon microscopy allows for direct measures of the oxygen in three-dimension with sufficient temporal and spatial resolution, providing access to deeper layers of the brain (Sakadzić et al., 2010).
1.3 Organization of the thesis by objectives
Three objectives were defined in this thesis and each is associated with different hypotheses. Objective #1: Develop a confocal phosphorescence lifetime microscopy system and use the system to investigate the change of PO2 during epileptic events in the mouse brain in conjunction
with a dendritic phosphorescence molecular probe, Oxyphor G4.
Hypothesis #1-1: The confocal microscopy system in conjunction with Oxyphor G4 can provide a measurement of PO2 in-vivo in mice.
Hypothesis #1-2: The PO2 changes associated with epileptic events can be reliably monitored in
the mouse brain with the confocal phosphorescence lifetime microscopy system. The article that addressed this objective is:
Article 1: Cong Zhang, Samuel Bélanger, Philippe Pouliot and Frédéric Lesage, “Measurement of local partial pressure of oxygen in the brain tissue under normoxia and epilepsy with phosphorescence lifetime microscopy,” PLOS One, 10, e0135536. doi:10.1371/journal.pone.0135536 (Aug 25, 2015).
Objective #2: Simultaneously monitor the changes of absolute calcium signals in astrocytic endfeet and diameter changes of encased arterioles with two-photon microscopy during seizures in the mouse brain.
Hypothesis #2-1: The two-photon microscopy system and specific scanning techniques can be used to simultaneously measure the absolute calcium signal in astrocytic endfeet and arteriolar diameter.
Hypothesis #2-2: The calcium signal in astrocytic endfeet and arteriolar diameter correlate during epileptic seizures in the mouse brain.
Article 2: Cong Zhang, Maryam Tabatabaei, Samuel Bélanger, Hélène Girouard and Frédéric Lesage, “Astrocytic endfoot Ca2+ modulates arteriolar responses during epilepsy: an in vivo two-photon lifetime microscopy study” was submitted to the journal of Cerebral Blood Flow & metabolism and is in revision.
Objective #3: Measure the PO2 changes in tissue near arterioles and in cerebral vasculature in
microdomains during epileptic seizures in mouse brain with a two-photon phosphorescence microscopy system.
Hypothesis #3-1: Using two-photon phosphorescence microscopy, PO2 changes can be measured
in 3D with an oxygen-sensitive dye (PtP-C343).
Hypothesis #3-2: The PO2 changes in tissue are different around various size arterioles during
epileptic events in the mouse brain.
Hypothesis #3-3: The PO2 changes in vessels correlate with their size during epileptic seizures in
the mouse cortex.
Article 3: Cong Zhang, Mohammad Moeini and Frédéric Lesage, “Spatial landscape of oxygen in and around microvasculature during epileptic events” Neurophotonics 4, 010501-010501. doi:10.1117/1.NPh.4.1.010501
This thesis is organized as follows. The second chapter gives a brief literature review of various techniques used in neurovascular coupling studies. The third chapter describes a basic theory of confocal phosphorescence lifetime system and two-photon microscopy. From the fourth chapter to the sixth chapter, three published papers are fully included to address the three objectives above. In the seventh chapter, a discussion of the advantages as well as limitations of the proposed methods is provided. Finally, the thesis is concluded in the eighth chapter.
CHAPTER 2
LITERATURE REVIEW
2.1 Brief literature review
Epilepsy is a most common human neurological disorder, impacting 1.2% of the word population (Hauser et al., 1991). The pharmacological treatment of epilepsy with one or several drugs achieves effective seizure control in 60-70% of the cases (Callaghan et al., 2007). The treatment of the remaining drug-resistant epilepsy cases relies upon identifying and surgically removing the epileptogenic zone. For example in temporal lobe epilepsy (TLE), surgically removing the epileptogenic zone was reported to lead to seizure freedom up to 70-80% of the patients (Engel, 2003, 1993). In another study, neocortical resections yielded a successful treatment rate of 25% ~ 40% (Rasmussen, 1991). There are several factors that may affect the outcome of surgical treatment in nonlesional neocortical epilepsy, most importantly, an accurate localization of the epileptic focus area. It is usually more difficult and variable to localize the epileptic region in neocortical epilepsy. Hardware and sequences in magnetic resonance imaging (MRI) have been improved, however, MRI remains unable to reveal the focus localization in up to 50% of drug-resistant patients with focal epilepsy (Berg et al., 2003; Bernasconi et al., 2011; McGonigal et al., 2007). For humans with longstanding seizures, there is an independent epileptogenic area in surrounding cortices (Berger et al., 1993; Cascino et al., 1994). Hence, in many patients, it is usually quite challenging to achieve an accurate localization of the epileptic region.
Traditional localization of the ictal onset zone (IOZ) in neocortical epilepsy requires a surgical intervention to implant electrodes directly onto the exposed surface of the cortex, a technique called electrocorticography (ECoG), which may put the patients under the risk of clinical complications such as bleeding or infection (Shariff et al., 2006). Therefore, it is extremely useful to exploit new methods that are able to localize epileptic region in a noninvasive manner, e,g, using single-photon-emission computed emission tomography (SPECT), PET or fMRI. These techniques monitor neural activity indirectly by measuring associated hemodynamic variations, i.e. changes in CBF, glucose metabolism or BOLD signals. Based on the current understanding of neurovascular coupling, these techniques have been used to localize the IOZ by observing the temporal and spatial changes of the hemodynamic signals during epileptic events. However, these techniques are not suitable to be used to study the neurovascular coupling during epilepsy at a
more fundamental level, due to the limited temporal or spatial resolution Here we provide a review of the current understanding of neurovascular coupling during normal cortical processing and epilepsy, as well as the previous applications of the above described neuroimaging technique in the study of neurovascular coupling and EOZ localization in epilepsy.
2.1.1 Neurovascular coupling in the brain during normal cortical processing
and epilepsy
Elevated neural activity leads to increased energy consumption of neurons and astrocytes. The increased consumption of energy imposes extra demands on the supply of two energy substrates, oxygen and glucose, from blood flow. Previous investigations have shown that blood vessels could be controlled to match the need of blood flow delivery (Attwell and Laughlin, 2001; Iadecola and Nedergaard, 2007). As a response to transient neural activity, local vessels dilate, which leads to a substantial increase in CBF. This mechanism, termed functional hyperemia, has its origin in a complex mechanism involving different vasoactive agents (Attwell et al., 2010; Iadecola and Nedergaard, 2007).
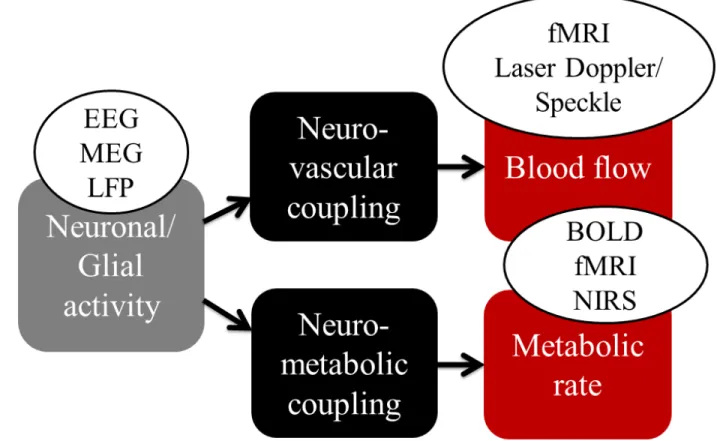
Neurovascular coupling (NVC) is the phenomenon describing the activation of neuron to the associated increase of CBF (Huneau et al., 2015). The study of the neurovascular coupling focuses on examining the relationships among neuronal activity, tissue oxygenation, blood oxygenation, blood flow and metabolism. It has been widely accepted that the cerebral metabolic rate of oxygen (CMRO2) increases simultaneously with increasing neuronal activity, which leads
to a subsequent increase in CBF and CBV to compensate the consumption of local oxygen (Roy and Sherrington, 1890). Several functional neuroimaging techniques rely on the NVC to infer cerebral functions. For example, the BOLD contrast measured by fMRI has been widely applied to study brain response to neural stimulations in human and animal (Buxton, 2013; Ogawa et al., 1990a). Near-infrared spectroscopy (NIRS) can also be applied to detect hemoglobin changes in blood following the neural activity (Strangman et al., 2002). These techniques are based on the concentration changes of oxygenated or deoxygenated hemoglobin, and therefore they can only provide an indirect measure of the functional hyperemia (Figure 2-1). On the other hand, optical techniques, such as laser Speckle or laser Doppler flowmetry are able to measure blood flow and velocity variations in superficial cortical layers with a depth up to ~500 µm in animal (Fukuda et al., 1995). Although there are still debates on the physiology mechanisms underlying local blood
flow and oxygenation variation in response to the focal neural activation, these optical imaging techniques have been widely accepted as useful tools to study brain functions (Attwell et al., 2010; Hillman, 2014).
Figure 2-1: Physiological signal detected with classical functional neuroimaging techniques (Huneau et al., 2015).
Unlike normal brain processing, epileptic seizures (i.e. the ictal events) consist of excessive neural activity which causes an enormous increase of the metabolic rate of oxygen (Sheth et al., 2004b). Therefore, the neurovascular coupling mechanism during normal brain functioning may not be applied to seizures. For example, there is a long-standing debate on whether or not the increase in CBF is enough to compensate the consumption of oxygen due to increased metabolism during epilepsy. Early studies proposed the hypoxia-hypoperfusion hypothesis where they assumed that tissue damage during epilepsy was a result of cerebral anoxia (Meldrum, 2002; Plum et al., 1968; Simon, 1985). However, later studies presented results that were discordant with this hypothesis e.g. these studies have shown that the relative increase in CBF was more than the relative increase in cerebral metabolism (Zhao et al., 2009); that the tissue damage
during epilepsy was not identical to hypoxia (Siesjö and Wieloch, 1986); that seizures might produce increases in venous oxygenation (Pinard et al., 1984; Plum et al., 1968); that seizures induced increases in tissue oxygen partial pressure (PO2) (Kreisman et al., 1984, 1983); that
tissue injury were caused in the absence of cerebral anoxia (Meldrum, 2002; Pinard et al., 1984); and that epileptic activity might be associated with oxidation in cytochrome oxidase, mitochondrial transport chain and nicotinamide adenine dinucleotide (NADH) (Jöbsis et al., 1971; Mayevsky and Chance, 1975). All these observations contributed to our current understanding of the neurovascular relationship in epilepsy, but they have been insufficient to make sense of the observations. In epilepsy, the supranormal demand on the brain modifies autoregulatory mechanisms leading to various confounding factors, e.g. the abnormal vascular coupling, peculiar features of interictal activity and increased oxygen consumption during seizures (Folbergrová et al., 1981), which are factors that may modulate the neurovascular coupling (Osharina et al., 2010).
2.2 Review of observations from functional neuroimaging during epilepsy
2.2.1 Single-photon emission computed tomography (SPECT)
SPECT is a neuroimaging technique that images regional cerebral blood flow (rCBF). In the SPECT scan, gamma ray emitting radiotracers (such as Tc-99m Hexamethyl-propylene Amine Oxime ([99mTc]-HMPAO) or Tc-99m Ethyl Cysteinate Dimer ([99mTc]-ECD) (Niels A. Lassen, 1989; Walovitch et al., 1989)) are first injected to measure the blood flow of the subject. These radiotracers cross the blood brain barrier rapidly and are then trapped in tissue compartments seconds after the injection (~ 40s). The distribution of the radiotracers is able to be kept for a long time (up to four or five hours), which allows for subsequent imaging procedures. Therefore, SPECT images reflect an integration of CBF changes in the tissue during the first 40s following the injection (d’Asseler et al., 1997).
The first clinical observation of an increase in local cortical blood flow induced by a seizure was made more than a century ago (Horsley, 1892), and was supported by more recent studies on animal models(Sierra-Marcos et al., 2016; Wang et al., 2014; Zeng et al., 2013). Based on these observations, SPECT can be applied to monitor the CBF distribution in the ictal state (named ictal SPECT) as a method to localize the EOZ. However, due to the time delay between the
seizure onset and tracer administration, brain regions showing increased CBF on ictal SPECT images are likely to include both the brain areas initiating the seizure and receiving propagated activity (So and O’Brien, 2012). Moreover, the initial hyperperfusion in the seizure onset zone and the propagated areas have been observed to be rapidly followed by a hypoperfusion in the same areas in temporal lobe epilepsy, presumably due to autoregulatory mechanisms limiting excitotoxic damage (Rowe et al., 1991). Therefore, it has been reported the radiotracer injection needs to be performed within 20s after the seizure onset time in order to yield a reasonable sensitivity and specificity in localizing the seizure onset region (Lee et al., 2006; Patil et al., 2007).
SPECT is also routinely performed in the interictal period as a way to provide the baseline comparison for images taken in the ictal period to increase the localization accuracy. Limitations of the conventional interpretation of ictal SPECT images include the difficulty in distinguishing subtle changes resulting from different baseline patterns, the dose of injected medicine and the injection time (Kim and Mountz, 2011; Lee et al., 2000). Moreover, if the IOZ is hypoperfused during baseline (i.e. in the interictal period), the increase in CBF in the ictal period may appear to be obscure despite the presence of relative hyperperfusion (O’Brien et al., 1998). To overcome these limitations in ictal SPECT interpretation, subtraction methods have been proposed where SPECT images are also taken in the interictal periods to be subtracted from the ictal images(Kim and Mountz, 2011; Zubal et al., 1995). Compared to the conventional side by side visual analysis, the subtraction analysis was reported to yield a more favorable concordance rate between the localization results and the EOZ (Gaillard et al., 1995b; Lavy et al., 1976). Another subtraction method that was widely applied in ictal SPECT analysis is named subtraction ictal SPECT coregistered to MRI (SISCOM), which allows visualization of ictal activities in the brain by mapping abnormal neural perfusion onto surrounding neural structures. Similar to other subtraction methods, SISCOM was also shown to be able to significantly improve the localization accuracy over conventional visual analysis (O’Brien et al., 1998). Several previous studies reported that resecting the potential epileptogenic region identified by SISCOM could lead to good surgical outcome (G. D. Cascino et al., 2004; Gregory D. Cascino et al., 2004; O’Brien et al., 2004; Wichert-Ana et al., 2008). While these results seem to be encouraging, further work is still needed to determine the accuracy of SISCOM in surgical decision-making, and its predictive power for surgical outcomes.
2.2.2 Positron emission tomography (PET)
PET is another minimally invasive nuclear medicine imaging technique that applies short-lived radiopharmaceuticals to measure and assess perfusion and metabolic activities in various organ systems (Tarkin et al., 2014). It provides information on the functional and metabolic conditions in the brain that is complementary to the anatomical information (Prvulovich and Bomanji, 1998). Various PET tracers exist, serving different purposes, e.g. in the measurement of glucose metabolism (18F-FDG-PET) or cerebral blood flow perfusion (15O-H2O-PET). The most widely
used PET tracer in epilepsy studies is fluorine-18 fluorodeoxyglucose (18F-FDG), which is used to measure glucose metabolism as a reflection of neuronal activity. As an analog of glucose, FDG is transported to brain tissues and is phosphorylated by hexokinase in the same manner as glucose. However, unlike glucose, FDG cannot be consumed through metabolism and thus accumulates in the cell compartments. As proton-rich isotopes such as FDG decay, positrons are emitted. The positrons annihilate rapidly with nearby electrons. Each annihilation generates two photons traveling in opposite directions which can then be captured by multiple pairs of oppositely situated detectors surrounding the subject to produce images (Juhász et al., 2005).
FDG-PET images are normally co-registered with MR images to combine functional and structural information. In epilepsy, PET scans are usually operated in the interictal phase as a result of a much longer tracer uptake time (from thirty to forty-five minutes), which is much longer than the lasting of most seizures (Sarikaya, 2015). FDG-PET localizes the epileptogenic zone based on the fact that the epileptogenic zone usually shows hypometabolism in the interictal period (Liu et al., 2001). Plenty of work have approved the feasibility of using FDG-PET in the presurgical localization of the epileptic focus in subjects with refractory partial seizures which have no contribution in EEG and MRI (Hikima et al., 2004). The localization sensitivity of FDG-PET in TLE were first reported to be 84% in a meta-analysis research conducted in 1994 (Spencer, 1994), while other studies presented a higher sensitivity of PET for TLE cases (87-90%) in the following years (Drzezga et al., 1999; Gaillard et al., 1995a; Kim et al., 2002; Knowlton et al., 1997). Previous studies reported a comparable localization accuracy using interictal FDG-PET and ictal SPECT (Bouilleret et al., 2002; Ho et al., 1995; Hwang et al., 2001; Won et al., 1999) or SISCOM (Desai et al., 2013; Perissinotti et al., 2014). For example, in 117 subjects with intractable epilepsy undergoing surgery, ictal SPECT and interical PET correctly localized the epileptic focus region in 70.3% and 77.7% of the subjects respectively (Hwang et al., 2001). In
another study, the correct lateralization rate was reported to be 85% and 73% using interictal PET and ictal SPECT respectively (Won et al., 1999). These results revealed the potential of using interictal FDG-PET as a routine procedure in the presurgical localization of epilepsy area in subjects with normal MR and no contribution of EEG. However, FDG-PET has a limitation, which is usually not able to precisely delineate the surgical margins of the resection area, as the region showing hypometabolism in the interictal period usually extends beyond the epileptogenic zone (Sarikaya, 2015).
2.2.3 Combined EEG-fMRI
Functional magnetic resonance imaging (fMRI) is another invasive functional neuroimaging technique and monitors neural activity with MRI technology. It depends upon the property of differential magnetic susceptibilities of deoxygenated and oxygenated hemoglobin. EEG-fMRI is a special application of fMRI incorporating information from EEG and was developed in 1992 by John Ives et al (Ives et al., 1993). EEG-fMRI strives to merge the temporal resolution of EEG and the structural resolution of fMRI (Stern, 2006). The epileptic events in the brain comprise synchronous firing from multiple neurons, which generate the local field potential. It can be measured by EEG as seizures or interictal epileptiform discharges. The fMRI recorded hemodynamic signal is the result of coupling between neural activity and the response of interest as hemodynamic fluctuation, which specifically is measured by exploiting the magnetic properties of blood (the BOLD) (Kwong et al., 1992; Ogawa et al., 1990b).
The activation is an increased BOLD signal that is caused by increases in CBF outstripping changes in oxygen consumption (reduced HbR). Conversely, the deactivation is a decreased BOLD signal that is induced by decreases in CBF outstripping changes in oxygen consumption (increase HbR). Although the BOLD signal has the low temporal resolution (Vulliemoz et al., 2010) and problems on the exact nature in relation to neural activity (Ekstrom, 2010; Logothetis and Wandell, 2004), BOLD fMRI has been used to study the cognitive and epileptic phenomena. During the past 10 years, several studies have revealed increases of BOLD signal in areas that were coupled with the area generating epilepsy (Bénar et al., 2002). Similar studies have approved that there were some BOLD signal changes in areas far away from presumed epileptic foci but no apparent EEG changes in these regions (Kobayashi et al., 2006a). In these surrounding areas increase in BOLD is most often observed but sometimes a decrease of BOLD
signal is obtained. These results indicate that BOLD signal can show the distance impact of interictal spikes. These areas of BOLD signal changes were verified with intracerebral electrodes (Bénar et al., 2006). There was the hope of supplying useful clinical information in patients when the location of epilepsy was evaluated before surgery. For localization of epileptic focus, EEG-fMRI studies have shown it can supply complementary information in evaluation of patients with intractable epilepsy (Zijlmans et al., 2007). It was possible to localize epileptic focus in nonlesional frontal lobe epilepsy that was subsequently confirmed by other imaging techniques or pathologic analysis (Moeller et al., 2009). Some studies have shown that a good postsurgical outcome happens after the area of BOLD activation was removed surgically (An et al., 2013; Thornton et al., 2010). However, some studies have observed a paradoxical response and do not explain it: instead of an increase in BOLD signals, a decrease in BOLD signal was found during some spikes (Jacobs et al., 2009; Kobayashi et al., 2006b; Rathakrishnan et al., 2010). One limitation of understanding of EEG-fMRI signal is the low temporal resolution (around several seconds) (Heers et al., 2014).
Unlike focal epilepsy, idiopathic generalized epilepsy (IGE) is described by an EEG signal with generalized spike wave discharges (GSWDs). Early EEG-fMRI studies observed short GSWDs in the EEG signal, which revealed that there was an activation in thalamus during GSWDs, but a deactivation was also found in lateral parietal and frontal cortex (Aghakhani et al., 2004; Gotman et al., 2005; Hamandi et al., 2006). Study with absence epilepsy indicated increased synchronous activity in the orbitofrontal cortex (Bai et al., 2011). During the period of GWSDs the increased synchronous connectivity was more widely observed (Luo et al., 2012). However, several studies showed decreased functional connectivity in the thalamus (Masterton et al., 2012; Wang et al., 2012) and the attention network with absence seizures (Killory et al., 2011). Such studies on functional connectivity are needed to replicate further. In summary, EEG-fMRI was useful in investigating the temporal changes of paroxysms and provided novel insights into the mechanism of IGE.
2.2.4 Functional near-infrared spectroscopy (fNIRS)
FNIRS is an emerging technique that can continuous, non-invasive monitor the deoxygenated, oxygenated and total hemoglobin (Jöbsis, 1977). FNIRS uses optical emitters to send near-infrared light with the wavelength of 650 ~ 900 nm onto the scalp and the hemoglobin in tissue
mainly absorbs the light. The scattered light can be collected by the sensors positioned near the emitters (a few centimeters). Local blood oxygenation changes on the cortex can be recorded in terms of deoxygenated hemoglobin (HbR) and oxygenated hemoglobin (HbO) (Delpy and Cope, 1997; Irani et al., 2007). Compared to fMRI, fNIRS has some distinct advantages, such as portability, lower cost and long term recordings. It can also separate the concentrations of saturation of oxygen (SO2), HbO, HbR and total hemoglobin (HbT) when several wavelengths
are applied simultaneously. There are several methods developed for fNIRS technique, involving the (1) frequency domain (FD) (2) continuous wave (CW), and (3) time domain (TD) methods, which have been used in brain imaging (Khan et al., 2011; Mesquita et al., 2010; Zhang et al., 2005).
In recent years, fNIRS has been widely used in study of epilepsy. fNIRS combined with continuous EEG has been applied to investigate the hemodynamic changes before, during and after epileptic seizures (Irani et al., 2007; Steinhoff et al., 1996; Villringer et al., 1994). In past decades, different groups have used EEG-fNIRS as an complementary method of epilepsy diagnosis (Adelson et al., 1999; Arca Diaz et al., 2006; Buchheim et al., 2004; Cooper et al., 2011; Rizki et al., 2015; Seyal, 2014; Sokoloff et al., 2015). In most cases, there is an increase in CBV and HbO during partial seizures, which lasts beyond the seizure (Villringer et al., 1994). Some investigations have found an increase of CBV with 10 subjects with TLE in the lesion territories, which confirms earlier studies of partial epilepsy (Watanabe et al., 2002). The hemodynamic response of absence seizures shows a deoxygenation (increase in HbR, decrease in CBV and HbO), which is delayed by several seconds from the first spike (Buchheim et al., 2004; Roche-Labarbe et al., 2008). Two different groups have found preictal oxygenation changes in the frontal lobe with EEG-fNIRS (Seyal, 2014; Slone et al., 2012).
Overall, EEG-fNIRS is a promising technique for study of epilepsy and preliminary work have confirmed its usefulness and clinical potential (Machado et al., 2014; Pellegrino et al., 2016; Peng et al., 2014; Vinette et al., 2015; Yücel et al., 2014). It may become a primary tool to manage epileptic patients (particularly neonates and children) in clinical routine, (Wallois et al., 2010).
2.2.5 Optical imaging of intrinsic signals
Intrinsic optical signal (IOS) was first applied to measure the neuronal response with stimulation in tissue by Hill and Keynes (Hill and Keynes, 1949). Optical imaging of intrinsic signals (OIIS) is a method for detecting hemodynamic changes in the brain, according to the absorption of neural tissue with enhanced light, which is induced by focal increases in HbO and CBF (Frostig et al., 1990; Malonek and Grinvald, 1996; Prakash et al., 2009). These changes in reflectance can be detected by a camera with various wavelengths, which can measure the hemodynamic changes with temporal resolution of millisecond and micrometer spatial resolution. Since OIIS requires brain surgery to show the cortex it is widely known as an “invasive” imaging. However, compared to the electrophysiological methods that insert electrodes directly into the human brain, the OIIS is non-invasive because the intraoperative IOS is operated in the operating room by adding a camera to the operating scope (Prakash et al., 2009).
When the light illuminates the cerebral cortex, the active cortex and its corresponding vasculature have changes in reflective light compared to the inactive areas (Prakash et al., 2009; Zepeda et al., 2004). Until now three sources of intrinsic signals are mostly used based on the spectral composition of measured light (Mayhew et al., 2000; Sheth et al., 2004a). Using the light with the wavelength ~500-599 nm, both HbO and HbR directly correlating with HbT or CBV can be measured since they reflect light equally (Mayhew et al., 2000; Nemoto et al., 2004). Using the light with the wavelength ~ 600-699 nm, deoxy-hemoglobin absorbs most of light, as HbR has three times of the absorption coefficient than HbO. Hence, an increase in reflection at these wavelengths implies a decrease in HbR. Finally, using the near infrared light (~700-800 nm), variations in cellular swelling are the main component of the intrinsic signal since hemoglobin minimally absorbs light (Malonek and Grinvald, 1996). Therefore, the OIIS can be applied to detect changes of HbO and CBV in the brain cortex. OIIS is a little bit different from fNIRS. For example, the whole surface of the cortex is illuminated and cameras that are sensitive to certain wavelengths are used to collect changes of hemoglobin concentration and CBV. OIIS also requires the exposure of the brain cortex and has high spatial resolution.
OIIS has been used to study epileptic events in vitro using slices of cortex in rat brain (Borbély et al., 2014; Mané and Müller, 2012) and in vivo in rat (Chen et al., 2000; Schwartz and Bonhoeffer, 2001; Suh et al., 2005), ferret (Schwartz, 2005, 2003; Schwartz and Bonhoeffer, 2001) and
mouse (Guevara et al., 2013). These work revealed that OIIS can localize the area of an interictal spikes as well as the site of surrounding (Schwartz, 2003; Schwartz and Bonhoeffer, 2001). OIIS could also be applied in preictal seizure that can be used to predict epileptic onset (Chen et al., 2000). Besides, the relationship between epileptic events and HbR or CBV could be studied by OIIS (Bahar et al., 2006, 2005; Suh et al., 2005).
OIIS has also been used to image epileptic focus and brain function activity during the surgery in human (Haglund et al., 1992; Sato et al., 2002; Schwartz et al., 2004; Zhao et al., 2007). Beyond localizing human physiological and pathological activity and studying hemodynamic response, it was also used to predict the pre-ictal changes in human epilepsy. Overall, OIIS measurements of hemodynamic response and CBF may become increasingly important for localizing and predicting epileptic seizures.
2.2.6 Confocal and two-photon microscopy
Confocal microscopy is an inestimable technique for high-resolution microscopy. The principle based on the confocal imaging is depicted by Marvin Minsky in 1957 (Prasad et al., 2007). It increases optical resolution and contrast using a confocal mechanism. In the conventional microscope, the image is obtained from some light that is out of focus, which has limitations on thickness and contrast of the sample (Prasad et al., 2007; Rudd et al., 2005). Confocal laser scanning microscopy scans the sample with a focused spot of laser and a small pinhole at the confocal plane, which only allows the light generating from the focus to pass (Rajadhyaksha et al., 1999, 1995). The photomultiplier tube (PMT) or an avalanche photodiode (APD) can detect the emitted light mapping the image, which is a function of the location of the scanning spot. Compared to the conventional microscopy, the confocal laser scanning microscopy has a better resolution. The pinhole needs to be near an extent in practice so that it can discard most of the light (Heintzmann et al., 2003). Confocal microscopy enables the reconstruction of three-dimensional structures by stacking individual 2D images at different depths.
In the past few years, there is remarkable progress in confocal microscopy, which includes using new optical methods to study ultrastructural issues and using other methods to study cellular dynamic in animals. The advancement in image analysis is propelling the availability of large-scale anatomical reconstruction (Wilt et al., 2009). However, it is also important for advancements in complementary fields that involve animal preparation and strategies of labelling