HAL Id: hal-01114435
https://hal-polytechnique.archives-ouvertes.fr/hal-01114435
Submitted on 9 Feb 2015
HAL is a multi-disciplinary open access
archive for the deposit and dissemination of
sci-entific research documents, whether they are
pub-lished or not. The documents may come from
teaching and research institutions in France or
abroad, or from public or private research centers.
L’archive ouverte pluridisciplinaire HAL, est
destinée au dépôt et à la diffusion de documents
scientifiques de niveau recherche, publiés ou non,
émanant des établissements d’enseignement et de
recherche français ou étrangers, des laboratoires
publics ou privés.
In Vivo Single-Cell Detection of Metabolic Oscillations
in Stem Cells
Chiara Stringari, Hong Wang, Mikhail Geyfman, Viera Crosignani, Vivek
Kumar, Joseph s. Takahashi, Bogi Andersen, Enrico Gratton
To cite this version:
Chiara Stringari, Hong Wang, Mikhail Geyfman, Viera Crosignani, Vivek Kumar, et al.. In Vivo
Single-Cell Detection of Metabolic Oscillations in Stem Cells. Cell Reports, Elsevier Inc, 2015, 10 (1),
pp.1-7. �10.1016/j.celrep.2014.12.007�. �hal-01114435�
Report
In Vivo Single-Cell Detection of Metabolic
Oscillations in Stem Cells
Graphical Abstract
Highlights
d
We used a noninvasive method to study epidermal stem cell
metabolism in vivo
d
The circadian clock regulates intermediary metabolism in
epidermal stem cells
d
A high NADH/NAD+ ratio, reflecting increased glycolysis, is
found during the night
d
This high NADH/NAD+ ratio correlates with a higher
proportion of stem cells in S phase
Authors
Chiara Stringari, Hong Wang, ...,
Bogi Andersen, Enrico Gratton
Correspondence
bogi@uci.edu (B.A.),
egratton@uci.edu (E.G.)
In Brief
The role of the circadian clock in stem cell
metabolism is unclear. Stringari et al. use
a label-free, noninvasive method to
demonstrate circadian clock regulation of
intermediary metabolism in epidermal
stem cells in vivo. The clock coordinates
intermediary metabolism and cell-cycle
progression, perhaps to minimize
genotoxicity.
Stringari et al., 2015, Cell Reports
10, 1–7
January 6, 2015
ª2015 The Authors
Cell Reports
Report
In Vivo Single-Cell Detection of Metabolic
Oscillations in Stem Cells
Chiara Stringari,
1,2Hong Wang,
3,4Mikhail Geyfman,
3Viera Crosignani,
1Vivek Kumar,
5,6Joseph S. Takahashi,
5,6Bogi Andersen,
3,7,8,9,10,*
and Enrico Gratton
1,8,10,*
1Laboratory of Fluorescence Dynamics, Biomedical Engineering Department, University of California, Irvine, Irvine, CA 92037, USA 2Laboratory for Optics and Biosciences, E´cole Polytechnique, 91128 Palaiseau Cedex, France
3Department of Biological Chemistry, School of Medicine, University of California, Irvine, Irvine, CA 92037, USA
4State Key Laboratory for Agrobiotechnology, College of Biological Sciences, China Agricultural University, Beijing 100193, China 5Department of Neuroscience, University of Texas Southwestern Medical Center, Dallas, TX 75390, USA
6Howard Hughes Medical Institute, University of Texas Southwestern Medical Center, Dallas, TX 75390, USA 7Department of Medicine, School of Medicine, University of California, Irvine, Irvine, CA 92037, USA 8Center for Complex Biological System, University of California, Irvine, Irvine, CA 92037, USA 9Institute for Genomics and Bioinformatics, University of California, Irvine, Irvine, CA 92037, USA 10Co-senior author
*Correspondence:bogi@uci.edu(B.A.),egratton@uci.edu(E.G.)
http://dx.doi.org/10.1016/j.celrep.2014.12.007
This is an open access article under the CC BY license (http://creativecommons.org/licenses/by/3.0/).
SUMMARY
Through the use of bulk measurements in metabolic
organs, the circadian clock was shown to play roles
in organismal energy homeostasis. However, the
relationship between metabolic and circadian
oscil-lations has not been studied in vivo at a single-cell
level. Also, it is unknown whether the circadian clock
controls metabolism in stem cells. We used a
sensi-tive, noninvasive method to detect metabolic
oscilla-tions and circadian phase within epidermal stem
cells in live mice at the single-cell level. We observe
a higher NADH/NAD+ ratio, reflecting an increased
glycolysis/oxidative phosphorylation ratio during
the night compared to the day. Furthermore, we
demonstrate that single-cell metabolic heterogeneity
within the basal cell layer correlates with the
circa-dian clock and that diurnal fluctuations in NADH/
NAD+ ratio are
Bmal1 dependent. Our data show
that, in proliferating stem cells, the circadian clock
coordinates activities of oxidative phosphorylation
and glycolysis with DNA synthesis, perhaps as a
pro-tective mechanism against genotoxicity.
INTRODUCTION
The circadian clock is a self-sustained cellular oscillator that
co-ordinates appropriate metabolic responses within peripheral
tis-sues with the light/dark cycle. Recent studies demonstrated that
the circadian clock and metabolism are tightly interconnected
(
Bass and Takahashi, 2010; Eckel-Mahan and Sassone-Corsi,
2013; Sahar and Sassone-Corsi, 2009
). Thus,
circadian-clock-regulated transcription feedback loops in the liver produce
cy-cles of NAD+ biosynthesis, ATP production, and mitochondrial
respiration, and conversely, the cellular redox status influences
the activity of clock transcription factors (
Peek et al., 2013
). So
far, in vivo evaluations of metabolic oscillations have been
done through bulk-tissue experiments. Furthermore, it remains
unknown whether the circadian clock is involved in metabolism
control in stem cells that maintain self-renewing epithelia.
The interfollicular epidermis, a prototype proliferative
epithe-lium, contains a basal cell layer where the majority of cells are
highly proliferative stem or progenitor cells that exit the cell cycle
as they move into the suprabasal compartment for differentiation
and formation of a protective barrier (
Clayton et al., 2007; Lim
et al., 2013; Mascre et al., 2012
). Studies in a number of different
mammals demonstrated a striking time-of-day-dependent
varia-tion in stem cell proliferavaria-tion in the epidermis (
Bjarnason and
Jor-dan, 2002; Brown, 1991
) and other proliferative epithelia such as
the intestine (
Potten et al., 1977
). More recent studies have
started to cast light on how the time-of-day-dependent variation
in cell proliferation is regulated, showing that core circadian
clock components are required for this feature (
Gaddameedhi
et al., 2011; Geyfman et al., 2012; Janich et al., 2011, 2013;
Pli-kus et al., 2013
).
The biological function of time-of-day-dependent stem cell
proliferation remains unexplained (
Gaddameedhi et al., 2011;
Geyfman et al., 2012; Janich et al., 2013; Plikus et al., 2013
).
One hypothesis is that organisms have evolved to temporally
separate DNA synthesis from metabolic functions such as
oxida-tive phosphorylation as a protecoxida-tive mechanism, as has been
suggested for metabolic cycles in yeast (
Tu et al., 2005
). Energy
production through oxidative phosphorylation creates high
levels of reactive oxygen species (ROS), which damage DNA,
leading to cellular toxicity, cancer, and aging. A previous study
reported that the expression of genes involved in oxidative
phos-phorylation and the skin’s ROS levels are BMAL1 dependent and
antiphasic to the peak in S phase for stem cells (
Geyfman et al.,
2012
). The limitation of these studies is that, except for the
quan-titation of cell proliferation, they are based on measurements in
the cellularly complex skin and rely on inference from gene
expression rather than direct measurements of metabolites.
In order to study metabolism of stem cells of the epidermal
basal cell layer in vivo, we applied two-photon excitation (TPE)
and fluorescence lifetime imaging microscopy (FLIM) of the
intrinsic metabolic biomarker NADH (
Heikal, 2010; Konig and
Riemann, 2003; Stringari et al., 2011
;
Figure 1
). This optical
method is noninvasive and provides sensitive and quantitative
measurement of free and protein-bound NADH levels, which
reflect the metabolic state of single cells within the native
micro-environment of the living tissue (
Stringari et al., 2011, 2012a
). The
free and bound NADH ratio reflects the NADH/NAD+ redox ratio
(
Bird et al., 2005; Skala et al., 2007
), an indicator of the relative
level of glycolysis and oxidative phosphorylation within the cell
(
Bird et al., 2005; Stringari et al., 2012a
; see
Supplemental
Information
).
RESULTS
We first performed in vivo imaging of NADH autofluorescence and
collagen second harmonic generation (SHG) in adult mouse skin
(
Figures 1
A–1C) to determine whether we could utilize the SHG
from the dermis to localize cells of the basal cell layer. This
approach was successful, as NADH is excited at 740 nm within
Figure 1. In Vivo Noninvasive NADH Imaging of Stem Cells within the Epidermal Basal Cell Layer
(A) Scheme of the live mouse imaging. Two-photon excitation (TPE) fluorescence from NADH (cyan) and second harmonic generation (SHG) from collagen are collected in epidetection through the same objective of the excitation (Exc), represented in red.
(B) Energy diagrams and wavelengths involved in the TPE and SHG.
(C) A representative cross-section of mouse skin showing the epidermis separated from the dermis by a basal lamina. SHG signal from dermal collagen fibers is excited at 880 nm and collected with a 440/20 nm filter. NADH TPE fluorescence intensity is excited at 740 nm and collected with a 460/80 nm filter highlighting single stem cells within the basal layer.
(D) After a mathematical transformation that involves fast Fourier transformation (FFT) (Experimental Procedures;Digman et al., 2008), the measured fluorescence lifetime decay is represented by a single point in the 2D phasor plot with g and s coordinates corresponding to the real and imaginary part of the FFT. Because of the linearity of the phasor coordinates, mixtures of free and bound NADH in the focal volume will lay along the line that connects the pure molecular species (Stringari et al., 2011).
(E) Phasor analysis of the FLIM images is performed both at the pixel level and cell level. Single pixels are painted in the FLIM map according to a linear cursor (from purple to cyan) that corresponds to different relative concentration of free and bound NADH. Optical metabolic fingerprint of single cells is calculated by averaging the phasor coordinates over the segmented region of interest of the cells (red circular cursor). Cell-phasor fingerprints are represented in the phasor scatterplot by single points located along the metabolic trajectory between glycolysis and oxidative phosphorylation (OXPHOS).
cells of the epidermal basal cell layer, located right above the
collagen fibers of the dermis (
Figures 1
C and
S1
). The two-photon
fluorescence intensity NADH distribution highlights single-cell
morphology with relatively dim nuclei and bright mitochondria
(
Figures 1
C, 1E, and
2
A). Analysis of the FLIM images is performed
by a fast Fourier transform (FFT) of the FLIM raw data (
Figures 1
D
and 1E) by creating a 2D histogram (phasor plot) of the NADH
FLIM image where every pixel of the FLIM image is transformed
into a pixel in the phasor plot (
Figures 2
A and 2B). The phasor
coordinates g (x) and s (y) are the real and the imaginary part of
the FFT transformation (
Supplemental Information
), respectively,
and the g coordinate is the most sensitive to free/bound NADH
variations (
Stringari et al., 2011, 2012a
). The broad NADH lifetime
distribution (
Figures 1
D and
2
B) has a characteristic
linear-elon-gated pattern that reflects a mixture of free and bound NADH,
yielding information on different distributions of metabolic states
and redox ratios of the cells over the time (
Stringari et al., 2012a
).
We next used fluorescence lifetime measurement of intrinsic
NADH within single cells (
Figures 1
D and 1E) of the basal cell
layer to determine whether there are time-of-day-dependent
fluctuations in NADH levels (
Figure 2
). We found that metabolic
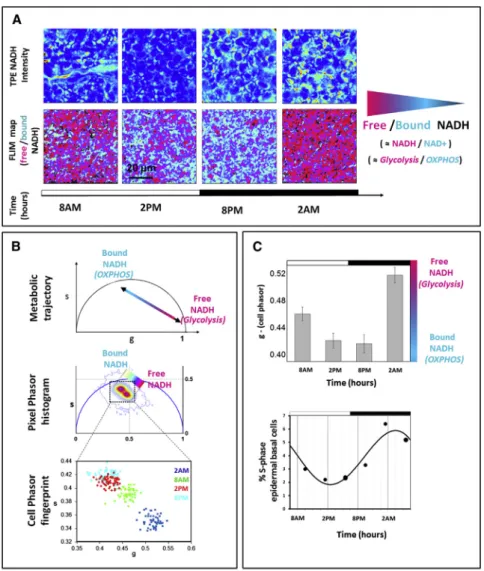
Figure 2. Free-to-Bound NADH Metabolic Circadian Oscillations in Stem Cells of the Epidermis Basal Layer
(A) TPE fluorescence intensity in vivo images of stem cells within the epidermis basal layer excited at 740 nm with respective FLIM color maps at 740 nm of the relative concentrations of free NADH and bound NADH. Red-purple color indicates a high free/bound NADH ratio, whereas violet, cyan, and white indicate linearly and progressively decreasing free/bound NADH ratios. Different ra-tios of free and protein-bound NADH reflect different redox ratios (NADH/NAD+) and rates of glycolysis and oxidative phosphorylation. (B) Different relative concentrations of free and bound NADH correspond to a metabolic trajectory in the phasor plot between glycolysis and OX-PHOS, respectively. The linear cluster in the pixel phasor histogram represents all possible relative concentrations of free NADH (purple) and bound NADH (white). Scatterplot of the cell phasor of all stem cells optical metabolic fingerprint at different times of the day: 2 a.m. (blue); 8 a.m. (green); 2 p.m. (red); and 8 p.m. (cyan).
(C) The top shows a histogram of the g coordinate of the cell phasor fingerprint (which is proportional to the free/bound NADH ratio) displaying a circa-dian metabolic oscillation. All distributions are statistically different (t test p < 0.0001). The error bars indicate the SD. The bottom shows the average number of stem cells in S phase over 24 hr as determined by bromodeoxyuridine incorpora-tion (Geyfman et al., 2012).
See alsoFigure S2.
oscillations in the NADH cellular
finger-prints follow a diurnal pattern, showing a
consistent variation in free/bound NADH
ratios between day and night (
Figures 2
and
S2
). Mapping the relative
concentra-tion of free (purple) and bound (cyan) NADH within cells of the
basal cell layer at different time points of the day, according to
the FLIM phasor location of the free NADH and the bound
NADH measured in solution (
Stringari et al., 2011
), we found
greater free-to-bound NADH ratios at 2 a.m. and 8 a.m. than 2
p.m. and 8 p.m. (
Figures 2
A and 2B). In these studies, the
meta-bolic optical fingerprint of single stem cells is measured through
the average phasor FLIM value of the entire cell, including
cyto-plasmic, mitochondrial, and nuclear NADH (
Figure 1
E).
Mito-chondrial NADH is the major contributor to the cellular metabolic
optical fingerprint because mitochondria are brighter than
cyto-plasm and nucleus and occupy a higher percentage of the cell
volume (
Figure 1
C). For quantification, the cellular phasor values
were then plotted in the scatter diagram, showing that the
average FLIM phasor values of basal cells are significantly
different according to the hours of the day, indicating a different
metabolic state (t test between the g coordinate of single cells;
p < 0.0001;
Figure 2
B). We found consistent results in six
inde-pendent measurements (
Figure S2
). The relative concentration
of free/bound NADH within stem cells is highest during the night
at 2 a.m. and 8 a.m., decreasing significantly during the day at
2 p.m. and 8 p.m. (
Figures 2
B and 2C). The histogram of the g
co-ordinate of the cell phasor fingerprints (which is proportional to
the free/bound NADH ratio) displays a circadian metabolic
oscil-lation with a peak at 2 a.m. in phase with the highest percentage
of cells in S phase (
Figure 2
C).
Different ratios of free and protein-bound NADH reflect
different redox ratios (NADH/NAD+), which in turn reflect the
relative rates of glycolysis and oxidative phosphorylation
(glycol-ysis/oxidative phosphorylation [OXPHOS] ratio;
Bird et al., 2005;
Stringari et al., 2012a
; see
Supplemental Information
). The
time-of-day-dependent free/bound NADH oscillations suggest that
cells of the basal cell layer have relatively higher rate of glycolysis
during the night whereas during the day they present relatively
higher rates of oxidative phosphorylation. The glycolytic and
the oxidative phosphorylation phenotypes measured during
the night and day (
Figure 2
), respectively, correlate with
previ-ously described time-of-day variation in S phase in epidermal
stem cells with the high OXPHOS state being antiphasic to
maximum S phase (
Figure 2
C;
Geyfman et al., 2012
). The
meta-bolic oscillations that we measure in vivo in basal cell layer stem
cells are also consistent with the NAD+ circadian rhythmicity and
the mitochondrial oxidative respiration rates recently measured
in liver cells (
Peek et al., 2013
).
The phasor FLIM analysis at single-cell resolution reveals
sig-nificant cell-to-cell heterogeneity in the metabolic signature as
indicated by the intrinsic free and protein-bound NADH
concen-trations (
Figures 1
D, 1E, and
2
B). To quantify the intercell
meta-bolic heterogeneity within the basal cell layer, we determined the
SD of the phasor coordinates g over the entire population of
re-corded cells. The measured SD of the g cell phasor coordinates
has a typical value between 0.008 and 0.034 (
Figures 2
B and
S2
),
which is significantly larger than the experimental error on a
sin-gle-cell phasor measurement (0.002 with the signal-to-noise
ra-tio of the experiment;
Stringari et al., 2012b
). Hence, the free/
bound NADH distribution we observe reflects a biological
varia-tion and true heterogeneity of the cellular metabolic fingerprint
within the population of basal cells.
To investigate whether there is a correlation between the
metabolic fingerprint and the circadian phase, we performed
NADH FLIM measurements on the epidermis of Per1-Venus
mice expressing the fluorescent protein VENUS from the
clock-controlled Per1 promoter (
Cheng et al., 2009
). The
circa-dian clock phase of individual progenitors of the basal cell
layer was evaluated by exciting the tissue at 940 nm
wave-length and measuring the intensity of the Per1-Venus reporter
(see
Experimental Procedures
;
Figure S3
). As reported before
(
Cheng et al., 2009
), the average intensity of the Per1-Venus
reporter is higher at 2 a.m. and 8 a.m. than 2 p.m. and 8
p.m. (
Figures 3
A and 3B). The phase of the Per1-Venus clock
reporter correlates with high ratios of free-to-bound NADH and
glycolysis/OXPHOS ratios (i.e., high values of g coordinate of
single-cell phasor fingerprints). Furthermore, we found a linear
correlation between the cellular metabolic fingerprint (g
coordi-nate of single-cell phasor) and the circadian-clock phase of
in-dividual cells (Per1-Venus reporter intensity;
Figure 3
C). Thus,
the circadian clock output and the redox state show significant
cell-to-cell heterogeneity and are tightly correlated at a cellular
level.
To determine whether the daily fluctuations of NADH in
pro-genitor cells of the basal cell layer are controlled by the circadian
clock, we evaluated the metabolic fingerprint of epidermal stem
cells in
Bmal1 / mice, which lack circadian rhythm (
Bunger
et al., 2000
). We found that time-of-day-dependent metabolic
oscillations of the progenitor cells in the epidermal basal cell
layer are obliterated in the
Bmal1 / mice, (in
Figure 4
, the
dif-ference between the
Bmal1 / cell fingerprints at 2 a.m. and 2
p.m. is not statistically significant [t test p = 0.37]); these results
were consistently observed in three independent measurements
(
Figure S4
). As the
Bmal1 / mice were kept under normal
12:12 light-dark (LD) conditions, during which the animals are
entrained as measured by wheel running, these experiments
show that BMAL1 is required for diurnal variation in the
free-to-bound ratio of NADH in stem cells of the interfollicular
epidermis.
Figure 3. Metabolic Cell Heterogeneity in Epidermal Stem Cells Correlates with the Clock Phase
(A) TPE in vivo images of the epidermis basal cell layer expressing Per1-Venus reporter after exci-tation of stem cells at 940 nm. For the same field of view, TPE intensity images of NADH and FLIM color maps at 740 nm of the relative concentra-tions of free NADH and bound NADH are repre-sented. Red-purple color indicates a high free/ bound NADH ratio, whereas violet, cyan, and white indicate linearly and progressively decreasing free/ bound NADH ratios.
(B) Histogram of the average Per1-Venus intensity from single stem cells displays a circadian oscil-lation in phase with the osciloscil-lation of the g coor-dinate of cell phasor fingerprint (Figure 2). The error bars indicate the SD. A.U, arbitrary units. (C) Single-stem-cell Per1-Venus intensity displays a linear correlation with its metabolic fingerprint. See alsoFigure S3.
DISCUSSION
Previous studies have shown that proliferation of interfollicular
epidermal stem cells is highly diurnal, with a greater percentage
of cells undergoing S phase during the night than during the day
in mice, and that this diurnal variation in cell proliferation
de-pends on the core circadian clock gene
Bmal1 acting within
keratinocytes (
Gaddameedhi et al., 2011; Geyfman et al., 2012;
Plikus et al., 2013
). Whereas there is controversy about the
hierarchy of cells within the basal layer of the interfollicular
epidermis, previous work generally supports the idea that, during
normal homeostasis, the mouse epidermis is primarily
main-tained by a single type of progenitor/stem cell (
Clayton et al.,
2007; Lim et al., 2013; Mascre et al., 2012
). In this study, we
have used FLIM, a label-free, single-cell resolution technique
that detects the levels of bound and free NADH in vivo, to identify
diurnal metabolic oscillations in stem cells of the interfollicular
epidermis. The implementation of FLIM overcomes limitations
of previous studies into the role of the circadian clock in
meta-bolism based on bulk measurements, allowing the detection of
metabolic heterogeneity within stem cells of the epidermis and
correlation of this heterogeneity to clock output at a single-cell
level.
Our study supports the idea that the circadian clock regulates
metabolism within stem cells of the interfollicular epidermis for
the following reasons. First, we find a correlation between the
NADH/NAD+ redox ratio as measured by FLIM and clock output
as measured by activity of the Per1-Venus reporter in vivo.
Sec-ond, we find that mutations in
Bmal1 disrupt the diurnal variation
in the NADH/NAD+ redox ratio. Through regulation of gene
expression within metabolic organs, the circadian clock has
been shown to play a key role in diurnal shifts in organismal
metabolic patterns (
Peek et al., 2013; Sahar and Sassone-Corsi,
2009
). Our study indicates that the circadian clock also has a key
function in the modulation of metabolism within stem cells of a
highly proliferative epithelial tissue. We show significant
cell-to-cell heterogeneity in circadian output and NADH/NAD+ redox
ratios, perhaps reflecting different levels of stemness among
the epidermal basal cells.
Interestingly, we find that the epidermal stem cells show a
more glycolytic phenotype during night, when the highest
numbers of cells are in S phase (
Geyfman et al., 2012
). It has
long been observed that proliferating cells rely more on
glycol-ysis than oxidative phosphorylation, such as in the Warburg
effect in cancer cells (
Warburg, 1956
). ROS are a normal
mito-chondrial byproduct of oxidative phosphorylation during cellular
respiration (
Murphy, 2009
). Whereas also serving normal
signaling roles (
D’Autreaux and Toledano, 2007
), ROS is toxic
to the cell, oxidizing a variety of macromolecules including
DNA where it causes mutations. Thus, the accumulation of
ROS-mediated cellular damage is thought to play a role in
carci-nogenesis and aging. All tissues are susceptible to ROS-induced
Figure 4. NADH Metabolic Oscillations Are Disrupted in theBmal1 / Epidermal Basal Layer
(A) Two-photon fluorescence intensity in vivo images of stem cells within the epidermis basal cell layer of wild-type (WT) andBmal1 / mice excited at 740 nm at two different time points. Phasor FLIM color maps at 740 nm of the relative concentrations of free NADH and bound NADH. Red-purple color indicates a high free/bound NADH ratio, whereas violet, cyan, and white indicate linearly and progressively decreasing free/bound NADH ratios.
(B) Scatterplot of the cell phasor of all stem cells’ optical metabolic fingerprint at different times of the day: 2 a.m. (blue) and 2 p.m. (red) measured in WT mice (t test p < 0.0001) and 2 a.m. (green), 2 p.m. (black) measured inBmal1 / mice (t test p = 0.37).
(C) The circadian metabolic oscillation of the cell phasor fingerprint g coordinate (proportional to the free/bound NADH ratio) is disrupted inBmal1 / mice. The error bars indicate the SD.
See alsoFigure S4.
DNA damage, but because the S phase of the cell cycle is the
most-susceptible cellular stage, highly proliferative tissues are
likely most sensitive to ROS-induced mutagenesis, thus
pro-viding one possible explanation for proliferating cells’ reliance
on glycolysis (
Hamanaka and Chandel, 2011
). Our findings
sug-gest that the circadian clock confers time-of-day-dependent
shifts in glycolysis versus oxidative phosphorylation within
prolif-erating epithelial stem cells, thus minimizing DNA damage during
S phase. Conversely, in Bmal1 mutant mice, which show no
tem-poral separation of glycolytic and oxidative metabolism, this
pro-tection is presumably lost, leading to increased DNA damage.
Indeed, mutations in
Bmal1 have been associated with
prema-ture aging and increased DNA damage (
Janich et al., 2011;
Kon-dratov et al., 2006
).
EXPERIMENTAL PROCEDURES Animal Models and Procedures
Mice were kept under 12 hr:12 hr LD cycle (light on at 6:30 a.m.) with unre-stricted access to food and water. Immediately before imaging, mice were anesthetized with ketamine. Hair was shaved and removed with Nair hair remover (Church & Dwight) on the back in a 2 cm2area, which was washed un-der warm water and dried with Kimwipes. Procedures were approved by the Institutional Animal Care and Use Committee (protocols 2002-2357-3 and 2001-2239). Bmal1 / and Per1-Venus mice were previously described (Bunger et al., 2000; Cheng et al., 2009).Bmal1 / mice and controls were studied during first telogen at ages 20–22 days.
Imaging
Imaging was performed with a Zeiss 710 microscope coupled to a Ti:sapphire laser system (Spectra-Physics Mai Tai). A 403 0.8 numerical aperture water immersion objective (LUMPlanFl Olympus) with 2 mm working distance was used. The excitation wavelengths were 880 nm and 740 nm with average po-wer of about 5 mW. Fluorescence intensity images of NADH po-were acquired by exciting the tissue at 740 nm and placing a 460/80 nm emission filter in front of the detector. Second harmonic generation from collagen was excited at 880 nm and collected with an emission filter 440/20 nm or excited at 940 nm and collected with a band-pass filter 470/20 nm.
The stem cells within the epidermal basal cell layer are identified by their unique location immediately above the collagen-rich layer of the dermis; a sec-ond harmonic generation 3D stack was systematically acquired to localize the edge of the dermis layer in the Z axis (Figure S1). For example, inFigure S1C, the edge of the dermis is identified at a depth of 18mm, corresponding to the last Z section of the dermis that contains collagen. To localize the epidermal basal layer, we moved the focus in Z between 2 and 4mm above the edge of the dermis layer. (InFigure S1B, the epidermal basal layer is located between 14 and 16mm.) The epidermal basal layer is characterized (Figure S1B) by small and round-shaped stem cells, whereas cells that undergo differentiation in the upper layers are larger. Six regions of interest of the epidermal basal layer were imaged within the 2 cm2
skin. We imaged four mice for every time point and condition.
Fluorescence lifetime images were acquired with an ISS A320 FastFLIM sys-tem (Colyer et al., 2008). For image acquisition, the following settings are used: image size of 2563 256 pixels and scan speed of 25 ms/pixel. A dichroic filter (690 nm) was used to separate the fluorescence signal from the laser light and the fluorescence. For the acquisition of FLIM images, fluorescence is detected by a photomultiplier (H7422P-40 of Hamamatsu), and a 610 nm short-pass fil-ter is placed in front of the detector. A 495 nm long-pass filfil-ter separates the blue and the green fluorescence. NADH fluorescence was collected through a 460/80 nm filter. FLIM data are acquired and processed by the SimFCS soft-ware developed at the Laboratory of Fluorescence Dynamics. FLIM calibration of the system is performed by measuring the known lifetime of the fluorescein with a single exponential of 4.04 ns. FLIM data are collected until 100 counts in the brightest pixel of the image are acquired. Typically, the acquisition time
was of the order of few seconds. To quantify Per1-Venus intensity, we excited the epidermal basal layer with a wavelength of 940 nm, acquiring ten frames for each field of view (Figure S3C). The same laser power of 5 mW was used for all fields of view. We verified that the Venus fluorescence signal of cells was not affected by photobleaching or photodamage by scanning 20 frames on the same field of view (Figure S3C).
FLIM Phasor Data Analysis
Every pixel of the FLIM image is transformed in one pixel in the 2D histogram of the phasor plot through a mathematical transformation of the fluorescence intensity decay that involves FFT (Digman et al., 2008; Stringari et al., 2011;
Supplemental Information). The coordinates g and s (x and y coordinates, respectively) in the phasor plot are the real and imaginary part of the FFT. The analysis of the phasor distribution is performed by cluster identification of free and bound NADH. Because of the linearity of the phasor coordinates, mixtures of free and bound NADH in the focal volume will distribute along the line that connects the pure molecular species. Fractional intensities of chemical species in every pixel of the image were evaluated with a graphical analysis in the phasor plot as described previously (Digman et al., 2008; String-ari et al., 2011). We performed image segmentation on the FLIM data by select-ing the region of interest of cells within the tissue, usselect-ing a cursor with circular shape. We then calculated the phasor average value within the entire cell, including NADH in mitochondria and nuclei. When measuring the cell phasor, all pixels of the cell (about 1,000) are taken in account and the signal-to-noise ratio of the FLIM signature of cells is higher than in single pixels. The average value of the SD of the NADH average cell phasor is calculated over the five different independent experiments inFigures 2andS2.
SUPPLEMENTAL INFORMATION
Supplemental Information includes Supplemental Experimental Procedures and four figures and can be found with this article online athttp://dx.doi.org/ 10.1016/j.celrep.2014.12.007.
AUTHOR CONTRIBUTIONS
C.S., M.G., V.K., J.S.T., B.A., and E.G. conceived of and designed the iments and analyzed the data. C.S., H.W., M.G., and V.C. performed the exper-iments. C.S., B.A., and E.G. wrote the manuscript with input from all other authors.
ACKNOWLEDGMENTS
Work was supported with NIH grants R01 AR056439, P50 GM076516, and P41 GM103540. Received: July 8, 2014 Revised: October 17, 2014 Accepted: December 2, 2014 Published: December 24, 2014 REFERENCES
Bass, J., and Takahashi, J.S. (2010). Circadian integration of metabolism and energetics. Science330, 1349–1354.
Bird, D.K., Yan, L., Vrotsos, K.M., Eliceiri, K.W., Vaughan, E.M., Keely, P.J., White, J.G., and Ramanujam, N. (2005). Metabolic mapping of MCF10A human breast cells via multiphoton fluorescence lifetime imaging of the coen-zyme NADH. Cancer Res.65, 8766–8773.
Bjarnason, G.A., and Jordan, R. (2002). Rhythms in human gastrointestinal mucosa and skin. Chronobiol. Int.19, 129–140.
Brown, W.R. (1991). A review and mathematical analysis of circadian rhythms in cell proliferation in mouse, rat, and human epidermis. J. Invest. Dermatol.97, 273–280.
Bunger, M.K., Wilsbacher, L.D., Moran, S.M., Clendenin, C., Radcliffe, L.A., Hogenesch, J.B., Simon, M.C., Takahashi, J.S., and Bradfield, C.A. (2000).
Mop3 is an essential component of the master circadian pacemaker in mam-mals. Cell103, 1009–1017.
Cheng, H., Alvarez-Saavedra, M., Dziema, H., Choi, Y.S., Li, A., and Obrietan, K. (2009). Segregation of expression of mPeriod gene homologs in neurons and glia: possible divergent roles of mPeriod1 and mPeriod2 in the brain. Hum. Mol. Genet.18, 3110–3124.
Clayton, E., Doupe, D.P., Klein, A.M., Winton, D.J., Simons, B.D., and Jones, P.H. (2007). A single type of progenitor cell maintains normal epidermis. Nature 446, 185–189.
Colyer, R., Lee, C., and Gratton, E. (2008). A novel fluorescence lifetime imag-ing system that optimizes photon efficiency. Microsc. Res. Tech.71, 201–213. D’Autreaux, B., and Toledano, M.B. (2007). ROS as signalling molecules: mechanisms that generate specificity in ROS homeostasis. Nat. Rev. Mol. Cell Biol.8, 813–824.
Digman, M., Caiolfa, V.R., Zamai, M., and Gratton, E. (2008). The phasor approach to fluorescence lifetime imaging analysis. Biophys. J.94, L14–L16. Eckel-Mahan, K., and Sassone-Corsi, P. (2013). Metabolism and the circadian clock converge. Physiol. Rev.93, 107–135.
Gaddameedhi, S., Selby, C.P., Kaufmann, W.K., Smart, R.C., and Sancar, A. (2011). Control of skin cancer by the circadian rhythm. Proc. Natl. Acad. Sci. USA108, 18790–18795.
Geyfman, M., Kumar, V., Liu, Q., Ruiz, R., Gordon, W., Espitia, F., Cam, E., Millar, S.E., Smyth, P., Ihler, A., et al. (2012). Brain and muscle Arnt-like pro-tein-1 (BMAL1) controls circadian cell proliferation and susceptibility to UVB-induced DNA damage in the epidermis. Proc. Natl. Acad. Sci. USA109, 11758–11763.
Hamanaka, R., and Chandel, N.S. (2011). Cell biology. Warburg effect and redox balance. Science334, 1219–1220.
Heikal, A.A. (2010). Intracellular coenzymes as natural biomarkers for meta-bolic activities and mitochondrial anomalies. Biomarkers Med.4, 241–263. Janich, P., Pascual, G., Merlos-Suarez, A., Batlle, E., Ripperger, J., Albrecht, U., Cheng, H.Y., Obrietan, K., Di Croce, L., and Benitah, S.A. (2011). The circa-dian molecular clock creates epidermal stem cell heterogeneity. Nature480, 209–214.
Janich, P., Toufighi, K., Solanas, G., Luis, N.M., Minkwitz, S., Serrano, L., Leh-ner, B., and Benitah, S.A. (2013). Human epidermal stem cell function is regu-lated by circadian oscillations. Cell Stem Cell13, 745–753.
Kondratov, R.V., Kondratova, A.A., Gorbacheva, V.Y., Vykhovanets, O.V., and Antoch, M.P. (2006). Early aging and age-related pathologies in mice deficient in BMAL1, the core componentof the circadian clock. Genes Dev.20, 1868– 1873.
Konig, K., and Riemann, I. (2003). High-resolution multiphoton tomography of human skin with subcellular spatial resolution and picosecond time resolution. J. Biomed. Opt.8, 432–439.
Lim, X., Tan, S.H., Koh, W.L., Chau, R.M., Yan, K.S., Kuo, C.J., van Ameron-gen, R., Klein, A.M., and Nusse, R. (2013). Interfollicular epidermal stem cells self-renew via autocrine Wnt signaling. Science342, 1226–1230.
Mascre, G., Dekoninck, S., Drogat, B., Youssef, K.K., Brohee, S., Sotiropou-lou, P.A., Simons, B.D., and Blanpain, C. (2012). Distinct contribution of stem and progenitor cells to epidermal maintenance. Nature489, 257–262. Murphy, M.P. (2009). How mitochondria produce reactive oxygen species. Biochem. J.417, 1–13.
Peek, C., Affinati, A.H., Ramsey, K.M., Kuo, H.Y., Yu, W., Sena, L.A., Ilkayeva, O., Marcheva, B., Kobayashi, Y., Omura, C., et al. (2013). Circadian clock NAD+ cycle drives mitochondrial oxidative metabolism in mice. Science 342, 1243417.
Plikus, M., Vollmers, C., de la Cruz, D., Chaix, A., Ramos, R., Panda, S., and Chuong, C.M. (2013). Local circadian clock gates cell cycle progression of transient amplifying cells during regenerative hair cycling. Proc. Natl. Acad. Sci. USA110, E2106–E2115.
Potten, C.S., Al-Barwari, S.E., Hume, W.J., and Searle, J. (1977). Circadian rhythms of presumptive stem cells in three different epithelia of the mouse. Cell Tissue Kinet.10, 557–568.
Sahar, S., and Sassone-Corsi, P. (2009). Metabolism and cancer: the circadian clock connection. Nat. Rev. Cancer9, 886–896.
Skala, M.C., Riching, K.M., Gendron-Fitzpatrick, A., Eickhoff, J., Eliceiri, K.W., White, J.G., and Ramanujam, N. (2007). In vivo multiphoton microscopy of NADH and FAD redox states, fluorescence lifetimes, and cellular morphology in precancerous epithelia. Proc. Natl. Acad. Sci. USA104, 19494–19499. Stringari, C., Cinquin, A., Cinquin, O., Digman, M.A., Donovan, P.J., and Grat-ton, E. (2011). Phasor approach to fluorescence lifetime microscopy distin-guishes different metabolic states of germ cells in a live tissue. Proc. Natl. Acad. Sci. USA108, 13582–13587.
Stringari, C., Edwards, R.A., Pate, K.T., Waterman, M.L., Donovan, P.J., and Gratton, E. (2012a). Metabolic trajectory of cellular differentiation in small in-testine by Phasor Fluorescence Lifetime Microscopy of NADH. Sci. Rep.2, 568.
Stringari, C., Nourse, J.L., Flanagan, L., and Gratton, E. (2012b). Phasor Fluo-rescence Lifetime Microscopy of free and protein-bound NADH reveals neural Stem Cell Differentiation Potential. PLoS ONE7, e48014.
Tu, B., Kudlicki, A., Rowicka, M., and McKnight, S.L. (2005). Logic of the yeast metabolic cycle: temporal compartmentalization of cellular processes. Sci-ence310, 1152–1158.
Warburg, O. (1956). On the origin of cancer cells. Science123, 309–314.