Université de Montréal
Développement et validation de modèles pour le diagnostic
de l'asthme professionnel
Par Mahsa Taghiakbari
Département de médecine sociale et préventive École de santé publique de l’Université de Montréal
Mémoire présenté à l’Université de Montréal en vue de l’obtention du grade de maîtrise
en santé publique option mémoire
August 2017
École de santé publique de l’Université de Montréal
Ce mémoire intitulé :
Développement et validation de modèles pour le diagnostic de l'asthme professionnel (Development and validation of models for diagnosing occupational asthma)
Présenté par : Mahsa Taghiakbari
A été évalué par un jury composé des personnes suivantes :
Dr. Susan Stock, présidente-rapporteure Dr. Edward Lee Petsonk, membre du jury Dr. Eva Suarthana, directrice de recherche Dr. Catherine Lemiére, co-directrice de recherche
Résumé
Le diagnostic de l'asthme professionnel (AP) est toujours un défi. Le test de provocation bronchique spécifique (TPS), comme une méthode de diagnostic de référence, n’est pas aisément accessible. Cette étude diagnostique rétrospective vise à évaluer des outils diagnostiques actuels et à développer des scores cliniques pour AP (définis comme ayant le résultat positif en TPS). Les données concernant les travailleurs soupçonnés d'avoir de l’AP qui, d’une part, ont été exposés aux agents de haut-poids-moléculaire élevé (HPM) (n=139) et à bas-poids-moléculaire (BPM) (n=285), et d’autre part, ont travaillé encore un mois avant de l’évaluation de TPS. Par ailleurs, les modèles de régression logistique sont développés dans chaque groupe d'exposition. Ainsi, concernant des tests objectifs, les valeurs de différents tests distinctifs sont ajoutées aux caractéristiques cliniques, et enfin, le résultat a été évalué. Les modèles ont été testés pour l’exactitude, et pour la validation interne par la procédure bootstrapping. Suite à cela, les modèles finaux sont traduits en scores cliniques et le score total est stratifié en groupes à risque. Chez les travailleurs exposés à des agents BPM, si le test de la méthacholine est fait isolément, le modèle prédictif n'a pas montré de meilleures valeurs diagnostiques que le test de provocation. Cependant, dans le groupe HPM, le modèle final, y compris le sexe, l'âge> 40 ans, la durée des symptômes ≥1 an, la rhinoconjonctivite, l'utilisation de corticostéroïdes inhalés, le test de provocation à la méthacholine, et le test de la piqûre épidermique spécifique, avait un bon calibrage et une validation interne raisonnable. Par ailleurs, la catégorie de sujets avec une probabilité élevée d’avoir AP avait une meilleure spécificité et une meilleure valeur prédite positive par rapport à la combinaison de test de provocation à la méthacholine et de la piqûre épidermique spécifique dans la détection de l'AP, cependant n'avait pas de signification statistique. En conclusion, ce modèle quantifie la probabilité individuelle d'AP. Dans les centres
où l'accès à TPS est difficile ou impossible, notre modèle serait utile dans le diagnostic d’OA, néanmoins, la validation externe du modèle reste nécessaire.
Abstract
The diagnosis of occupational asthma (OA) is challenging since the use of specific inhalation challenge (SIC) as the reference test is not widely accessible. This retrospective diagnostic study is aimed to evaluate current diagnostic tools and to develop clinical scores for OA (defined as positive SIC). Data from workers with suspected OA who were exposed to high-molecular-weight (HMW) (n=139) and low-molecular-high-molecular-weight (LMW) agents (n=285) and still working one month before the SIC were evaluated. Logistic regression models were developed in each exposure group. The added values of different objective tests to clinical and exposure characteristics were evaluated. The models were tested for accuracy, and, validated internally by the bootstrapping procedure. The final models were translated into clinical score and the sum scores were stratified into risk groups. In workers exposed to LMW agents, the predictive model did not perform better diagnostically than the methacholine challenge test alone. In the HMW group, the final model including sex, age >40 years, symptom duration ≥1 year, rhinoconjunctivitis, inhaled corticosteroid use, the methacholine challenge test, and specific SPT had a good accuracy and reasonable internal validation. The high probability category of the predictive model had a better specificity and positive predicted value compared to the combination of methacholine challenge test and specific SPT in detecting OA but did not reach the statistical significance. Our results suggest that this model could quantify an individual’s probability of OA. This model emphasizes the necessity of performing both tests in order to have a more accurate diagnosis in workers exposed to HMW agents. In centers where access to SIC is difficult or impossible, our model might be of benefit in diagnosing OA. Nevertheless, external validation of the model is necessary.
Table of Content
Résumé ... iii
Abstract ...v
List of tables ... vi
List of figures ... vi
List of manuscript tables ... vi
List of manuscript figures ... vii
List of appendix A figures ... vii
List of abbreviations and symbols ... ix
Acknowledgements ...1
Introduction ...2
1. Chapter one ...5
1.1. Definition and Subtypes of Work-related Asthma ...5
1.1.1. Work-exacerbated asthma ...6
1.1.2. Occupational asthma ...6
1.2. Epidemiology of Occupational Asthma ...9
1.2.1. Etiological agents causing occupational asthma ...9
1.2.1.1. High-molecular-weight agents ...9
1.2.1.2. Low-molecular-weight agents ...9
1.2.2. Prevalence, Incidence and Population-attributable risk ... 12
1.2.3. Host risk factors ... 13
1.3. Diagnosis and Evaluation of Occupational Asthma ... 15
1.3.1. Medical and occupational history ... 18
1.3.2. Diagnostic tests ... 22
1.3.2.1. Immunological tests (skin-prick test (SPT) for specific work-related allergens or blood specific IgE measurement) ... 22
1.3.2.2. Respiratory function tests ... 24
1.3.2.2.1. Serial peak expiratory flow rate recording ... 24
1.3.2.2.2. Pre and post-exposure specific inhalation challenge test ... 26
1.3.2.2.3. Respiratory challenge tests using non-specific agonists such as methacholine, mannitol, adenosine, or histamine ... 32
1.3.2.3. Measures of airway inflammation ... 34
1.3.2.3.1. Induced sputum test... 34
1.3.2.3.2. Measurement of fractional nitric oxide (NO) (FeNO) ... 36
1.5. Prevention of Work-related Asthma ... 38
1.6. The role of prediction modeling in the prevention of work-related asthma ... 40
1.7. Long-term adverse outcome of occupational asthma ... 46
2. Chapter two ... 47
2.1. Objectives ... 47
2.2. Methods ... 47
2.2.1. Study design ... 47
2.2.2. Study population and database ... 47
2.2.3. Study variables ... 48 1.2.3.1 Reference standard ... 48 2.2.3.2. Predictors ... 48 2.2.4. Measurement tools ... 49 2.2.4.1. Clinical characteristics ... 49 2.2.4.2. Respiratory tests... 50 2.2.4.3. Skin-prick test (SPT) ... 50
2.2.4.4. Induced sputum test ... 51
2.3. Statistical plan ... 52
2.3.1. Statistical analysis ... 52
2.3.1.2. Objective 2... 52
2.3.1.2.1. Model development ... 52
2.3.1.2.2. Model’s accuracy and internal validity ... 53
2.3.1.2.4. Clinical scores ... 54
2.3.2. Statistical power ... 54
2.3.3. Software ... 56
3. Chapter 3 ... 57
3.1. Manuscript ... 57
Development and Validation of Clinical Scores for Diagnosing Occupational Asthma ... 58
AT A GLANCE COMMENTARY ... 59 Abstract ... 61 Introduction ... 63 Methods ... 64 Results ... 68 DISCUSSION ... 71
Conflict of Interest Statement: ... 77
REFERENCES ... 78
APPENDIX A. ... 99
4. Chapter 4... 104
4.1. Discussions ... 104
4.1.1. Diagnostic properties of the predictors ... 104
4.1.2. Development and validation of the models... 105
4.1.3. Diagnostic values of the clinical scores ... 107
4.1.4. Application of the diagnostic models in prevention of occupational asthma ... 108
4.1.5. Strengths and limitations... 112
4.2. Conclusion ... 113
List of tables
TABLE 1. COMMON HMW AGENTS IN SENSITIZER-INDUCED OA ... 10 TABLE 2. COMMON LMW AGENTS IN SENSITIZER-INDUCED OA ... 11 TABLE 3. KEY ELEMENTS OF THE OCCUPATIONAL HISTORY IN THE EVALUATION OF OCCUPATIONAL ASTHMA ... 21
List of figures
FIGURE 1. SUBTYPES OF WORK-RELATED ASTHMA ADOPTED FROM BAUR ET AL. ...5 FIGURE 2. APPROACH TO DIAGNOSIS OF OCCUPATIONAL ASTHMA SUGGESTED BY VANDENPLAS ET AL.. ... 17
List of manuscript tables
TABLE 1. DISTRIBUTION AND ASSOCIATION BETWEEN THE PREDICTORS AND OA BY TYPE OF AGENTS IN SUBJECTS WORKING ONE MONTH PRIOR TO SIC ... 89 TABLE 2. DIAGNOSTIC VALUE OF EACH PREDICTOR OF OA BY TYPE OF AGENTS IN SUBJECTS WORKING ONE MONTH BEFORE THE SIC*... 91
TABLE 3. THE MULTIVARIABLE MODELS IN WORKERS EXPOSED TO HMW AGENTS ... 93 TABLE 4. CLINICAL SCORES OF THE FINAL MODEL IN WORKERS EXPOSED TO HMW AGENTS... 94 TABLE 5. RISK STRATIFICATION OF SUM SCORES FOR DIAGNOSING OA IN SUBJECTS EXPOSED TO HMW AGENTS ... 95 TABLE 6. THE MULTIVARIABLE MODELS IN WORKERS EXPOSED TO LMW AGENTS ... 96 TABLE 7. CLINICAL SCORES OF THE FINAL MODEL IN SUBJECTS EXPOSED TO LMW AGENTS ... 97 TABLE 8. RISK STRATIFICATION OF THE SUM SCORES FOR DIAGNOSING OA IN WORKERS EXPOSED TO LMW AGENTS ... 98
List of manuscript figures
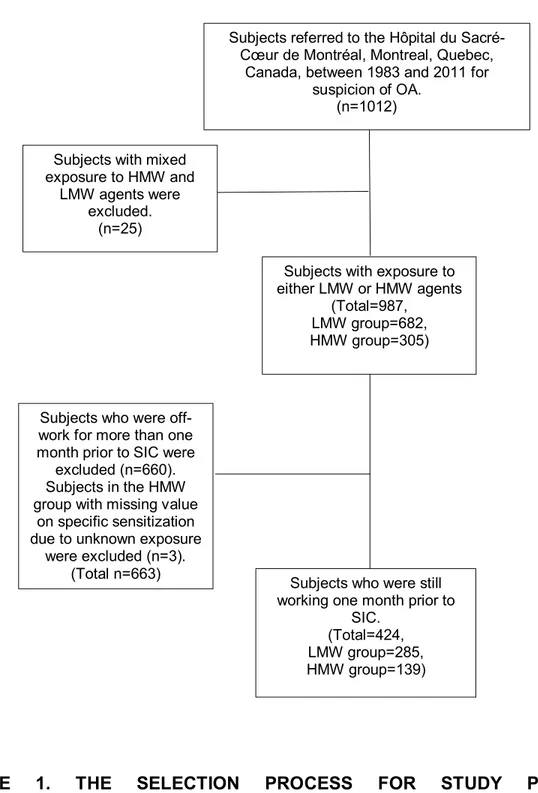
FIGURE 1. THE SELECTION PROCESS FOR STUDY POPULATION ... 88
List of appendix A figures
FIGURE 1. ROC AREA OF THE CLINICAL AND EXPOSURE CHARACTERISTICS MODEL (A), THE CLINICAL AND EXPOSURE CHARACTERISTICS AND SPT-BASED SENSITIZATION TO WORK-SPECIFIC AGENTS MODEL (B); THE CLINICAL AND
EXPOSURE CHARACTERISTICS AND BHR TESTING MODEL (C); THE CLINICAL AND EXPOSURE CHARACTERISTICS AND SPT-BASED SENSITIZATION TO WORK-SPECIFIC AGENTS AND BHR TESTING MODEL (D) IN THE HMW GROUP. THE GREEN DIAGONAL LINE REPRESENTS THE REFERENCE (NO DISCRIMINATION), WHILE THE BLUE CURVE SHOWS THE DISCRIMINATIVE ABILITY OF MODEL 7 BY PLOTTING THE TRUE POSITIVE RATE (SENSITIVITY) AGAINST THE FALSE POSITIVE RATE (1-SPECIFICITY) AT VARIOUS THRESHOLD SETTINGS. ... 103
List of abbreviations and symbols
ACCP = American College of Chest Physicians
ACGIH = American Conference of Governmental Industrial Hygienists AOEC = Association of Occupational and Environmental Clinics AP = Asthme professionnel
ATS = American Thoracic Society
AUC = Area under the receiver operating characteristic curve BHR = Bronchial hyper-responsiveness
BOHRF = British Occupational Health Research Foundation BPM = Bas poids moléculaire
CER = Comité d’éthique de la recherche avec les êtres humains CI = Confidence interval
CNESST = Commission des normes, de l'équité, de la santé et de la sécurité du travail COPD = Chronic obstructive pulmonary disease
CSST = Comité de la santé et de la sécurité du travail
DLCO = Diffusing capacity of the lungs for carbon monoxide DPBS = Dulbecco’s phosphate buffered saline
ERS = European Respiratory Society FeNO = Fractional exhaled nitric oxide
FEV1 = Forced expiratory volume in one second HLA = Human leukocyte antigen
HPM = Haut poids moléculaire HR = Hazard ratio
HSCM = Hôpital Sacré-Cœur de Montréal IIA = Irritant-induced asthma
IL = Interleukine
IgE/G = Immunoglobuline E/G KDa = Kilo Dalton
LMW = Low molecular weight LR = Likelihood ratio
MAR = Missing at random
MCAR = Missing completely at random MSDS = Material safety data sheet NO = Nitric oxide
NOS2 = Nitric oxide synthase NPV = Negative predictive value NRL = Natural rubber latex
NSBHR = Non-specific bronchial hyper-responsiveness OA = Occupational asthma
OASQ-11 = Occupational Asthma Screening Questionnaire-11 items OASYS = Occupational Asthma expert SYStem
OR = Odds ratio
PAR = Population Attributable Risk PEL = Permissible exposure level
PEF = Peak expiratory flow PPB = Parts per billion
PPV = Positive predictive value
RADS = Reactive airway distress syndrome ROC = Receiver operating characteristic SD = Standard deviation
SE = Standard error
SIC = Specific inhalation challenge SPT = Skin prick test
STARD = Standards for Reporting Diagnostic accuracy studies TLV = Threshold limit value
TPS = Test de provocation spécifique WAA = Work-aggravated asthma WEA = Work-exacerbated asthma WRA = Work-related asthma
Acknowledgements
My appreciation first goes to my supervisor, Dr. Eva Suarthana who has oriented and supported me with care and patience from the preliminary to the concluding stages of my master studies. I have gained precious knowledge and research skills during my time as her student, and I am grateful to her for all the constructive criticism and valuable feedback.
I would also like to thank Dr. Catherine Lemière for very helpful discussions and insightful suggestions throughout this thesis. My gratitude extends to my colleagues at Hôpital Sacré-Cœur de Montréal research center and other co-authors of the paper who provided me with some fruitful discussions.
I would like to thank Dr. Jacques Pralong for sharing the dataset and knowledge from his previous valuable researches.
I ultimately would like to thank my family for their love, encouragement, and understanding. This accomplishment would not have been possible without their unconditional care and support.
Introduction
Work-related asthma (WRA) includes different subtypes such as work-exacerbated asthma (WEA) and occupational asthma (OA). OA can be initiated either by exposure to high-molecular-weight (HMW) or some low-high-molecular-weight (LMW) agents causing sensitizer-induced asthma, or by exposure to inhalant irritants that may cause different variants of irritant-induced OA (IIA) (1). More than 360 work-related agents have been identified to cause OA and the number of the causal agents is constantly growing (1). A systematic review of six longitudinal general population-based studies found that 16.3% of all adult-onset asthma is caused by occupational exposures (2). Subjects with OA would have a lower quality of life since this disease is associated with job loss and early retirement hence, high financial burden (3). Yacoub et al. (4) assessed the mental status and quality of life in subjects with OA who were removed from exposure to the causal agents for more than 2 years. They found that, 35% of subjects had anxiety disorders, and 23% had dysthymia. They also had moderately impaired disease-specific quality of life. The American College of Chest Physicians (ACCP) recommended an algorithmic approach for approaching the patients who developed lower respiratory symptoms and are suspected to have OA (5). However, diagnosis of OA remains a challenge in clinical practice. Typically, physicians take a stepwise approach initiated with a thorough medical and occupational history and then continue with one or a combination of the available objective tests. The protocol and tests used for diagnosing OA depend on the country and region. Specific inhalation challenge (SIC) as the reference test is not widely available in North America (6, 7). In Québec, the performance of SIC is mandatory in the vast majority of the cases for confirming the diagnosis of the disease in order to claim insurance compensation (8). However, SIC is offered only in specialized centers across Canada (9).
The secondary and tertiary levels of prevention of OA both focus on the early detection of the individuals who develop the disease in order to avoid further health deterioration (10). The prediction models and scores can improve secondary prevention by helping physicians in detecting individuals with work-related disease, choosing appropriate diagnostic tests, and/or making the decision to refer workers for further investigations (11). In the Netherlands, a surveillance program for bakers (12) is based on a risk prediction questionnaire model and scores (13) for detection of work-related sensitization. Application of this model allows a step-wise approach where only bakers with an elevated risk of sensitization to flour would be referred for further medical examination for work-related allergy. Another study was conducted by Jonaid et al. (14) among bakers with a high risk of sensitization who were referred to specialized clinic. A diagnostic questionnaire model for baker’s asthma was developed in this population and showed good ability in distinguishing bakers with and without the disease. Diagnosis was confirmed with the presence of asthma symptoms, sensitisation to at least one of the bakery allergens, and a change in non-specific bronchial hype-responsiveness (NSBHR) as SIC is not performed in the Netherlands. This stepwise approach seems to be useful, especially for small enterprises where delivery of adequate examination is difficult, and may contribute to cost reduction.
To our knowledge, there is no risk prediction model that quantifies an individual’s probability of having occupational asthma by utilizing clinical and exposure characteristics as well as objective tests other than the SIC (spirometry, bronchial responsiveness testing by methacholine challenge, and skin-prick tests (SPTs)). Development and validation of such a model and converting the results into an easy-to-use score is important because it may facilitate the decision to refer a patient for further investigation (11).
This thesis describes a diagnostic study, performed according to Standards for Reporting of Diagnostic Accuracy (STARD) guidelines, in 424 subjects with lower respiratory symptoms due to exposure to LMW agents (285 subjects) and HMW agents (139 subjects) who were evaluated by SIC for suspicion of OA at the Hôpital du Sacré-Cœur de Montréal between 1983 and 2011. These subjects were still working one month before the SIC.
The study had two objectives: (1) To evaluate the diagnostic parameters of different objective tests in predicting the presence of OA; (2) To develop and validate risk prediction models for estimating the individual’s probability of having OA.
Logistic regression analyses were used to develop the models in the multiple-imputed dataset. A clinical and exposure characteristics model was developed from the subjects’ medical and occupational histories. We further evaluated the added value of skin-prick tests for common and work-related agents, spirometry, and methacholine challenge tests. The accuracy of models was evaluated by using calibration and discrimination measures. The models were validated internally by using bootstrapping procedures. The coefficients from the final regression models were transformed into easy-to-use numbers (i.e. clinical scores).
The predictive model targets the secondary prevention by quantifying an individual’s probability of occupational asthma. Once validated, it would allow physicians to optimize the risk estimation and to detect workers with a higher risk of OA in the absence of the SIC.
1. Chapter one
1.1. Definition and Subtypes of Work-related Asthma
Work-related asthma (WRA) refers to all cases diagnosed with asthma either caused by exposure to a variety of substances in the workplace or an exacerbation of a pre-existing asthma after entering into the workplace. Different phenotypes of WRA have been defined based on past medical history of the patients, work exposures and immunologic response; occupational asthma (OA), and work-exacerbated asthma (WEA) (15). Several clinical entities must be considered as differential diagnosis specially those diseases that have the same presentation as asthma: eosinophilic bronchitis (15), irritable larynx syndrome (16), bronchiolitis, multiple chemical sensitivity syndrome, etc. (17). The prevalence of WRA is constantly increasing as the number of the causative agents related to work are continuously introduced in the literature (18). Figure 1 shows the categorization of WRA adapted from Baur et al. (19).
Work-related asthma (WRA)
Work-aggravated asthma (WAA) Occupational asthma (OA)
IgE-mediated OA Irritant OA OA of unknown pathomechanism
FIGURE 1. SUBTYPES OF WORK-RELATED ASTHMA ADOPTED FROM BAUR ET AL. (19)
1.1.1. Work-exacerbated asthma
Participants with WEA have also been diagnosed with a pre-existing or concurrent asthma, and show worsening of respiratory symptoms upon exposure to substances in the workplace (10). Diagnosis and prevention of WEA are very important as every episode of severe asthma exacerbation is associated with a more rapid decline in lung function (post-bronchodilator FEV1) in children and adults (20). In spite of the importance of early diagnosis and prevention of WEA, a surveillance program in the United States estimated that only 5.2% of reported WEA cases had recorded evidence of pulmonary function tests in their medical records, used to confirm the relationship between asthma exacerbation and work exposure (21). In Ontario, it is also reported that the respiratory function tests were often performed for supporting the relation of asthma with the workplace in subjects with a suspicion of OA (76%) rather than in subjects with WEA (11%) (22). It seems that in a clinical setting, the identification of a WEA case is based on self-reports of a work-related pattern of respiratory symptoms or medication use (23).
Henneberger et al. (23) proposed four criteria for WEA cases definition: 1) pre-existing or concurrent asthma, 2) asthma-work temporal relationship, 3) conditions exist at work that can exacerbate asthma, 4) asthma caused by work (i.e., occupational asthma) is unlikely. They proposed that pathologic pathway to WEA includes inflammatory changes, increased airway responsiveness and reduced flows.
1.1.2. Occupational asthma
Occupational asthma, a variant of WRA, is a common respiratory disease worldwide, defined as asthma caused by exposure in the workplace (24). In other words, it is “a disease characterized by variable airflow limitation and/or hyper-responsiveness and/or inflammation due to causes
and conditions attributable to a particular occupational environment and not to stimuli encountered outside the workplace” (10). OA mostly occurs among bakers and pastry makers, other food processors, spray painters, hairdressers, wood workers, health care workers, cleaners, farmers, laboratory technicians and welders in exposure to different sensitizing and irritative agents (24). A comprehensive list of agents and their related professions responsible for OA can be found at: <http://www.asthme.csst.qc.ca/info_med/index.html>.
There are two main types of OA: immunologic/allergic OA and non-immunologic/non-allergic OA. Immunologic OA, also known as OA with latency or sensitizer-induced OA, is produced by exposure to high-molecular-weight (HMW) or low-molecular-weight (LMW) agents, which provoke an immunological sensitization response. On the other hand, non-immunologic/non-allergic OA, also known as OA without latency or irritant-induced OA, is produced by exposure to inhaled irritant substances at work (25, 26).
1.1.2.1. Sensitizer-induced asthma
HMW agents can induce WRA through an IgE-mediated mechanism. Once a person is sensitized, a very low dose exposure to trigger agents will provoke immune response immediately (within minutes of such an exposure) or may provoke a late or dual response (10). The pathophysiology of LMW-induced OA is poorly understood. It has been hypothesized that LMW agents cause sensitization; however, a few of them induce asthma through an IgE-mediated pathway, such as complex platinum salts during the manufacture of catalysts (27) or cytotoxic drugs(28), as well as rhodium salts used in electroplating(29). These specific LMW agents act as haptens, and are then combined with a body protein to create complete antigens (30). Diisocyanates (31) as well as plicatic acid (32) can make IgE in blood, however, it can be found only in a small proportion of the workers developing OA. Diisocyanate can produce
specific IgG antibodies, and monocyte chemoattractant protein-1 which is more specific and sensitive for OA (31). Moreover, sensitization to diisocyanates can be seen in workers who are exposed to high concentration of the chemical in a spill. It has been suggested that it may cause an epithelial injury, facilitating the penetration of diisocyanates to the underlying tissues and provoke sensitization (30).
The risk of IgE-mediated sensitization to occupational agents may increase with frequent exposures to particularly higher levels of the agents (1, 10). It has been suggested that the level of exposure at a certain time is a more relevant factor than cumulative doses of exposure or current level of exposure for development of OA. For example, in a cohort of Dutch bakers, a bell-shaped exposure-response relationship between the wheat allergen exposure and sensitization and OA was shown (33). Moreover, a case-referent study on a cohort of animal laboratory technicians demonstrated that there was an increase in the risk of sensitization to animal allergens when the allergic symptoms were initially reported within the first 2 years of initial exposure (34).
Inhalation is not the only mean of sensitization, it can also be caused by skin contact as it can be seen in workers exposed to isocyanate (35-37). Inhalation of some substances might produce different pattern of IgE sensitization in different groups. For example, in an exposure to soybean, citizens became sensitized to the LMW-protein components concentrated in the hull (Gly m 1 and Gly m 2) while bakers mostly became sensitized to HMW allergens in the hull and flour(38). The latency period between exposure to causative agents and development of respiratory symptoms that are suggestive of OA can range from weeks to years. The latency for LMW sensitizers (e.g., diisocyanates and plicatic acid) and some HMW sensitizers is within 2 years of
exposure (39, 40). A latency period of ≥2 years can be associated with exposure to some HMW agents such as flour and latex (17, 41, 42).
1.2.Epidemiology of Occupational Asthma
1.2.1. Etiological agents causing occupational asthma
A recent study performed by Association of Occupational and Environmental Clinics (AOEC) provided a web-based listing of agents associated with new onset work-related asthma in adults from 2002 to 2015, and estimated that there are more than 327 occupational agents linked to WRA (43) and this list is constantly growing (44). Typically, based on their molecular weights, these agents are classified into two main groups: high-molecular-weight agents (HMW) (>10 KDa) and low-molecular-weight agents (LMW) (<10 KDa) (45).
1.2.1.1. High-molecular-weight agents
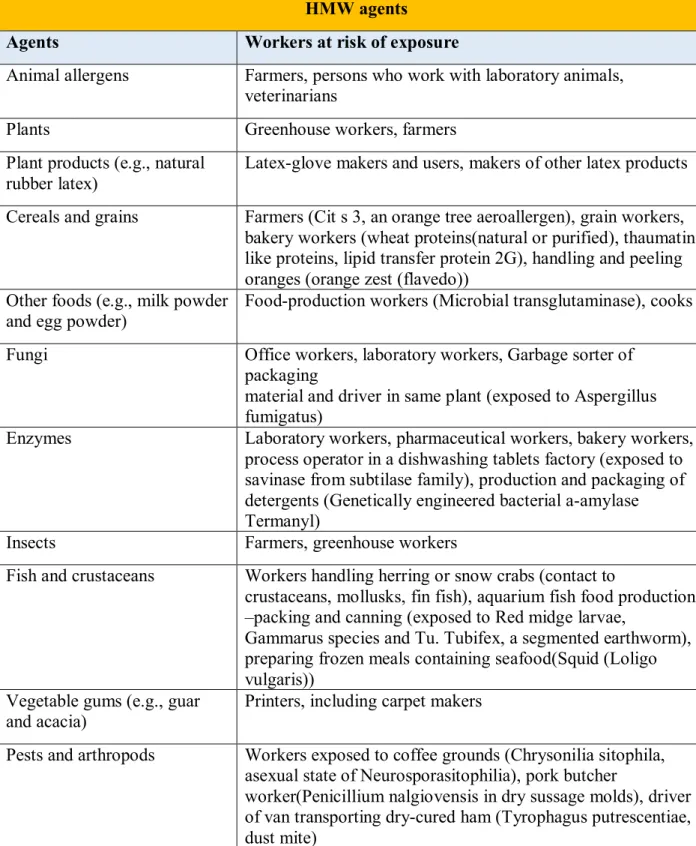
HMW agents induce OA through an IgE-mediated mechanism. Glycopeptides and proteins of animals and plants origins are the most frequent HMW agents inducing OA. Table 1, adapted from Tarlo and Lemière (46), and Cartier (47) summarizes the common HMW allergens causing OA.
1.2.1.2. Low-molecular-weight agents
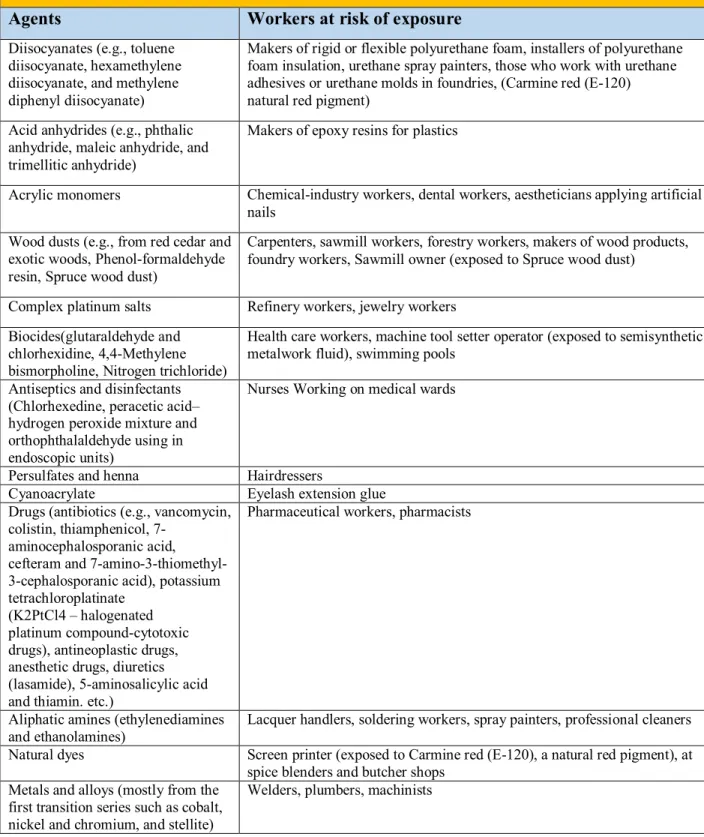
Table 2 summarizes the common LMW agents causing OA (47-65).
The most frequent OA inducing LMW agent is diisocyanate, which may result in an increase in serum level of specific IgE antibodies that is a highly specific but not a very sensitive test for diagnosing OA (66, 67).
TABLE 1. COMMON HMW AGENTS IN SENSITIZER-INDUCED OA HMW agents
Agents Workers at risk of exposure
Animal allergens Farmers, persons who work with laboratory animals, veterinarians
Plants Greenhouse workers, farmers
Plant products (e.g., natural rubber latex)
Latex-glove makers and users, makers of other latex products
Cereals and grains Farmers (Cit s 3, an orange tree aeroallergen), grain workers, bakery workers (wheat proteins(natural or purified), thaumatin-like proteins, lipid transfer protein 2G), handling and peeling oranges (orange zest (flavedo))
Other foods (e.g., milk powder and egg powder)
Food-production workers (Microbial transglutaminase), cooks
Fungi Office workers, laboratory workers, Garbage sorter of packaging
material and driver in same plant (exposed to Aspergillus fumigatus)
Enzymes Laboratory workers, pharmaceutical workers, bakery workers, process operator in a dishwashing tablets factory (exposed to savinase from subtilase family), production and packaging of detergents (Genetically engineered bacterial a-amylase Termanyl)
Insects Farmers, greenhouse workers
Fish and crustaceans Workers handling herring or snow crabs (contact to
crustaceans, mollusks, fin fish), aquarium fish food production –packing and canning (exposed to Red midge larvae,
Gammarus species and Tu. Tubifex, a segmented earthworm), preparing frozen meals containing seafood(Squid (Loligo vulgaris))
Vegetable gums (e.g., guar and acacia)
Printers, including carpet makers
Pests and arthropods Workers exposed to coffee grounds (Chrysonilia sitophila, asexual state of Neurosporasitophilia), pork butcher
worker(Penicillium nalgiovensis in dry sussage molds), driver of van transporting dry-cured ham (Tyrophagus putrescentiae, a dust mite)
TABLE 2. COMMON LMW AGENTS IN SENSITIZER-INDUCED OA LMW agents
Agents Workers at risk of exposure
Diisocyanates (e.g., toluene diisocyanate, hexamethylene diisocyanate, and methylene diphenyl diisocyanate)
Makers of rigid or flexible polyurethane foam, installers of polyurethane foam insulation, urethane spray painters, those who work with urethane adhesives or urethane molds in foundries, (Carmine red (E-120) natural red pigment)
Acid anhydrides (e.g., phthalic anhydride, maleic anhydride, and trimellitic anhydride)
Makers of epoxy resins for plastics
Acrylic monomers Chemical-industry workers, dental workers, aestheticians applying artificial nails
Wood dusts (e.g., from red cedar and exotic woods, Phenol-formaldehyde resin, Spruce wood dust)
Carpenters, sawmill workers, forestry workers, makers of wood products, foundry workers, Sawmill owner (exposed to Spruce wood dust)
Complex platinum salts Refinery workers, jewelry workers Biocides(glutaraldehyde and
chlorhexidine, 4,4-Methylene bismorpholine, Nitrogen trichloride)
Health care workers, machine tool setter operator (exposed to semisynthetic metalwork fluid), swimming pools
Antiseptics and disinfectants (Chlorhexedine, peracetic acid– hydrogen peroxide mixture and orthophthalaldehyde using in endoscopic units)
Nurses Working on medical wards
Persulfates and henna Hairdressers
Cyanoacrylate Eyelash extension glue
Drugs (antibiotics (e.g., vancomycin, colistin, thiamphenicol,
7-aminocephalosporanic acid, cefteram and 7-amino-3-thiomethyl-3-cephalosporanic acid), potassium tetrachloroplatinate
(K2PtCl4 – halogenated platinum compound-cytotoxic drugs), antineoplastic drugs, anesthetic drugs, diuretics (lasamide), 5-aminosalicylic acid and thiamin. etc.)
Pharmaceutical workers, pharmacists
Aliphatic amines (ethylenediamines and ethanolamines)
Lacquer handlers, soldering workers, spray painters, professional cleaners Natural dyes Screen printer (exposed to Carmine red (E-120), a natural red pigment), at
spice blenders and butcher shops Metals and alloys (mostly from the
first transition series such as cobalt, nickel and chromium, and stellite)
1.2.2. Prevalence, Incidence and Population-attributable risk
Occupational asthma is one of the most common work-related respiratory diseases globally (68). The prevalence and incidence of OA vary in different populations due to variation in geographical patterns, type, level and duration of exposure to sensitizing and irritating agents, and preventive methods efficacy (2, 69-74).
Apprentices represent an ideal population for studying the natural course of OA. In an inception cohort of 408 Canadian apprentices exposed to HMW agents (animals, latex, flour, and enzymes), probable OA, defined as the occurrence of new skin sensitization to a program-specific allergen and significant increase in bronchial responsiveness was found in 8.3% of subjects during the apprenticeship, and, 3% post-apprenticeship (75). Furthermore, El-Zein and her collaborators (76) followed 194 apprentice welders for a duration of 15 months in Quebec using assessment of respiratory function with spirometry, methacholine challenge test and questionnaire. The incidence of probable OA was 3%, defined as the presence of at least one lower welding-related respiratory symptoms (cough, wheezing, and/or chest-tightness) and an increase in bronchial responsiveness (a two-fold or ≥3.2-fold decrease in the provocative concentration causing a 20% fall in the forced expiratory volume in one second (PC20) from baseline to the end of the study).
A systematic review of six longitudinal general population-based studies found that OA accounted for about 17.6% of adult asthma (2). Another study estimated that 15% of adult asthma was attributable to the workplace agents, and the incidence of OA was about 22 to 40 cases per million in/among active workers every year (77). Moreover, an international longitudinal study of 13 countries among workers aged between 20-44 years reported that about 10-25% of new asthma diagnoses occurred in an occupational setting. This study used a
job-exposure matrix for evaluating occupational job-exposure to causative agents. After calculation, the authors also found that the incidence of OA was 250-300 cases/million workers/year (78). Based on the medico-legal reports, OA is the most common respiratory disease in Quebec (79). A physician based surveillance system of occupational respiratory diseases (PROPULSE) in Québec estimated that the incidence of the OA was 42 cases/million female workers/year and 79 cases/million male workers/year between October 1992 and September 1993 (80). Moreover, it was estimated that between 1988 and 2002, OA was the second common work-related respiratory disease in Quebec. Consequently the greatest proportion of the workers who were entitled to get compensation from the Commission de la santé et de la sécurité du travail (CSST) belonged to this group (81). The mean cost of OA was estimated to be about 50,000 CAN$ between 1986 and 1988 (82), and 93,000 for the period 1988–2002 (83).
1.2.3. Host risk factors
Age and sex: Advancement in age has been identified to increase the risk of OA among farmers, but this is the only study about this risk factor (84). A higher prevalence of OA has been reported among female subjects compared to male subjects since female workers were more exposed to occupational sensitizers (21.1% of female workers versus 13.4% of male workers) (85). Moreover, the distribution of occupations by sex might explain different types of exposure between men and women. For example, OA due to cleaning agents could be seen more among women (86, 87) while men are at more risk of developing OA due to exposure to epoxy, diisocyanates and acrylate (88).
Atopy: Atopy is a known independent risk factor for OA in exposures due to HMW agents (89, 90) such as flour (91, 92) and animal allergens (93, 94). In the other words, atopic workers are at increased risk of OA in exposure to HMW agents (95). On the other hand, the atopic workers are
not at risk of OA in relation to LMW agents that do not induce asthma through an IgE-mediated mechanism (96). Gautrin and Malo followed the apprentices exposed to HMW agents in Montréal (exposed to flour, laboratory animal allergens and latex). They found that atopy to work-specific agents was associated with a probability of having OA in subjects exposed to animal-based HMW agents (39, 97). However, pre-exposure sensitization to common allergens which are structurally the same as workplace allergens might be a more important determinant of OA than atopy to work-specific agents (93, 97).
BHR and rhinitis: In a cohort study conducted by Omland et al. (98) on 1964 farming-school students and 407 non-farming subjects aged 16 to 26 years, bronchial hyper-responsiveness (BHR) at baseline (OR: 11.7; 95% CI: 2.4 to 56.4) was associated with OA. BHR and rhinitis before entering to workplaces containing HMW agents are the independent risk factors for the development of IgE sensitization to HMW allergens (99). The presence of work-related nasal symptoms during the exposure to sensitizers often proceeds to the development of OA (100, 101). It has been found that 11.4% of those workers exposed to laboratory animal allergens with rhinitis developed OA during the period of 30 to 42 months after the initial exposure (99).
In subjects exposed to HMW agents, an IgE-mediated sensitization leads to the presence of upper respiratory symptoms that precede asthma symptoms: rhinorrhea, ocular pruritus, or nasal congestion. The presence of rhinoconjunctivitis and wheezing are associated with OA in exposure to HMW agents rather than LMW sensitizers (102-104). However, Riu et al. (105) showed that there was an increased risk of rhinitis among adults exposed to occupational LMW agents (OR: 1.4; 95% CI: 1.0 to 2.1).
Genetics: Certain genotypes relate to the presence of human leukocyte antigen (HLA) class II, as well as the genes related to T-helper 2 cells make some individuals more susceptible to OA upon
exposure to HMW and LMW agents (99). It has been proven that workers with certain genotypes are more susceptible, or in contrast, more immune to OA. The pathophysiology of these gene expressions is not clear. It has been hypothesized that as a protective mechanism, some genes play a role in the regulation of the immune system response to causative agents of OA (106). Smoking: It has been documented that smoking increases the risk of OA in welders exposed to metal dust, volatile fumes, and in workers exposed to paper dust (107-109). The confounding role of smoking has not been fully investigated in all epidemiologic studies. It seems that smoking increases the risk of sensitisation to HMW agents but not to LMW agents (110, 111). For example, in a study on snow crab processing workers, smoking was significantly associated with OA (OR: 3.1; 95% CI: 1.3 to 7.4) (112). However, a few studies have reported direct evidence that smoking can increase the risk of OA (112-115).
Others: Ingestion of spice dust by food processing workers (116) and ingestion of grain products by bakers (91) have been reported to be strongly associated with OA in these professions. In contrast, no association has been found between OA and the consumption of seafood among seafood processors (71). Obesity has also been suggested to increase the risk of OA through an uncertain mechanism (92, 117). Moreover, low socioeconomic status is related to exposure to work-related agents and possibly, future OA (118). Further research is needed to explore the nature and magnitude of this relationship.
1.3. Diagnosis and Evaluation of Occupational Asthma
Despite the fact that OA is the most common work-related lung disease in industrialised countries, and the second most common disease reported after pneumoconiosis in developing countries (95, 119), physicians may face some difficulties in diagnosing OA, which will cause
the underestimation of this disease among high risk populations. This may be due to the fact that there is a limited access to an occupational health service, or the health care providers have little knowledge of potential hazard of exposure to workplace agents and therefore do not dedicate enough time in the primary health settings prior to referral. All these causes may delay referring patients with work-related symptoms by physicians (120-122). Chest physicians may also fail to perform appropriate objective tests (121, 123).
The American College of Chest Physicians (ACCP) recommended algorithmic approach for diagnosing OA (5). Following this algorithm, there are several tools that can be used in the diagnosis of OA. Recently, Vandenplas et al. (120) generated an updated algorithmic approach based on the availability and feasibility of the tests in clinical practice (see Figure 2). However, the diagnosis of OA is still challenging and sometimes inappropriately investigated. It might be due to financial and professional concern of the workers (22, 124, 125), a delay in referring the patients with work-related respiratory symptoms to specialist by general practitioners (121), or failure in performing appropriate objective tests or taking proper diagnostic steps by specialists (121, 126).
FIGURE 2. APPROACH TO DIAGNOSIS OF OCCUPATIONAL ASTHMA SUGGESTED BY VANDENPLAS ET AL. (120).
Abbreviations: FEV1, forced expiratory flow in one-second; NSBH, non-specific bronchial hyper-responsiveness; NPV, negative predictive value; OA, occupational asthma; PEF, peak expiratory flow; PPV, positive predictive value; sIgE, specific immunoglobulin E; SPT, skin prick test.
Any diagnostic workup for OA in subjects with work-related respiratory symptoms should begin with diagnosing asthma. For the next step, the link between asthma and occupational exposure should be confirmed by a stepwise approach: the first step is taking the occupational and medical history of the worker suspected to have OA in order to estimate the clinical likelihood of the disease, and the second step is to confirm the relationship between occupational exposure and
occurrence of asthma by combination of different objective tests depending on the availability and feasibility of the tests, which may differ between regions and countries (9, 120, 127).
1.3.1. Medical and occupational history
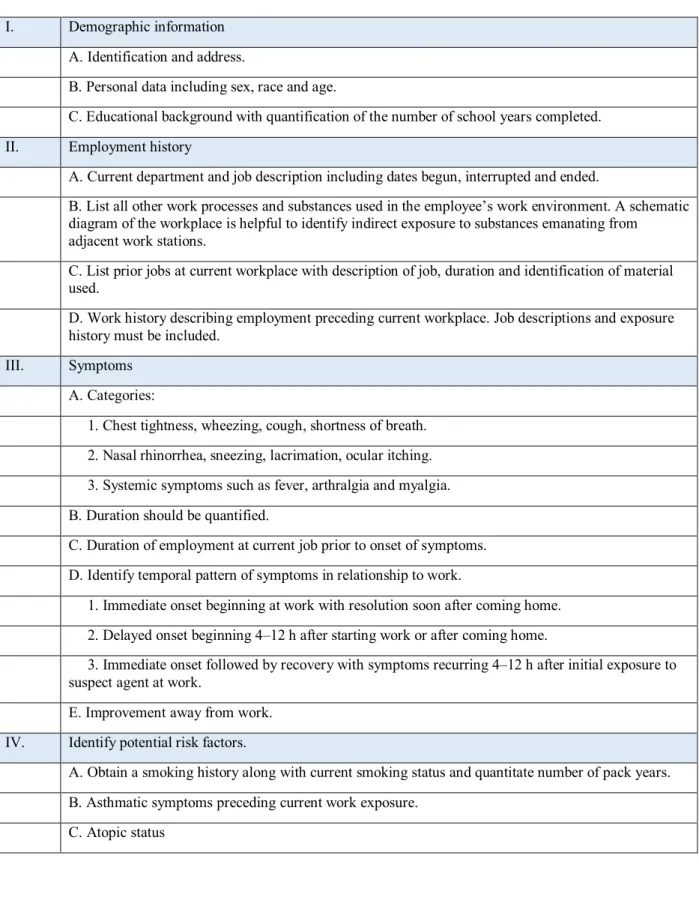
Any assessment of referred workers suspected of having OA should start with taking a thorough and detailed medical and occupational history including information about the workplace in order to recognize possible offending agents, duration of exposure, onset and duration of respiratory symptoms, upper and lower respiratory symptoms, and work impairment due to respiratory symptoms. An incomplete history can delay diagnosis. Notably, patients must be asked about the presentation of the symptoms when away from work to identify the possible late responses to offending agents especially LMW agents (128). Table 3 summarizes the key points of occupational history, extracted from Tan J. et al. (129).
In addition, material safety data sheets (MSDSs) can be used as a complementary tool to identify the physical and chemical characteristics of the sensitizers to which workers are exposed at the workplace (130). They also provide information on generic chemical names, standardized threshold limit values (TLV), and standardized permissible exposure levels (PEL) of causal agents (129, 131). However, they cannot identify all sensitizers particularly if their concentration in the product or in its ingredients is low (i.e., <1%) (17, 132). MSDSs are available at: http://www.msds.com or http://www.ilpi.com/msds.
MDSs must be used with caution. For instance, Heederik et al. (133) estimated an exposure threshold of sensitization to wheat allergens in a population of Dutch bakers. They found that when asthma symptoms were accompanied by sensitization, a steeper exposure–response relationship were observed, which means that the “lowest observed effect levels” were lower
compared to the proposed TLV by American Conference of Governmental Industrial Hygienists (ACGIH).
Typically, the respiratory symptoms might be provoked by starting a work shift and disappear shortly after leaving the workplace or during weekends and holidays (134). Questionnaires for identifying the work-related respiratory symptoms are highly sensitive but have low specificity (6). Vandenplas et al. (102) found that “improvement of symptoms at weekends and on vacations” item used in an “open” questionnaire, which was administered in 212 patients with confirmed OA by specific inhalation challenge (SIC), had a sensitivity of 75% and a specificity of 55% for diagnosing OA. Generally, this “open” questionnaire falsely categorised 8% of the OA subjects as non-OA and 34% of non-OA subjects as having OA. Previously, Malo et al. (135) found that improvement of symptoms at weekends and on vacations had sensitivities of 77% and 88% and specificities of 44% and 24%, respectively. They also found that an “open” questionnaire had a sensitivity of 87%, but a specificity of only 27% for diagnosing OA. They concluded that the low specificity of the questionnaire might be due to the fact that workers without OA might develop respiratory symptoms during the work period similar to the workers with OA, or some individuals without OA might experience an improvement of the symptom when away from work similar to those individuals with a definite diagnosis of OA. Given the low positive predictive value (PPV) and the negative predictive value (NPV) of the open questionnaire (63% and 83%, respectively), it can be concluded that the open questionnaire is not a satisfactory tool for diagnosing OA and other objective means of diagnosis must be used (135). Workers may also falsify questionnaires because of the fear of losing their jobs (124).
Moreover, irritant-induced asthma may have variable clinical presentations. For example, workers exposed to diisocyanates may represent a late airway response with lack of correlation with the workplace or duration of exposures (129).
Pralong et al. (136) evaluated the capacity of the Occupational Asthma Screening Questionnaire– 11 items (OASQ-11) to screen patients with suspicion of having OA in the clinical setting. The prevalence of OA was 12% in the population that underwent the analyses. The final proposed models composed of eight symptoms (i.e. wheezing, dyspnea, cough, asthma attack, asthma medication, cough at work, wheezing at work, chest tightness at work), age, and exposure duration could identify 89% of the OA cases. Developing a distinct prediction model in the same population on the basis of the same questionnaire for prediction of WEA showed that the questionnaire items, which showed good sensitivity (e.g. wheezing) in OA prediction model, did not showed enough sensitivity in predicting WEA (137). This shows that it is important to develop different models for prediction of OA and WEA.
TABLE 3. KEY ELEMENTS OF THE OCCUPATIONAL HISTORY IN THE EVALUATION OF OCCUPATIONAL ASTHMA
I. Demographic information A. Identification and address.
B. Personal data including sex, race and age.
C. Educational background with quantification of the number of school years completed. II. Employment history
A. Current department and job description including dates begun, interrupted and ended.
B. List all other work processes and substances used in the employee’s work environment. A schematic diagram of the workplace is helpful to identify indirect exposure to substances emanating from
adjacent work stations.
C. List prior jobs at current workplace with description of job, duration and identification of material used.
D. Work history describing employment preceding current workplace. Job descriptions and exposure history must be included.
III. Symptoms A. Categories:
1. Chest tightness, wheezing, cough, shortness of breath. 2. Nasal rhinorrhea, sneezing, lacrimation, ocular itching. 3. Systemic symptoms such as fever, arthralgia and myalgia. B. Duration should be quantified.
C. Duration of employment at current job prior to onset of symptoms. D. Identify temporal pattern of symptoms in relationship to work.
1. Immediate onset beginning at work with resolution soon after coming home. 2. Delayed onset beginning 4–12 h after starting work or after coming home.
3. Immediate onset followed by recovery with symptoms recurring 4–12 h after initial exposure to suspect agent at work.
E. Improvement away from work. IV. Identify potential risk factors.
A. Obtain a smoking history along with current smoking status and quantitate number of pack years. B. Asthmatic symptoms preceding current work exposure.
1. Identify consistent history of seasonal nasal or ocular symptoms. 2. Family history of atopic disease.
3. Confirmation by epicutaneous testing to a panel of common aeroallergens.
D. History of accidental exposures to substances such as heated fumes or chemical spills.
1.3.2. Diagnostic tests
To make a valid diagnosis of asthma, some complementary tests can be done. In this section, different diagnostic tools used in clinical and laboratory setting are discussed.
1.3.2.1. Immunological tests (skin-prick test (SPT) for specific work-related allergens or blood specific IgE measurement)
Skin-prick test (SPT) is used to detect sensitization to work-related allergens via an IgE-mediated pathway or type I hypersensitivity reaction. A positive test is defined as the presence of cutaneous reactivity, a ≥3 mm diameter wheal, 15-20 minutes after the application of the specific allergen extracts in the absence of any reaction to the diluent (glycerine, 50%) and in the presence of a positive reaction to histamine phosphate (1/200 mg/ml) (138). Test extracts for many of HMW and LMW agents are not commercially available and lack standardization and validity (10, 120).
SPT shows a high sensitivity and a low specificity for detecting OA in workers exposed to HMW agents (128). A positive test confirms the sensitization to a HMW agent but not the presence of OA because the PPV is very low (17). A negative test makes the diagnosis of OA very unlikely (17). For LMW agents, the sensitivity and specificity of SPT in detection of sensitization is lower than HMW agents as the immunologic pathway to OA caused by LMW agents is not well-known. Only a few LMW agents are associated with OA through an IgE-mediated mechanism, such as acid anhydride compounds, chloramine, persulfates, reactive dyes, and platinum salts
(10, 139). However, since the test extracts are not standardized (9) or do not have enough potency and reliability (140), incorrect results are likely to be generated. SPT is not commonly performed in clinics for diagnosing OA induced by LMW agents (140). Thus, in vitro tests such as basophil histamine release or assay of monocyte chemoattractant protein-1 by peripheral blood mononuclear cells might provide a higher sensitivity and specificity; however, they are not sufficient for a definite diagnosis of OA since they have not been validated in clinical settings (17, 141).
Vandenplas et al. (142) investigated the validity of SPT and IgE test in workers exposed to latex. They found that compared to the result of the SIC test, SPT had the sensitivity and specificity of 100% and 21%, respectively. All SIC-positive and 79% of SIC-negative workers had positive SPT results. A systematic review including 77 studies used SIC as the “reference standard” found that the pooled sensitivity of SPT and serum IgE level was >73% for diagnosing OA in workers exposed to HMW agents (127). However, specific IgE level of the serum showed a higher specificity (pooled estimate: 79.0%; 95% CI: 50.5% to 93.3%). For LMW agents, SPT showed a higher sensitivity for detection of OA when combined with methacholine challenge test (pooled estimate: 100%; 95% CI: 74.1% to 100%). However, the specificity of SPT and serum specific IgE were almost equal (pooled estimate: 88.9% and 86.2%, respectively). This review concluded that in the absence of the specialized tests such as SIC, a combination of methacholine challenge test with SPT or a measurement of IgE serum level can be used for diagnosing OA. Moreover, Park et al. (143) found that in 42 workers with confirmed OA who were exposed to reactive dyes, the sensitivity of the SPT and serum IgE was 91% and 86%, respectively. The PPV was 80% and 63% and NPV was 89% and 80%, respectively for SPT and
serum IgE test. These results show that SPT has more reliable results than serum IgE measurement for the screening of OA.
In conclusion, as SPT shows a high sensitivity and a low specificity for diagnosing OA, it must be used in conjugation with other confirmatory tests (6, 127, 138). It has been suggested that a positive SPT to HMW agents combined with a positive methacholine challenge can increase the probability of the diagnosis to >90% in workers with an occupational and clinical history suggestive of OA (17), although a negative combined test results does not provide an adequate negative predictive value for ruling the disease out (127). SPT is recommended to be used as a diagnostic tool for HMW agents (evidence level A)1, while it is moderately recommended for detection of OA in subjects exposed to LMW agents (evidence level B) (144).
1.3.2.2. Respiratory function tests
1.3.2.2.1. Serial peak expiratory flow rate recording
Peak expiratory flow (PEF), one of the recommended first-line tools for diagnosing OA, is both a sensitive and a specific tool, at the same time, inexpensive and reproducible (10, 45, 145). It can be used to assess reversible bronchial obstruction in individuals who are currently working and are exposed to “routine levels” of the causative agents, when they are at or away from work (146, 147).
PEF can be used to measure airflow limitation in subjects with suspected OA and shows a high specificity and sensitivity if done in a serial pattern (6). The desirable frequency of PEF measurement has been investigated in many studies but it is still controversial (148-150). A more
1 “Recommendations were graded from (A) to (C) in favor and against the specific diagnostic test or treatment, with
frequent and longer measurements of PEF increase the specificity and sensitivity of the test but decrease the accuracy of the test due to errors in recording. Recently, the recording period of 4 weeks with at least one week away from work has been recommended (128, 151, 152). If the number of the PEF recordings is less than 4 times per day, or PEF recording is done for less than 3 weeks, the diagnostic value of this test will fall (128, 151). The use of respiratory-related medications should be minimal and the working shift patterns should be unchanged. Any changes in work shifts or new exposure to irritants or respiratory infections during the testing period must be recorded as it can influence on the accuracy of interpretations (10). Anees et al. (150) found that the PEF recording of 3 consecutive workdays in any work period and at least four readings per day for a total of 3 weeks, could produce a sensitivity of 78% and specificity of 92% for diagnosing OA. Moore et al. (153) found that a PEF recording of 8 times per day during 8 workdays and 3 rest days could result a specificity of 91% and sensitivity of 68% for diagnosing OA.
PEF rates recording at and away from the workplace are compared by an expert or by the aid of OASYS software (Occupational Asthma System) in order to detect any decline in pulmonary function caused by exposure to work-related agents (148, 154, 155).
The visual interpretation of PEF results is more reliable and is considered as significant if there is ≥20% change in the mean values at work compared to the mean values away from work (120, 156). Anees et al. (157) found that the mean PEF difference of ≥16 L/min between workdays and rest days was a significant index for distinguishing workers with OA from those without OA (sensitivity of diagnosing: 70%). A systematic review of more than 31 studies found that the pooled sensitivity and specificity of serial PEF recording for the diagnosis of OA were 82% (95% CI: 76% to 90%) and 88% (95% CI: 80% to 95%), respectively (158).
The interpretation of PEF results can be difficult due to exposure to unknown causal agents, low compliance of the patients, severe asthma (17), and a decreased level of exposure due to relocation of the workers to an area with lower concentration of the offending agents (10). As a result, it is moderately recommended to use this tool for diagnosing WRA when a patient has already been diagnosed by other diagnostic tools (evidence level B) (144).
1.3.2.2.2. Pre and post-exposure specific inhalation challenge test
Specific inhalation challenge (SIC) is considered as the reference test for diagnosing OA (10). When the results of the available objective tests are equivocal, or a worker is exposed to more than one sensitizer, the SIC can help in identifying the causal agent and in clarifying the final diagnosis of sensitizer-induced asthma (10, 159, 160). The evidence-based guidelines issued by the British Occupational Health Research Foundation (BOHRF) acknowledged that: ‘‘a carefully controlled SIC comes closest to a gold standard test for some agents causing OA’’, but ‘‘a negative test in a worker with otherwise good evidence of OA is not sufficient to exclude the diagnosis’’ (90). The consensus statement issued by the ACCP recommended that: ‘‘in individuals with suspected sensitizer-induced OA, conducting SIC (where available) is suggested when the diagnosis or causative agent remains equivocal’’ (10). In Québec, SIC is the recommended method to confirm the diagnosis of OA (8).
Indications and contraindications of SIC
Based on the consensus statement provided by ERS Task Force, the indication for performing SIC in a patient suspected of OA are as follows: “1) confirmation of the diagnosis of occupational asthma when other objective methods are not feasible, are less efficient or have failed to provide definitive results; 2) identification of the cause of occupational asthma when other objective methods are not feasible, are less efficient or have failed to provide definitive
results; 3) the identification of a new (not formerly described) specific cause of occupational asthma; and 4) research into the mechanisms of work-related asthma” (161, 162).
The contraindications of the SIC are as follow: severe airway obstruction, baseline forced expiratory volume in one second percent predicted (FEV1%) ≤70%, unstable asthma, unstable or recent cardiovascular disorders, uncontrolled epilepsy, recent respiratory tract infection (<4 weeks), pregnancy, IIA, lack of trained staff and specialized facilities and equipment, and patient’s inability to understand the procedures (10, 161, 163-165).
SIC procedure
The goal of this procedure is to expose a subject to a suspected causal agent in order to produce a fall in forced expiratory volume in 1 second (FEV1), an increase in bronchial responsiveness, and/or an increase in inflammatory markers of the respiratory tract (166, 167). There is no standardized protocol for the use of SIC. A “realistic” approach was initially developed by Pepys and Hutchcroft (10, 168). In this method, it is aimed to reproduce the exposure to work-related agents in respect to the chemical and physical characteristics of the agents. The concentration of the probable agents is not directly measured; instead, duration of challenge exposure is considered as the surrogated of the dosage of the agent (169). Therefore, this method can lead to misleading results due to lack of tight control on the concentration and dose of the agent (170, 171). Consequently, closed-circuit apparatuses have been developed where the concentration and dose of the inhaled agent can be continuously measured throughout the procedure. The latter method presents less immediate asthmatic reactions and more safety (172). The cessation of inhaled corticosteroid before the SIC is still controversial.
Patients must stop taking theophylline, inhaled bronchodilators, leukotriene receptor antagonists, cromoglycate and antihistamines before the test according to their duration of action (163, 173).
It is also recommended to withhold the oral or inhaled corticosteroids 72 hours before the SIC since they might diminish the bronchial responsiveness to sensitizers (161, 174-176).
SIC consists of three or four days of control and challenge:
The control day is a day without any exposure to work-related sensitizers. The baseline FEV1 values using spirometry and/or PEFs using portable instruments are measured after 30-60 minutes of exposure to a control agent for a period of 6-8 hours (161, 163, 164). The control agent is an irritant and/or an agent with the same physical characteristics of the suspected occupational agent causing OA. The control agents may be selected among the following various agents: “lactose powder for SIC with agents in powder form (flour, drugs and persulfate); pine dust for SIC with wood dusts; vinyl gloves for SIC with latex gloves; and solvents for polyurethane products and other resins” (161, 169). The purposes of the control day are to verify the functional stability which is important for interpretation of FEV1 variability after exposure to the suspected agent, to provide a comparison for any bronchial reaction on the challenge day, and to detect any non-specific irritant reaction to control agent which would suggest an irritant reaction to the suspected agent that cannot meet the definition of a specific bronchial hyperreactivity (161, 177).
On the challenge day, patients are exposed to the suspected occupational agents with the levels lower than occupational exposure limits (OEL) to prevent severe asthmatic reactions and/or irritant responses (161). The suspected agent must be delivered with the same chemical and physical characteristics of the agent to which a worker is exposed in the workplace (168). The duration of exposure to HMW agents can be increased progressively on the first challenge day until an immediate bronchial reaction or until the maximum duration of exposure is reached. For LMW agents, the duration of exposure must be increased gradually in a period of 2 days with a
cumulative exposure limited to <30 min on the first challenge day (161, 163, 178) in order to avoid severe late asthmatic reactions (179).
FEV1 values are measured immediately after exposure to suspected agent, and every 10 minutes during the first hour after the exposure, twice during the second hour after exposure, and then hourly for the following 6 hours, for the total of at least 8 hours in order to record any relapsing bronchospasm (169, 180).
Non-specific bronchial hyper-responsiveness (NSBHR) using methacholine challenge test are measured before (on the control day) and should be reassessed at the end of SIC, particularly if SIC indicate no significant changes in airway calibre (9, 161). The purpose of NSBHR measurement is to decrease the risk of false-negative results especially when there is no significant change in NSBHR post-SIC. If there is a significant change in NSBHR compared to the baseline values (i.e. more than two- to three-fold reduction in post-challenge PC20/provocation dose causing a 20% fall in FEV1 (PD20) values compared to baseline), a repeated challenge must be performed before excluding the diagnosis of OA (9, 161, 181). Sputum eosinophil count is measured on the control day and on the last day of exposure to the suspected agent. If there is a >3% increase in sputum eosinophilia compared to baseline value, there is a possibility of having an asthmatic reaction after another challenge day (182). Recently, Racine et al. (183) investigated the diagnostic accuracy of this test before and after SIC. They found that a sputum eosinophil count is less effective than a methacholine challenge test for diagnosing OA. Moreover, a post-SIC sputum eosinophilia is more accurate than a positive methacholine challenge for distinguishing workers with and without OA (AUC = 86%; 95% CI: 0.8-0.9, P < .001; AUC = 69%; 95% CI: 0.6-0.8, P = .010, respectively).
Notably, if the FEV1 fluctuation in the control days is ≥10%, the challenge must be stopped as it is considered instable asthma (161). Moreover, it is beneficial to distinguish non-specific irritant reactions in exposure to control agents from specific BHR in exposure to specific work-related sensitizers since it may lead to falsely positive SIC results (161, 177).
Another day of active challenge test may proceed the second challenge day if the changes in FEV1 are equivocal or negative and challenge with a higher dose is considered appropriate, or when there is a significant increase in sputum eosinophils or in fractional exhaled nitric oxide (FeNO) after the challenge, or there is a more than two- to three-fold reduction in post-challenge PC20 values compared to baseline values on the control day (184, 185).
SIC interpretation
A ≥15-20% of sustained fall in FEV1 value (PC20) recorded in two consecutive assessments is considered as positive SIC test if the fluctuation of FEV1 6-8 hours after the exposure during the control day is <10% (161, 169). It has to be consistent with an asthmatic reaction. No SIC should be considered as negative unless the challenge lasted for at least 240 minutes without ≥20% fall in FEV1 (169).
If the results of FEV1 are inconclusive, in the presence of the following conditions, another challenge day must be repeated before excluding the diagnosis of OA:
1) a significant change in NSBHR (two to three-fold reduction in post-challenge PC20 compared to baseline value) (181, 185);
2) an sputum eosinophilia of >3% compared to baseline value (161);
3) a post-challenge increase in FeNO of >30–40% compared to pre-challenge value (161, 186, 187) an increase >20% for baseline values over 50 ppb or >10 ppb for values lower than 50 ppb (188).
SIC limitations
Although a positive test confirms OA, the negative test does not rule out diagnosis of OA (17). The major challenge in SIC is the possibility of the production of negative and false-positive results.
False-negative results also can occur in the absence of specific bronchial responsiveness to offending agent when away from exposure, inadequate or false timing and concentration of exposure, and usage of asthma-specific medications before the challenge (10, 161). Lemière et al. found that after cessation of exposure to sensitizers, specific bronchial responsiveness to HMW and LMW agents may decrease but never completely disappears in most of the cases unless the NSBHR may normalize (189), although the required dosage of the occupational agents for the production of a positive SIC will significantly increase (190). As a result, in patients with negative SIC (no significant change in FEV1 values) and/or a decrease in specific bronchial responsiveness, it is recommended to increase the duration of challenge or the concentration of the suspected occupational agent (169). It is also recommended to measure the NSBHR level (185) and sputum eosinophilia (182) before and after the challenge as it might lead to repeating the challenge that ultimately helps accurate diagnosis of OA by reducing the number of false-negative results.
Another challenge in interpretation of the SIC is false-positive results. Mostly, the false-positive results are due to non-specific bronchoconstriction associated with exposure to irritants stimuli, which may mimic the same pattern due to exposure to sensitizers (10, 15, 90, 161). False positive results can be prevented by reducing non-specific reactions. This can be reach by exposing workers to a control agent in order to identify those who may produce non-specific reactions, and also by exposing the subjects to concentrations below the OEL (161).