HAL Id: hal-02449190
https://hal.archives-ouvertes.fr/hal-02449190
Submitted on 22 Jan 2020
HAL is a multi-disciplinary open access
archive for the deposit and dissemination of
sci-entific research documents, whether they are
pub-lished or not. The documents may come from
teaching and research institutions in France or
abroad, or from public or private research centers.
L’archive ouverte pluridisciplinaire HAL, est
destinée au dépôt et à la diffusion de documents
scientifiques de niveau recherche, publiés ou non,
émanant des établissements d’enseignement et de
recherche français ou étrangers, des laboratoires
publics ou privés.
The effects of information and action automation on the
complacency phenomenon
Eugénie Avril, Jordan Navarro, Julien Cegarra
To cite this version:
Eugénie Avril, Jordan Navarro, Julien Cegarra. The effects of information and action automation
on the complacency phenomenon. The 31st European Conference on Cognitive Ergonomics (ECCE
2019), Sep 2019, BELFAST, France. pp.53-56, �10.1145/3335082.3335098�. �hal-02449190�
The effects of information and action automation on the complacency phenomenon
Eugénie Avril
Département des sciences humaines et sociales, Université de Toulouse, INU Champollion, Albi, France. Eugenie.avril@univ-jfc.fr
Jordan Navarro
Département des sciences humaines et sociales, Université Lumière Lyon 2, Bron, France. Institut Universitaire de France, Paris, France. Jordan.navarro@univ-lyon2.fr
Julien Cegarra
Département des sciences humaines et sociales, Université de Toulouse, INU Champollion, Albi, France. Julien.cegarra@univ-jfc.fr
ABSTRACT
Automated systems are becoming increasingly prevalent in our societies. Several authors have identified the existence of the complacency phenomenon in supervision tasks, which imply automation execution or industrial computer support. The purpose of this study was to investigate failures of cooperation between human operator and automation. In this paper, we focused on the complacency as a low degree of suspicion towards the proposals of automation, leading to a monitoring deterioration. The main objective was to compare two types of automation, action automation vs information automation, in complacency. We recruited 96 participants to complete three tasks from the Multi-Attribute Task Battery. We found an effect of two types of automation on performance. Detection rate and reaction time were better when failures were reported by information automation than when it was not reported. Eye movements data showed that the automated task was less monitored when the reliability of information was high. We did not find an effect of reliability on NASA TLX score. Finally, we found that information automation can lead to complacency phenomenon.
CCS CONCEPTS
Human-centered computing—Human computer interaction (HCI)—HCI design and evaluation methods—Laboratory experiments
Human-centered computing—Interaction design—Empirical studies in interaction design
KEYWORDS
Complacency, human-machine interaction, automation failures, reliability, interface, eye movements
https://doi.org/10.1145/3335082.3335098
1 Introduction
For some years now, we have witnessed an increase in automation in our daily lives. These systems are present through action automation rather than human operator (e.g., aircraft piloting) and through information automation that pre-processes and displays information (e.g., an interface). In a dynamic situation, automation usually executes an action and due to time pressure, some tasks are delegated to the automation to facilitate human decision-making. However, in a static situation – such as the planning delivery in the transportation domain – time pressure is of secondary importance. The automation effort is more focused on the simplification of the data to be considered by the human operator (Cegarra and Van Wazel, 2012). A theoretical model that clearly distinguishes the functions of automation related to action and information was developed (Parasuraman, Sheridan and Wickens, 2000). Although information automations are present everywhere through interfaces (visual indicator, smartphone, etc.), the consequence of their use on the human operator are not fully understood. These information automations improve the external representation and pre-process data. However, their use can cause difficulties and is not without consequences. The failures in human-machine cooperation in terms of action automation have already been shown in a dynamic situation (Parasuraman and Riley, 1997). Therefore, it is necessary to investigate these failures in information automation. Designers need to understand these failures to consider the consequences in the design of the interface. The phenomenon of complacency is one of the possible consequences that has emerged in multitasking situations (Parasuraman and Manzey, 2010). It is defined as a low degree of suspicion towards the proposals of automation, leading to suboptimal monitoring. This phenomenon appears in a situation in which human monitors automation (1), the frequency of this monitoring is lower than a standard or optimal value, and (3) performance is
affected because of the suboptimal monitoring (3). The complacency phenomenon was investigated mainly in laboratory experiments by manipulating the reliability of automation (Parasuraman, Molloy and Singh, 1993). More specifically, decreases in detections of automation failures and increases in response times were evidence of complacency, as demonstrated in several studies (Bagheri and Jamieson, 2004).
The purpose of this study was to investigate the phenomenon of complacency with information automation. The design of human-computer interaction will also be proposed. With this research, we aimed to extend the studies on the reliability of automation by adding information automation and considering two levels of reliability (0 and 100%). Specifically, we compared two types of automation (action vs. information) and four levels of reliability of automation (0, 56.25, 87.5, or 100%). The level 0% represents a control condition without automation and 100% level represents perfect automation. The addition of these two levels allowed us to compare low and high levels of automation.
Our first hypothesis proposed an effect of the level of reliability on the time allocated to the automated task, suggesting that when reliability was high, the participants spent less time on the automated task (Bagheri and Jamieson, 2004). Our second hypothesis proposed that performance (detection number) and reaction time were low when failures were not reported by information automation (Rovira, Zinni and Parasuraman, 2002). Our third hypothesis was that mental workload score was higher when reliability was low (Parasuraman, Molloy and Singh, 1993)
2 Method
2.1 Participants
Overall, 96 participants (69 women and 27 men) aged 18 to 27 years from the Institut National Universitaire Jean François Champollion participated in the experiment. They had no visual acuity problems.
2.2 Apparatus and materials
2.2.1 The Multi-Attribute Task Battery
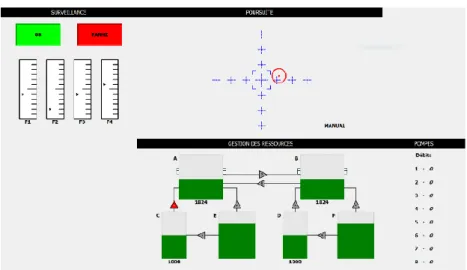
The MATB (Comstock Jr and Arnegard, 1992; Santiago-Espada, Myer, Latorella and Comstock Jr, 2011) is a micro-world composed of several simultaneous tasks. A modified version named OpenMATB was used in this study. This micro-world comprises three tasks, a monitoring task consisting of four vertical gauges with a cursor fluctuating in each gauge. Sometimes, the cursor was stuck in the lower or the upper part of one of the gauges (indicating system malfunction) and the “warning” light changed to red (the top left in Figure 1). This was the focus of the experiment. The other two tasks consisted of a tracking task in which the participants had to keep a cursor in a target area (on top center in Figure 1) and a resource management task in which participants had to control a system of pumps to maintain two tanks (A and B) that were continually depleting at 2500 L (on the bottom center in Figure 1).
The tasks were performed on a standard computer. A joystick was used for the tracking task and a keyboard for the monitoring and the resource management tasks. Eye movements were recorded using an SMI Eye-tracker.
Figure 1. Screenshot of the OpenMatb 2.2.2 Design
The experiment focused on automation type (action automation vs. information automation) and automation reliability.
Action automation related to the visualization of cursors of each gauge in the monitoring task. More precisely, successful action automation meant that the cursor unblocked itself when system malfunctioned. Conversely, when the action automation did not successfully fix a system malfunction, the participant had to manually unblock the cursor (with the F1, F2, F3, or F4 according to the malfunctioning gauge).
Information automation related to a red warning light. More precisely, when information automation was successful, the light changed to red when a system malfunctioned. If the information automation were not successful, the light did not change red during the system malfunction when the action automation itself operated successfully.
Moreover, we manipulated four levels of automation reliability for each type of automation (0%; 56.25%; 87.5%; 100%). Automation was unreliable if it failed to correct or detect a system malfunction. The reliability corresponded to the percentage of the total number of failures detected and corrected by the automation. There were 16 failures in total per ten-minute block.
Table 1 Reliability of both automations
Level System malfunction corrected
(action automation) or reported (information automation)
Total system malfunction
0 % 0 16
56.25 % 9 16
87.5% 14 16
100 % 16 16
Only the monitoring task was automated in our experiment. Each participant performed only one condition, being exposed to one level of information automation (between-subject) and all the levels of action automation (within-subject). The action automation has been repeatedly supported with between-subject conditions (Bagheri and Jamieson, 2004; Singh, Sharma and Parasuraman, 2000). This study focused more on the automation of information; therefore, we chose this design. Moreover, we were limited by the number of potential participants.
2.3 Procedure
The different tasks of the MATB were first explained to the participants. Subsequently, 10 minutes were allotted to the training period, followed by 40 minutes allotted to the experiment. The experiment included four periods of 10 minutes that were counterbalanced (within-subject condition).
2.4 Measures
The first dependent variable was the time spent, as recorded with the SMI eye tracker at 1000hz. We previously defined the Area of Interest (AOI) as the different tasks of the MATB. Therefore, the time spent on each task was equivalent to the amount of time in each AOI.
The second dependent variable was the performance that was evaluated in each task. In the monitoring task, the number of detections/corrections of system malfunction (“hit”) was recorded. In the tracking task, we recorded the proportion of time during which the cursor was located within the target area. In the resource management task, we recorded the average of the absolute differences from the target level (2500L) for the two main reservoirs (A and B).
The third dependent variable was the subjective measure. We used a computerized version of NASA TLX to assess mental workload (Hart and Staveland, 1988).
3 Results
3.1 Gaze behaviors
On average, the monitoring task was more supervised with low reliability of information automation (280 s at 0%, 270 s at 56.25%) than with high reliability (191 s at 87.5 and 157 s at 100%). A simple ANOVA showed a main effect of reliability of information automation of the time spent on the monitoring task, F(3,92) = 5.453, p <.01, η2 = .151.
Mean values for action automation were similar (57 s, 57 s, 54 s and 55 s for the level 0, 56.25, 87.5 and 100%). No effect was found for the reliability of action automation for the monitoring task, (p = .511).
For the tracking task, a simple ANOVA showed no effect of information automation on time spent on tracking task (p = .274). The mean values were higher for high reliability of information automation, but this result was not
statistically significant (203 s, 221 s, 236 s, 242 s for the 0, 56,25, 87,5 and 100% levels). However, the effect for the action automation reliability was significant, F(3,92) = 3.939, p < .01, η2 = .041. The mean values were 218 s, 220s, 229
s, 233 s for the 0, 56.25, 87.5, and 100% levels respectively. The participants spent more time in the tracking task when the reliability of action automation was high (on the monitoring task).
For the resource management task, the effect of the reliability of information automation on the resource management task was non-significant (p = .857). The mean values were similar (173 s, 173 s, 160 s, 174 s). However, a significant effect was found for the reliability of action automation on the time spent on the resource management, F(3,92) = 4.083, p <.01, η2 = .042, with the means of 178 s, 168 s, 169 s, and 164 s.
3.2 Performance and reaction time
1.1.1 Performance
For the monitoring task, performance data was grouped into two categories: failures reported by information automation and failures that were not reported.
A repeated ANOVA showed the main effect of action automation on detection rate when failures were reported by information automation, F(3,71) = 8.234, p <.001, η2 = .104. The mean performance values were .96, .97, .99, and 1 for
the different reliability levels, respectively. A repeated ANOVA showed the main effect of action automation on detection rate when failures were not reported by information automation, F(3,71) = 61.60, p <.001, η2 = .465. The
mean performance values were.60, .82, .93, and 1 for the reliability levels, respectively.
For the tracking task, a repeated ANOVA showed no effect of information automation on performance (p = .965). The mean performance values were.38, .38, .37, and .39 for levels 0, 56.25, 87.5, and 100%, respectively. However, the main effect of the reliability of action automation on the performance was significant, F(3,92) = 3.463, p <.05, η2 =
.036. The mean performance values were.37, .38, .39, and .39 for levels 0, 56.25, 87.5, and 100%, respectively.
1.1.2 Reaction time
A repeated ANOVA showed the main effect of reliability of action automation on reaction time when failures were reported, F(3,71) = 141,447, p < .001, η2 = .666. The mean reaction times were 2,88 s, 1,86 s, 1,30 s, and 1 s for levels
0, 56.25, 87.5, and 100%, respectively. The main effect of reliability of action automation on reaction time when failures were not reported was significant, F(3,71) = 201,285, p < .001, η2 = .739. The mean reaction times were 5.94
s; 3.29 s; 1.46 s and 1 for levels 0, 56.25, 87.5 and 100%.
3.3 Mental workload
A simple ANOVA showed no effect of information automation on the NASA TLX score (p = .194). The mean values were 5.43, 5.34, 5.22, and 5.92 for levels 0, 56.25, 87.5 and 100%, respectively. A simple ANOVA showed no effect of the reliability of action automation, (p = .856). The mean values were 5.44, 5.48, 5.52, and 5.48 for levels 0, 56.25, 87.5, and 100%, respectively.
4 Discussion
Consistent with another study on action automation, information automation lead to a different allocation of visual resources to the secondary tasks (tracking and resource management). In accordance with other studies (Oakley, Mouloua and Hancock, 2003; Rovira, Zinni and Parasuraman, 2002), our results suggest that information automation increases the performance and decreases the reaction time when failures are reported. When failures are not reported, the reaction time increases and the performance decreases. These results suggest that the participants developed a complacency with information automation. They missed the system malfunction when information automation failed, or their reaction to the system malfunctions was slower. Moreover, the automated task was less monitored (12.5%) compared to the other tasks (Tracking task 50%; Resource management 37.5%). Concerning the mental workload, we found no effect of automation on the NASA TLX score. We assume that the NASA TLX does not necessarily easily captures small changes in a long task (Cegarra and Chevalier, 2008). Moreover, the participants did not receive any feedback which may lead to difficulty in assessing workload.
These results showed that the functions described by Parasuraman et al. (2000) can lead to failures in cooperation between people and automation, like the phenomenon of complacency. This study is the first to investigate the phenomenon of complacency, and more studies on the topic are needed to increase our understanding of the complacency with information automation. Designers of the interface should be aware of possible failures in the human-machine interaction. The transparency of automation probably have to consider the role of complacency in futures studies (Wright, Chen, Barnes, and Hancock, 2017).
ACKNOWLEDGMENTS
This study was supported by ANR (ANR-16-CE26-0017) with the Smart Planning Project.
Bagheri, N., and Jamieson, G. A. (2004). Considering subjective trust and monitoring behavior in assessing automation-induced “complacency.”. Human performance, situation awareness, and automation: Current research and trends, 54-59.
Cegarra, J., and Chevalier, A. (2008). The use of Tholos software for combining measures of mental workload: Toward theoretical and methodological improvements. Behavior Research Methods, 40(4), 988–1000.
Cegarra, J., and van Wezel, W. (2012). Revisiting decision support systems for cognitive readiness: A contribution to unstructured and complex scheduling situations. Journal of Cognitive Engineering and Decision Making, 6(3), 299– 324.
Comstock Jr, J. R., and Arnegard, R. J. (1992). The multi-attribute task battery for human operator workload and strategic behavior research.
Hart, S. G., and Staveland, L. E. (1988). Development of NASA-TLX (Task Load Index): Results of empirical and theoretical research. In Advances in psychology (Vol. 52, p. 139–183). Elsevier.
Oakley, B., Mouloua, M., and Hancock, P. (2003). Effects of automation reliability on human monitoring performance. Proceedings of the Human Factors and Ergonomics Society Annual Meeting, 47, 188–190. SAGE Publications Sage CA: Los Angeles, CA.
Parasuraman, R., and Manzey, D. H. (2010). Complacency and bias in human use of automation: An attentional integration. Human factors, 52(3), 381–410.
Parasuraman, R., Molloy, R., and Singh, I. L. (1993). Performance consequences of automation-induced complacency. The International Journal of Aviation Psychology, 3(1), 1–23.
Parasuraman, R., Sheridan, T. B., and Wickens, C. D. (2000). A model for types and levels of human interaction with automation. IEEE Transactions on systems, man, and Cybernetics-Part A: Systems and Humans, 30(3), 286–297. Rovira, E., Zinni, M., and Parasuraman, R. (2002). Effects of information and decision automation on multi-task performance. Proceedings of the Human Factors and Ergonomics Society Annual Meeting, 46, 327–331. SAGE Publications Sage CA: Los Angeles, CA.
Santiago-Espada, Y., Myer, R. R., Latorella, K. A., and Comstock Jr, J. R. (2011). The multi-attribute task battery ii (matb-ii) software for human performance and workload research: A user s guide.
Wright, J. L., Chen, J. Y., Barnes, M. J., and Hancock, P. A. (2017). Agent Reasoning Transparency: The Influence of Information Level on Automation Induced Complacency. US Army Research Laboratory Aberdeen Proving Ground United States.