OATAO is an open access repository that collects the work of Toulouse
researchers and makes it freely available over the web where possible
Any correspondence concerning this service should be sent
to the repository administrator:
[email protected]
This is an author’s version published in: http://oatao.univ-toulouse.fr/27046
To cite this version:
Gojon, Romain and Bogey, Christophe Effects of the angle of
impact on the aeroacoustic feedback mechanism in
supersonic impinging planar jets. (2018) International Journal
of Aeroacoustics, 18 (2-3). 258-278. ISSN 1475-472X
Official URL:
https://doi.org/10.1177/1475472X18812808
Effects of the angle of impact
on the aeroacoustic feedback
mechanism in supersonic
impinging planar jets
Romain Gojon
1and Christophe Bogey
2Abstract
Three planar impinging supersonic of infinite extent are simulated using compressible large-eddy simulations in order to study the effects of the angle of impact on the flow and acoustic fields of the jet. At the exit of a nozzle of height h, they are ideally expanded and have an exit velocity uj, yielding a Mach number of 1.28, and a Reynolds number of 5 × 10⁴. They impinge on a flat
plate at a distance 5.5h from the nozzle lips with angles of 60, 75, and 90 degrees between the jet direction and the plate. Mean velocity flows and snapshots of density, pressure and vorticity are first shown. The mean convection velocity of the turbulent structures in the jet shear-layers is then determined. The sound pressure levels are computed and several tones due to the presence of a feedback mechanism are found to establish between the nozzle lips and the flat plate. They agree well with the corresponding measurements and with the classical model of the feedback mechanism. Moreover, when the angle of impact deviates from 90 degrees to 75 degrees, a jump from the third to the fourth mode of the feedback mechanism and a reduction in intensity are noted. By applying a Fourier decomposition to the near pressure fields, hydrodynamic-acoustic standing waves are found for each dominant tone frequency. Moreover, as suggested by amplitude fields and velocity spectra in the jet shear layers, the feedback mechanism seems to establish mainly along the lip that is farther away from the plate when the impact angle is not normal. This jump from the third to the fourth mode is similar to the jump observed experimentally for an angle of impact of 90 degrees when the nozzle-to-plate distance increases from 5.5h to 5.85h. Finally, for an angle of impact of 60 degrees, it is seen that none of the modes of the feedback persists in time, but that several modes randomly establish during short periods of time. These rapid switches between different modes lead to several tones that are less energetic on average and centered around St = 0.25.
Keywords
Introduction
In the acoustic field of high-subsonic and supersonic impinging jets, intense acoustic tones have been observed by many authors. Powell1suggested, in 1953, that these tones are due to a feedback mechanism
establishing between the nozzle lips and the plate. This mechanism consists of two steps. First, in the shear layer, a turbulent structure is convected downstream from the nozzle to the plate. The structure impinges on the plate, and generates an acoustic wave propagating upstream towards the nozzle. This wave is then reflected by the nozzle lip, excites the shear layer, and leads to the formation of a new turbulent structure.
Round subsonic and supersonic jets impinging normally on a flat plate have been studied by numerous researchers. Subsonic jets were notably studied by Ho and Nosseir2,3 who always observed intense acoustic tones for exit Mach numbers ranging from0.3 up to 0.9. Supersonic jets were analyzed by Henderson and Powell4, Krothapalli et al.5 , Risbord and Soria6, Buchmann et al.7 and Weightman
et al.8. A feedback mechanism similar to those in subsonic jets was found. This mechanism appears very often when the jet is ideally expanded but only for some nozzle-to-plate distances when the jet is imperfectly expanded9. More rencently, the authors studied in depth the tone production mechanisms in
underexpanded and ideally expanded impinging round jet using compressible large eddy simulation10–12.
Planar jets impinging on a flat plate normally also produce intense tone frequencies. However, compared to round jets, Arthurs and Ziada13noted that tones are visible at lower flow velocities. Planar supersonic
jets impinging on a flat plate normally has been studied notably by Norum14and Tam and Norum15in
the nineties. Often, two emerging tones were observed in the acoustic spectra of the jets. The lower tone frequency was found to be associated with a symmetric oscillation mode of the jet and the upper one, with an antisymmetric oscillation mode of the jet. Using a simple 2-D simulation by Hourigan et al.16 were
able to recover these tones. To explain this phenomenon, Tam and Norum15 proposed that the upstream
propagating waves of the feedback mechanism are neutral acoustic wave modes of the jet. Using a vortex sheet jet model, allowable frequency ranges were found for upstream propagating neutral acoustic wave mode of the jet, depending on their symmetric or antisymmetric nature. These allowable ranges were in agreement with the tones observed in the experiment of Norum14. This model has been used by the
authors in combination with the classical aeroacoustic feedback model in order to predict, for a given ideally expanded planar impinging jet, the most likely tone frequency and the associated jet oscillation17.
A generalization to the case of ideally expanded round impinging jets has later been proposed in Bogey and Gojon11. In this paper, using a space-time Fourier transform on the fluctuating pressure inside the
1ISAE-SUPAERO, Universit ´e de Toulouse
31400 Toulouse, France
2Laboratoire de M ´ecanique des Fluides et d’Acoustique
UMR CNRS 5506, Ecole Centrale de Lyon, Universit ´e de Lyon 69134 Ecully, France
Corresponding author:
Romain Gojon, ISAE-SUPAERO, Universit ´e de Toulouse, 10 Avenue Edouard Belin, 31400 Toulouse, France Email: [email protected]
jet, upstream propagating waves with a group velocity and a phase velocity very close to the ambient speed of sound have been observed. They correspond to neutral acoustic wave modes of the jet and can be found using a vortex sheet model. Recently18, the same decomposition has been applied to screeching
jets. It is shown that the feedback loop responsible of dominant modes A and C an secondary mode u is closed by acoustic upstream propagating waves in the jet which belongs to the neutral acoustic wave modes of the equivalent ideally expanded jet.
For non-normal impingement angles, the intensity of the feedback mechanism decreases because of the loss of symmetry. For instance, for a supersonic ideally expanded planar jet impinging on a inclined flat plate, Norum14noted experimentally that the amplitude of the strongest impingement tone decreases
when the angle of impact deviates from 90 degrees. In order to understand the lift-off phase of a space launcher, Nonomura et al.19,20 performed the simulation of a 2-D jet impinging on a inclined plate and
the LES of a 3-D supersonic ideally expanded round jet impinging on a inclined plate. They obtained three types of waves in the acoustic field, namely the Mach waves generated in the jet shear layers, the Mach waves from the shear layer of the supersonic flow on the inclined flat plate, and the waves coming from the impingement region. These three types of waves were analysed by Tsutsumi et al.21 using a
snapshot proper orthogonal decomposition combined with Fourier transform.
In the present work, the LES of three planar supersonic jets of infinite extent are carried out for different angles of impact in order to investigate the feedback mechanism between the nozzle lips and the flat plate. This work follows a previous study17in which planar supersonic jets impinging normally on a flat
plate were simulated. More precisely, a case from the previous study for a normal impingement angle is considered, and two others are considered for angles of impact of 60 and 75 degrees. The paper is organized as follows. The main characteristics of the jets and the simulations are presented in section 2. Mean fields, snapshots and fluctuating fields are shown in section 3 and compared with experimental data. The acoustic results are then shown in section 4 where the tone frequencies of the feedback mechanism are studied. Finally, concluding remarks are given in section 5.
Parameters
Jets
parameters
Three planar jets impinging on an inclined flat plate are computed using compressible large-eddy simulation. The different cases referred to as JetL5-60d, JetL5-75d and JetL5-90d, are presented in table1: the three angles of impact of θ = 60, θ = 75, and θ = 90 degrees between the jet axis and the flat plate are considered. The case JetL5-90d was simulated in a previous study17. In all cases, the
nozzle-to-plate distance along the jet axis is equal to L = 5.5h, where h is the height on the nozzle, whereas the nozzle-to-plate distance increases from 5.5h to 5.79h along the upper lip line at y = h/2 and decreases from 5.5h to 5.21h along the lower lip line at y = −h/2 when the angle of impact deviates from 90 to 60 degrees. The jets originate from a planar nozzle of height h, and width l = 3.25h in the spanwise direction. The lip thickness is e = 0.5h. Periodic conditions are imposed in the spanwise direction, permitting to simulate a planar jet of infinite extent. The jets are ideally expanded, and have a Mach number of Mj = uj/aj= 1.28 where ujis the jet exit velocity and ajis the speed of sound in the jet.
Their Reynolds is Rej= ujh/ν = 5 × 10⁴, where ν is the kinematic molecular viscosity. The ejection
conditions of the jets and the nozzle-to-plate distances are similar to the parameters in the experimental study of Thurow et al.22
Mj Rej L θ Lupper Llower
JetL5-90d 1.28 5 × 10⁴ 5.5h 90 degrees 5.5h 5.5h
JetL5-75d 1.28 5 × 10⁴ 5.5h 75 degrees 5.63h 5.37h
JetL5-60d 1.28 5 × 10⁴ 5.5h 60 degrees 5.79h 5.21h
Table 1. Jet parameters: Mach number Mj = uj /aj , Reynolds number Rej = uj h/ν, nozzle-to-plate
distanceL, angle θbetween the jet direction and the flat plate and nozzle-to-plate distances along the upper and the lower lip lines Lupper andLlower .
Numerical
parameters
For the case where the angle between the jet axis and the flat plate is 90 degrees, the unsteady compressible Navier-Stokes equations are solved on a Cartesian mesh for which x, y and z denote the longitudinal, lateral and spanwise directions, respectively. An explicit six-stage Runge-Kutta algorithm is used for time integration, and low-dispersion eleven-point explicit finite differences are used for spatial derivation23,24. At the end of each time step, a relaxation filtering is applied to the flow conservative
variables in order to remove grid-to-grid oscillations and to dissipate subgrid-scale turbulent energy. The radiation conditions of Tam and Dong25are implemented at the inflow and lateral boundaries of the
computational domain. A sponge zone combining grid stretching and Laplacian filtering is also employed to damp the turbulent fluctuations before they reach the lateral boundaries. Adiabatic no-slip conditions are imposed to the nozzle wall and the flat plate. Examples of 3-D subsonic jets simulated using the present solver can be found in Bogey et al.26,27 A shock-capturing filtering is applied in order to avoid
Gibbs oscillations near shocks. It consists in applying a conservative second-order filter at a magnitude determined each time step using a shock sensor28. This method was successfully used by de Cacqueray
et al.29 for the LES of an non-ideally expanded jet at an equivalent Mach number Mj= 3.3 and later
by Gojon and Bogey30 for a supersonic screeching jet with M
j = 1.56. Finally, at the nozzle exit, a
Blasius boundary-layer velocity profile is imposed with a boundary-layer thickness of 0.075h and vortical disturbances not correlated in the spanwise direction26are added in the boundary layer in the nozzle at
x = −0.5h in order to generate velocity fluctuations at the nozzle exit. The strength of the forcing is chosen in order to obtain peak turbulent intensities higher than 4% of the jet exit velocity uj at the nozzle exit. More precisely, they are equal to 7.3%, 5.2% and 4.3% of uj for JetL5-90d, JetL5-75d and JetL5-60d, respectively. The jets are thus highly disturbed at the nozzle exit.
For the two cases where θ = 60 degrees and θ = 75 degrees, two Cartesian meshes are used. The meshes as represented in figure 1for the JetL5-75d. The mesh containing the nozzle is referred to as the primary grid, and the mesh close to the flat plate as the secondary grid. The two meshes are identical in the spanwise direction z, allowing the flow variables to be transferred from one grid to another using a 2-D interpolation in the (x, y) plane. Optimized interpolation centered schemes for computational aeroacoustics were developed by Tam31 and by Chicheportiche and Gloerfelt32for instance. They are
developed from Lagrangian polynomial, minimising the error in the wave number space. However, for a centered 2-D interpolation, the improvement relative to the Lagrangian 2-D interpolation is weak32.
Thus, in the present work, a high-order Lagrangian 2-D interpolation is used in each direction. A 10-point stencil is chosen for the interpolation as it is the best compromise between accuracy and computational time, as suggested by Marsden et al.33and Chicheportiche and Gloerfelt32. Therefore, the formal order of
Figure 1. Representation of the two Cartesian meshes for JetL5-75d; (a) sketch of the two meshes, with the primary grid in dark grey, the secondary grid in light grey and the nozzle and flat plate in black and
(b) representation of the grids; every fifteen points is shown.
the interpolation is10. In practice, the value of the variable u of the receiving point (xl, yl) is computed
from the10 × 10 = 100 giving points (x(i), y(j)) as u(xl, yl) =
N
X
i,j=1
Siju(x(i), y(j)) (1)
where the coefficients Sij are the N2 interpolation coefficients. As reported above, the Lagrangian
polynomial were chosen, giving Sij = N Y k=1,k6=i xl−x(i) x(k) − x(i) N Y l=1,l6=j yl−y(j) y(l) − y(j) (2)
The simulations are carried out using an OpenMP-based in-house solver, and a total of 200, 000 iterations are made in each case after the transitional period. The simulation time is equal to500h/uj.
The Cartesian meshes contain between191 and 210 million points for the primary grids and between 38 and46 million points for the secondary grids, as noted in table2and table3, respectively.
nx ny nz number of points
JetL5-90d 903 1051 219 208 × 106
JetL5-75d 966 901 219 191 × 106
JetL5-60d 1196 801 219 210 × 106
Table 2. Parameters of the primary grids containing the jets.
The variations of the axial and lateral mesh spacings in the grid used for JetL5-90d are presented in a previous paper17. The minimal axial mesh spacing, near the nozzle lips and the flat plate, is equal
nx ny nz number of points
JetL5-75d 181 961 219 38 × 106
JetL5-60d 181 1151 219 46 × 106
Table 3. Parameters of the secondary grids close to the plate.
to∆x = 0.00375h and the maximal axial mesh spacing, in the jet, is ∆x = 0.015h. The lateral mesh spacings are equal to ∆y = 0.00375h at y = ±h/2 and to ∆y = 0.03h for 2.5h ≤ y ≤ 8.5h. In the spanwise direction, the mesh spacing is equal to∆z = 0.015h. In the primary grids used for JetL5-60d and JetL5-75d, the minimal axial mesh spacing near the nozzle lip is equal to∆x = 0.00375h and the maximal axial mesh spacing, downstream from the nozzle, is∆x = 0.015h. The lateral and spanwise mesh spacings are identical to those for jetL5-90d. For the secondary meshes, they have a minimal axial mesh spacing of∆x = 0.00375h close to the plate and a maximal axial mesh spacing of ∆x = 0.015h upstream from the plate. Again, the lateral and spanwise mesh spacings are the same as those for jetL5-90d. They are chosen to minimize the difference in mesh size between the two grids as illustrated in figure 1(b). Furthermore, the maximum mesh spacing of 0.03h allows acoustic waves with Strouhal numbers up toSt = f h/uj = 5.6 to be well propagated, where f is the frequency.
After the jet impact, wall jets develop on the flat plate. Their discretizations are discussed by considering the mesh spacings at the wall aty = 2h, given in table 4 in wall units. In the four LES, values of about∆y+ = 65 and ∆z+= 45 are obtained in the streamwise and the spanwise directions,
and ∆x+≃12 is found in the wall-normal direction. Given that the mesh spacings necessary to
compute turbulent wall-bounded flows using LES34–37are about of∆+ = 30 in the streamwise direction,
∆+= 10 in the spanwise direction and ∆+ = 1 in the wall-normal direction, the meshes appear slightly
too coarse to accurately compute the turbulent wall jets. However, this is not the main objective of the present simulations. ∆x+ ∆y+ ∆z+ JetL5-90d 10.1 55 40 JetL5-75d 13.2 68 47 JetL5-60d 14.7 70 49
Table 4. Mesh spacings on the plate at y = 2h, in wall units.
Aerodynamic
results
Flow
snapshots
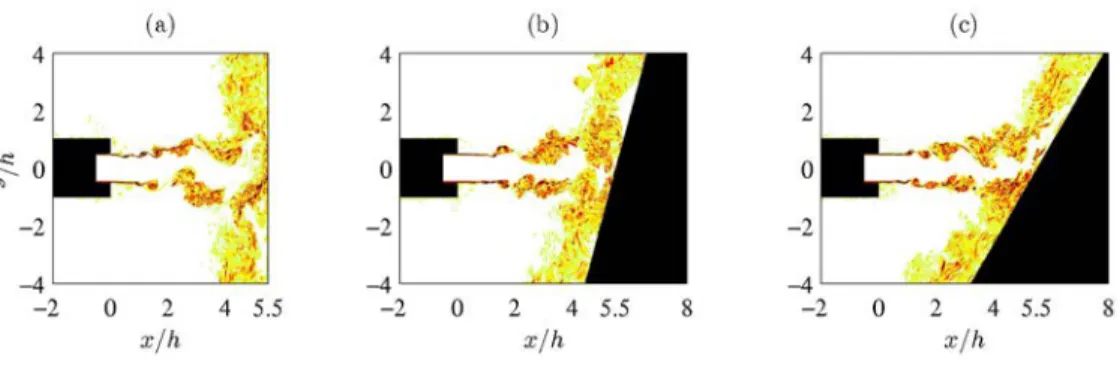
Snapshots of the vorticity norm obtained in the (x, y) plane for JetL5-90d, JetL5-75d and JetL5-60d are represented in figure 2. For the three cases, the two mixing layers exhibit large-scale structures, of typical size 0.5h. This result is similar to the experimental results provided by Thurow et al.22for a rectangular
supersonic jet impinging on a flat plate normally. Moreover, for JetL5-60d, the shear layers may not interact between each other near the region of impact, which seems to be the case for JetL5-90d and JetL5-75d.
Figure 2. Snapshots obtained in the(x, y)plane of vorticity norm|ω| =pω2
x+ ωy2+ ωz2for (a) JetL5-90d, (b) JetL5-75d and (c) JetL5-60d. The colour scale ranges up to the level of10uj/h. The nozzle and the plate are in black.
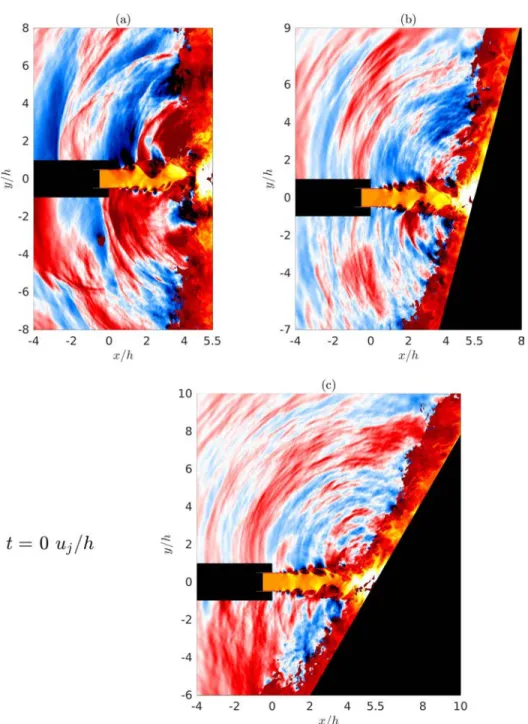
In order to visualize the flow and acoustic fields of the jets, snapshots in the(x, y) plane of the density and the fluctuating pressure are provided in figure3and in a movie available online. In all cases, large-scale structures in the jet shear layers and upstream-propagating sound waves are observed. These waves appear to be generated in the region of jet impact, and to have amplitudes decreasing significantly as the angle of impact deviates from90 degrees.
Mean flow fields
The mean total velocity fields obtained in the(x, y) plane are shown in figure4. Very small variations of about3% of the jet exit velocity are found near the jet axis, indicating that the jets are almost ideally expanded, as desired. In all cases, a stagnation point is visible on the flat plate aty = 0, and plane wall jets form on the plate on both sides of the jet. The important scaling factors of plane wall jets are the maximum velocityum, the distancexmfrom the wall at which the velocity reachesumand the distance
x1/2from the wall at which the mean velocity has dropped toum/238,39. For the present jets, these factors
are given in table5along the linesy = ±2h.
y = 2h y = −2h
um(m.s−1) xm/h x1/2/h um(m.s−1) xm/h x1/2/h
JetL5-90d 349 0.051 0.83 349 0.051 0.83
JetL5-75d 375 0.045 0.90 331 0.030 0.68
JetL5-60d 382 0.054 0.86 284 0.012 0.53
Table 5. Maximum velocity um, distances xm/handx1/2/hof the wall jet at y = ±2h.
When the angle of impact is not normal, the developments of the top and bottom plane wall jets differ, as expected. For the top plane wall jets, the maximum velocity increases but the length scales xm and x1/2
remain nearly constant. Shock cells are also visible in these jets in figures 4(b) and 4(c). For the bottom plane wall jets, the maximum velocity and the length scales xm and x1/2all decrease significantly when
Figure 3. Snapshots obtained in the (x, y) plane of density in the jet axis and close to the flat plate and of
pressure fluctuations for (a) JetL5-90d, (b) JetL5-75d and (c) JetL5-60d. The colour scale ranges from 1 to
Figure 4. Mean velocity field obtained in the(x, y)plane for (a) JetL5-90d, (b) JetL5-75d and (c) JetL5-60d. The colour scale ranges from0to400m.s−1. The nozzle and the flat plate are in black.
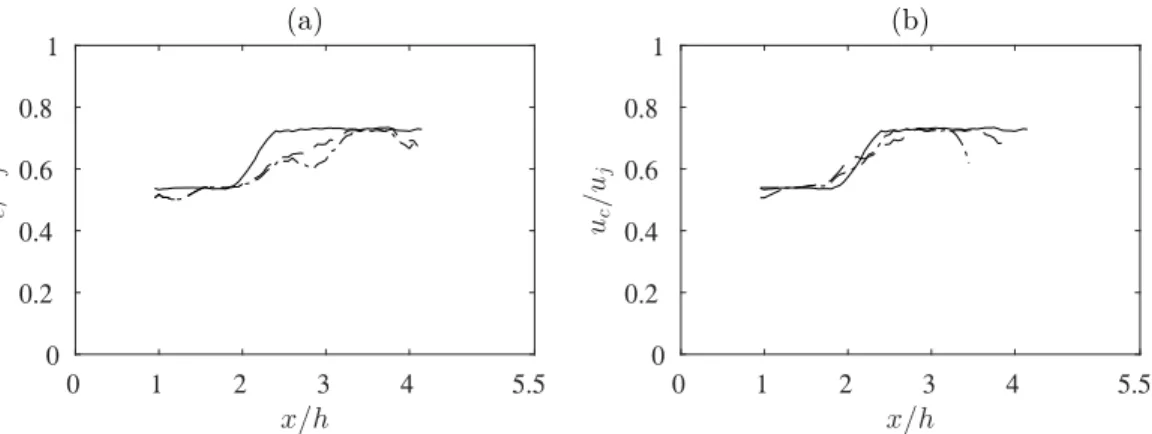
Convection velocity
In order to describe the feedback mechanism, the convection velocityucof the turbulent structures along
the liplinesy = h/2 and y = −h/2 is calculated from cross-correlations of axial velocity fluctuations u′
x. The results are shown in figure5for the three simulated jets.
0 1 2 3 4 5.5 x/h 0 0.2 0.4 0.6 0.8 1 uc / uj (a) 0 1 2 3 4 5.5 x/h 0 0.2 0.4 0.6 0.8 1 uc / uj (b)
Figure 5. Convection velocity of the turbulent structures as a function of the axial coordinate in (a) the upper
jet shear layer at y = h/2 and (b) the lower jet shear layer at y = −h/2 for JetL5-90d, JetL5-75d, and . JetL5-60d.
For all jets, the convection velocities are approximately of 0.45uj at x = h. Farther downstream, for JetL5-90d, the convection velocity increases, and reaches a maximal value of 0.63uj at x = 2.5h17. For
JetL5-75d and JetL5-60d, similar behaviours are found along the lower jet shear layer, where maximal values of 0.63uj at x = 3.75h are noted. However, along the upper jet shear layer, the increase of the convection velocity is slower and maximal values of 0.63uj are also reached but further downstream, at x = 3.35h. Overall, the mean convection velocity of the large-scale structures along the lipline is of < uc >≃ 0.55uj. This result is in agreement with the experimental results of Panda et al.40 who
an exit Mach number of Me= 1.3. Moreover, for two pressure-matched parallel streams with equal
specific heats, the convection Mach number Mcwas defined by Papamoschou and Roshko41as
Mc= u1−u2 a1+ a2 = u1−uc a1 =uc−u2 a2 (3) whereu1andu2 are the high-speed and low-speed free stream velocities,a1anda2 are the speeds of
sound, anduc is the theoretical isentropic convection velocity. For the present planar jets,u1 is the jet
velocity at the nozzle exit andu2is the velocity outside the jet, henceu1=ujandu2= 0, and a1= aj
anda2= a0. Thus, the theoretical convection velocity for the planar jet is
< uc>=
uj
aj/a0+ 1
(4) yielding< uc>= 0.57uj, in agreement with the simulation results.
Overall sound pressure levels
The overall sound pressure levels (OASPL) obtained in the plane(x, y) are represented for the three jets in figure6. Isocontours are added in order to improve the readability. The OASPL, in dB, are computed from the rms fluctuating pressure fields as
OASP L = 10 log p ′2 rms p2 ref ! (5) wherepref = 2.10−5Pa.
Figure 6. OASPL obtained in the (x, y) plane for (a) JetL5-90d, (b) JetL5-75d and (c) JetL5-60d. The colour
scale ranges from 150 to175 dB. The nozzle and the plate are in black.
For JetL5-90d, in figure 6(a), two acoustic components emerge. Let α be the angle at the impingement region between the upstream direction and the waves propagating from the flat plate, as illustrated in figure 6(a). The first acoustic component can be seen for 0 ≤ α ≤ 30 degrees, and is therefore due
to acoustic waves propagating in the upstream direction, closing the aeroacoustic feedback loop. The second acoustic contribution appears forα ≃ 50 degrees and seems to come from a region located near the plate, aty ≃ 3.5h. For JetL5-75d, in figure6(b), the same two acoustic components are visible. The second acoustic component is here characterized by an angle ofα ≃ 35 degrees in the upper side and α ≃ 30 degrees in the lower side. For JetL5-60d, in figure 6(c), the acoustic radiation does not have a marked directivity. However, the presence of a supersonic top plane wall jet apparently leads to an additional acoustic component in the upper side, as observed numerically by Nonomura et al.20 for a
round ideally-expanded supersonic jet impinging on a flat plate with an angle of45 degrees.
Acoustic results
Sound pressure levels
The sound pressure levels computed atx = 0 and y = 1.5h are shown in figure7as a function of the Strouhal number. They are computed using the Welch method with a50% overlapping in time and by performing spectral averaging over the periodic directionz. Several tone frequencies emerge and those whose levels are at least10 dB higher than the broadband noise level are given in table6. For JetL5-90d, in figure7(a), a dominant tone frequency atSt = 0.19 and its first six harmonics can be seen. Another tone frequency atSt1= 0.12 is visible. The agreement is excellent with the experimental data of Thurow
et al.22 who obtained a fundamental tone frequency atSt = 0.20 for a similar jet. For JetL5-75d, in
figure6(b), two emerging tone frequencies are found atSt1= 0.19 and St2= 0.25. The first one is the
same one as for the case JetL5-90d in figure7(a), but the latter one does not exist for JetL5-90d. Finally, for JetL5-60d, in figure7(c), there is no clear tone frequency. However, the maximum sound pressure level seems to be found aroundSt = 0.25.
St1 St2 St3 S4 St5 St6 St7
JetL5-90d 0.12 0.19 0.38 0.57 0.76 0.95 1.14
JetL5-75d 0.19 0.25 − − − − −
JetL5-60d (0.25) − − − − − −
Table 6. Tone strouhal numbers in the spectra of figure7. The Strouhal numbers of the dominant tones for
JetL5-90d and JetL5-75d are in bold. The Strouhal number at the maximum sound pressure level for JetL5-60d is between brackets.
Tone frequencies
In order to explain the origin of tone frequencies, Powell1 suggested that a feedback mechanism establishes between the nozzle lips and the flat plate. Similarly, Ho and Nosseir2 and Nosseir and Ho3 constructed a simple model in order to predict the frequencies of the feedback mechanism, providing the relation N f = L < uc> + L c0 (6) where< uc> is the mean convection velocity of the large-scale structures in the shear layers and N is
10−1 100 140 150 160 170 180 190 (a) St = fh/uj S P L (dB / S t) 10−1 100 140 150 160 170 180 190 (b) St = fh/uj S P L (dB / S t) 10−1 100 140 150 160 170 180 190 (c) St = fh/uj S P L (dB / S t)
Figure 7. Sound pressure levels obtained at x = 0 andy = 1.5h as a function of the Strouhal number Stfor
(a) JetL5-90d, (b) JetL5-75d and (c) JetL5-60d.
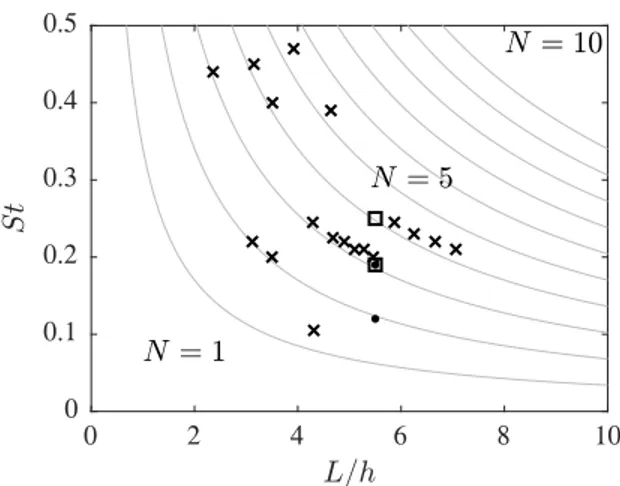
The Strouhal numbers of the tone frequencies obtained for the present jets in figure 7are plotted in figure8as a function of the nozzle-to-plate distance L/h. For the three computed jets, the value L = 5.5h at the center of the jet is used. Only the fundamental tone frequencies, which are not harmonics of other tone frequencies and which are called source tone frequencies in the following, are represented. The tone frequencies measured by Thurow et al.22, as well as those predicted using equation (6) with a mean
convection velocity equal to < uc >= 0.55uj, are also displayed. A good agreement is found between
the simulation and the experimental data. Moreover, the tone frequencies seem to be well predicted by the model.
For JetL5-90d, where L/h = 5.5, the two source tone frequencies at St1= 0.12 and St2= 0.19 can
be associated with the second mode and the third mode of the feedback mechanism. For JetL5-75d, the two observable tones at St1= 0.19 and St2= 0.25 correspond to the third and the fourth modes.
0 2 4 6 8 10 0 0.1 0.2 0.3 0.4 0.5
Figure 8. Strouhal numbers of the tone frequencies obtained •for JetL5-90d, ✷ for JetL5-75d, and ×
experimentally by Thurow et al. 22 as a function of the nozzle-to-plate distance. The grey lines show the values predicted by equation (6) using < uc >= 0.55uj .
The maximum sound pressure level is however reached around St = 0.25. Therefore, when the angle of impact deviates from 90 degrees, there is a jump from the third mode to the fourth mode of the feedback mechanism. A similar jump is observed in the experiments of Thurow et al.22when the nozzle-to-plate
distance increases from 5.5h to 5.85h. Indeed, as visible in figure 8, they found dominant tone frequencies of St = 0.20 and St = 0.245 for L = 5.5h and L = 5.85h, respectively.
Skewness
and kurtosis factors
In order to investigate the non-linear features of the acoustic waves generated by the impingement, the statistical properties of the pressure are examined at x = 0 and y = 8.5h. They are computed using the Welch method with a 50% overlapping in time and by performing statistical averaging over the periodic direction z. This point is located the furthest possible in the acoustic region where the mesh size is smaller than 0.03h. This position permits to resolve the acoustic spectrum up to a Strouhal numbers of St = fh/uj= 5.6. It has been chosen in order to allow non-linear propagation effects to possibly affect
the acoustic waves coming from the region of impact. Figures 9(a,c,e) display the fluctuating pressure at this point for the different jets. For JetL5-90d, in figure 9(a), weak shock waves and N-shaped waves showing sharp compressions associated with gradual expansions appear. These shapes are similar to those obtained by de Cacqueray and Bogey42in the acoustic field of an overexpanded jet29at M
j= 3.3.
Moreover, at some times, the fluctuating pressure exceeds 0.15Pamb. This is the case at t1= 10h/uj and
t2= 20h/uj, where two strong shock waves are noticed. As the angle of impact changes, the amplitude
of the pressure fluctuation decreases. N-shaped waves are still visible for JetL5-75d in figure 9(c) at t1= 38h/uj, but not for JetL5-60d in figure 9(e).
In order to be more quantitative, figures 9(b,d,f) show the probability density functions of the fluctuating pressure normalized by the standard deviation as well as the skewness and kurtosis factors for JetL5-90d, JetL5-75d, and JetL5-60d. For JetL5-90d, a skewness factor of S = 0.57 and a kurtosis
factor ofK = 3.87 are obtained, indicating strong non-linearity and intermittency of the signal. These properties correspond to those of the crackle noise first defined by Ffowcs-Williams et al.43, who
identified this specific noise when the skewness factor of the pressure field exceeds0.4. As the angle of impact deviates from90 degrees, the skewness factor decreases down to S = 0.25 for JetL5-75d and toS = 0.19 for JetpL5-60d. This result is in agreement with the weakening of the N-shaped waves in the fluctuating pressure signals in figures9(c,e). Moreover, the kurtosis factor also decreases fromK = 3.87 for JetL5-90d down toK = 3.2 and K = 3.49 for JetL5-75d and JetL5-60d. This result indicates that the fluctuating pressure is not strongly intermittent for lower angles of impact.
For the three jets simulated, the peak values in the sound spectra atx = 0 and y = 1.5h of figure7, and the skewness and kurtosis factors of the fluctuating pressure atx = 0 and y = 8.5h, are collected in figure7. The maxima in the spectra and the skewness factors appear to be correlated. Moreover, the highest values of skewness and kurtosis factors are obtained for JetL5-90d, supporting that the most resonant case is also the case where non linearity and intermittency are the strongest.
JetL5-90d JetL5-75d JetL5-60d
SP Lmax(dB/St) 188 175 160
Skewness 0.57 0.25 0.19
Kurtosis 3.87 3.2 3.49
Table 7. Maximal levels obtained in the sound spectra of figure 7, skewness and kurtosis factors of the
fluctuating pressure at x = 0 andy = 8.5h.
Fourier
decomposition of the pressure field
For each jet, the pressure field in one (x, y) plane has been recorded every 50thtime step, at a sampling
frequency of St = 8. A Fourier decomposition is then applied. In this way, for a given frequency, the amplitude and phase fields can be displayed.
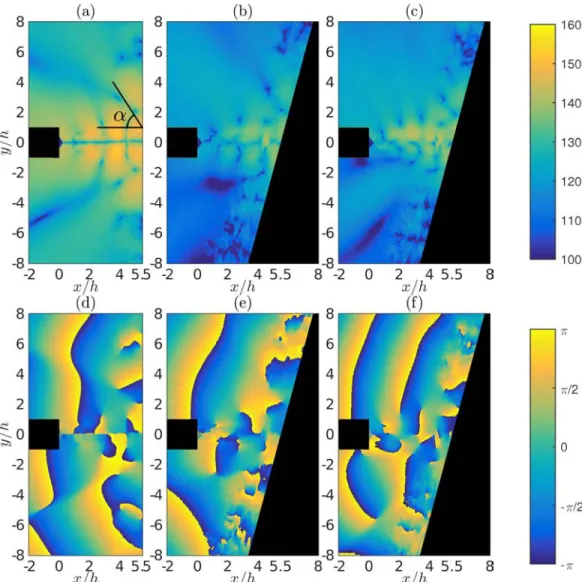
The amplitude and phase fields obtained for the source tone frequency of JetL5-90d at St2= 0.19
and the two tone frequencies at St1= 0.19 and St2= 0.25 of JetL5-75d are displayed in figure 10. The
amplitude fields are shown in the top views, and the phase fields in the bottom views. The latter fields enable to identify the nature of the modes. The source tone frequencies of JetL5-90d and the secondary tone frequency of JetL5-75d, at St1= 0.19 can be associated to antisymmetric oscillation modes because
there is a 180-degree phase shift with respect to the jet axis in figures 10(d) and 10(e). However, for the dominant source tone frequency of JetL5-75d at St2= 0.25, a clear pattern of a symmetric or
antisymmetric oscillation mode of the jet does not appear in figure 10(c).
The amplitude fields of the three tone frequencies represented in the top views of figure 10 all exhibit a cell structure between the jet nozzle and the plate. By considering the two semi-cells near the nozzle and the plate as one cell, the cell structures contain three cells for JetL5-90d at St2= 0.19 and for
JetL5-75d at St1= 0.19 in figures 10(a) and 10(b) and four cells for JetL5-75d at St1= 0.25 in figure 10(c).
Thus, the number of cells corresponds to the mode number predicted by the model of Ho and Nosseir2,3
identified in figure 8. Those cells are due to the formation of hydrodynamic-acoustic standing waves. Such waves have been observed experimentally by Panda et al.40 in supersonic screeching jets and
numerically by Gojon et al.17and Bogey and Gojon11in ideally-expanded planar impinging jets, among
0 10 20 30 40 50 −0.15 −0.1 −0.05 0 0.05 0.1 0.15 (a) tuj/h p ′/ Pam b −4 −2 0 2 4 0 0.1 0.2 0.3 0.4 0.5 K = 3.87 S = 0.57 (b) P D F of p ′ 0 10 20 30 40 50 −0.15 −0.1 −0.05 0 0.05 0.1 0.15 (c) tuj/h p ′/ Pam b −4 −2 0 2 4 0 0.1 0.2 0.3 0.4 0.5 K = 3.2 S = 0.25 (d) P D F of p ′ 0 10 20 30 40 50 −0.15 −0.1 −0.05 0 0.05 0.1 0.15 (e) tuj/h p ′/ Pam b −4 −2 0 2 4 0 0.1 0.2 0.3 0.4 0.5 K = 3.49 S = 0.19 (f ) P D F of p ′
Figure 9. (left views) Fluctuating pressure atx = 0andy = 8.5hover a short period, and (right views)
probability density functions ( pdf of a Gaussian distribution) for (a,b) JetL5-90d (c,d) JetL5-75d and (e,f) JetL5-60d.
Figure 10. Amplitude (top) and phase (bottom) obtained for the pressure fields for (a,d) JetL5-90d at
St2= 0.19, (b,e) JetL5-75d at St1= 0.19 and (c,f) JetL5-75d at St2 = 0.25. The nozzle and the plate are in black. The colour ranges range over 60dB for the amplitude fields and from −πtoπfor the phase fields.
the upper shear layer than in the lower shear layer. This suggests that the feedback mechanism establishes mainly in the upper jet shear layer for JetL5-75d. This observation is consistent with the switch from the third mode to the fourth mode reported in previous section. The nozzle-to-plate distance along the upper jet shear layer Lupper increases from 5.5h for JetL5-90d to 5.63h for JetL5-75d. Therefore, it is not
surprising that the same mode jump has been observed experimentally when the nozzle-to-plate distance is increased from 5.5h to 5.85h for normal impinging jets.
Those results are in agreement with the combination of models proposed in Gojon et al.17 Indeed,
for this jet configuration, the tone Strouhal number St = 0.19 and the antisymmetric oscillation mode of the jet at this frequency are predicted. The tone at St = 0.25 is also predicted with an antisymmetric oscillation mode of the jet. This oscillation mode is not clearly recovered in the phase field in figure 10(c). It is probably due to the fact that almost only the upper jet shear-layer maintains the aeroacoustic feedback mechanism, with phase contours that all seem to come from the upper jet shear-layer region of impact in figure10(c), even in the region where y < 0.
Velocity
spectra
The spectra of axial velocity fluctuations calculated in the lower and upper jet shear layers are presented in figure 11 as functions of the Strouhal number and the axial distance. They are computed using the Welch method with a 50% overlapping in time on one point in the spanwise direction. For JetL5-90d, a very similar behavior can be noted on both sides of the jet, in agreement with the symmetry. A dominant tone at St = 0.19 is visible from the nozzle exit to the plate. Its first three harmonics are also seen, mainly near the nozzle exit. For JetL5-75d, different results are obtained in the two jet shear layers, as expected. In the lower shear layer, in figure 11(e), a low amplitude tone at St = 0.19 only appears near the nozzle exit, whereas in the upper shear layer, in figure 11(b), a dominant tone at St = 0.25 and a secondary tone at St = 0.19 emerge. This result is consistent with the observation made in the previous section that the feedback mechanism establishes mainly in the upper jet shear layer in this case. For JetL5-60d, several tones of low amplitude can be identified around St = 0.25 in the upper shear layer, but they are less marked in the lower shear layer.
Tone
intermittency
In order to determine whether the jets product alternatively or simultaneously the different tones emerging in the spectra of figure 7, a Fourier decomposition is applied to the pressure signal at x = 0 and y = 1.5h using a sliding window in time of size 35uj/h. The results for the three jets are displayed in figure 12 as
functions of time and Strouhal number.
For JetL5-90d, in figure 12(a), the contribution of the dominant tone frequency at St2= 0.19 is clearly
visible, and coexists in time with those of its harmonic at St3= 0.38 and of the secondary tone frequency
at St1= 0.12. For JetL5-75d, in figure 12(b), the tone at St1= 0.19 and a second tone at St2= 0.25
appear simultaneously. Finally, for JetL5-60d, in figure 12(c), the tone at St = 0.25 can still be noticed and varies over time. Besides, several other tones, at St = 0.08, 0.13, 0.19, 0.32, and 0.385, stand out over short periods of time of about 50uj/h. These tones can be linked to the modes N = 1, 2, 3, 5 and
6 of the aeroacoustic feedback mechanism. Thus, for an angle of impact of 60 degrees, it seems that none of the modes of the feedback persists in time, but that several modes randomly establish during short periods of time. These rapid switches between different modes lead to several tones that are less energetic on average and centered around St = 0.25 for JetL5-60d in figure 7(c).
Figure 11. Power spectral densities (PSD) of axial velocity fluctuations u′
z obtained along the (a,b,c) upper jet shear layer and (d,e,f) lower jet shear layer as functions of the Strouhal number and the axial coordinate for (a,d) JetL5-90d, (b,e) JetL5-75d and (c,f) JetL5-60d. The color scale ranges over 50 dB from blue to red.
Conclusion
In this paper, the hydrodynamic and acoustic properties of three planar supersonic jets computed by compressible large-eddy simulations are presented. The jets are ideally expanded, and have a Mach number Mj of 1.28, and a Reynolds number Rej of 5 × 10⁴. One jet impinging on a flat plate normally,
and two other impinging jets with angles of impact of 60 and 75 degrees are considered. Mean velocity flows and snapshots of density, fluctuating pressure and vorticity are described. The mean convection velocity of the turbulent structures in the jet shear layers is determined. The results are consistent with theoretical models and with experimental values. The near pressure fields are then detailed. Several tones emerge in the pressure spectra in the vicinity of the nozzle. The frequencies associated with these tones compare well with measurements and with the classical model of the feedback mechanism. Besides, a jump from the third to the fourth mode and a reduction in intensity are observed as the angle of impact deviates from 90 degrees to 75 degrees. A reduction of the amplitude of the acoustic waves coming from the region of jet impact is also noticed. A Fourier decomposition is then applied to the near pressure
Figure 12. Sound pressure levels obtained at x = 0 andy = 1.5h as functions of time and Strouhal number for (a) JetL5-90d, (b) JetL5-75d and (c) JetL5-60d. The color scales have been chosen arbitrarily and range over30 dB for JetL5-90d, 15 dB for JetL5-75d and 10 dB for JetL5-60d.
fields in the (x, y) plane. Hydrodynamic-acoustic standing waves are found in the amplitude fields of some tone frequencies. Moreover, for an angle of impact of 75 degrees, higher amplitudes are found in the upper shear layer than in the lower shear layer, indicating that the feedback mechanism establish mainly along the lip that is farther away from the plate when the impact angle is not normal. Velocity spectra in the jet shear layers also support this result. Indeed, the dominant tone frequency is only visible in the velocity spectra of the upper jet shear layer for an angle of impact of 75 degrees. This observation is consistent with the jump observed from the third mode to the fourth mode. In this case, the nozzle-to-plate distance along the upper jet shear layer increases from 5.5h for JetL5-90d to 5.63h for JetL5-75d. Therefore, it seems natural that the present jump is similar that observed experimentally when the nozzle-to-plate distance is increased from 5.5h to 5.85h for normal impinging jets. Finally, using a Fourier decomposition over a sliding window in time, is is observed, for an angle of impact of 60 degrees, that none of the modes of the feedback persists in time, but that several modes randomly establish during
short periods of time. These rapid switches between different modes lead to several tones that are less energetic on average and centered aroundSt = 0.25 for this impact angle.
Acknowledgments
This work was performed using HPC resources of P2CHPD (Pˆole de Calcul Hautes Performances D´edi´es) and CNRS on Turing, Occigen (GENCI-IDRIS grant x2016a7178 and GENCI-CINES grant A0022A07178), Eos (CALMIP, grant 2017-p1425).
References
References1. Powell A. On edge tones and associated phenomena. Acta Acust United Ac 1953; 3: 233–243.
2. Ho C and Nosseir N. Dynamics of an impinging jet. part 1. the feedback phenomenon. J Fluid Mech 1981; 105: 119–142.
3. Nosseir N and Ho C. Dynamics of an impinging jet. part 2. the noise generation. J Fluid Mech 1982; 116: 379–391.
4. Henderson B and Powell A. Experiments concerning tones produced by an axisymmetric choked jet impinging on flat plates. J Sound Vib 1993; 168(2): 307–326.
5. Krothapalli A, Rajkuperan E, Alvi F et al. Flow field and noise characteristics of a supersonic impinging jet. J Fluid Mech1999; 392: 155–181.
6. Risborg A and Soria J. High-speed optical measurements of an underexpanded supersonic jet impinging on an inclined plate. 28th International Congress on High-Speed Imaging and Photonics 2009; 7126(F).
7. Buchmann N, Mitchell D, Ingvorsen K et al. High spatial resolution imaging of a supersonic underexpanded jet impinging on a flat plate. Abstract from 6th Australian Conference on Laser Diagnostics in Fluid Mechanics and Combustion2011; .
8. Weightman J, Amili O, Honnery D et al. An explanation for the phase lag in supersonic jet impingement. J Fluid Mech2017; 815: R11–R111.
9. Henderson B, Bridges J and Wernet M. An experimental study of the oscillatory flow structure of tone-producing supersonic impinging jets. J Fluid Mech 2005; 542: 115–137.
10. Gojon R and Bogey C. Flow structure oscillations and tone production in underexpanded impinging round jets. AIAA J2017; 55(6): 1792–1805.
11. Bogey C and Gojon R. Feedback loop and upwind-propagating waves in ideally-expanded supersonic impinging round jets. J Fluid Mech 2017; 823: 562–591.
12. Gojon R and Bogey C. Flow features near plate impinged by ideally expanded and underexpanded round jets. AIAA J2018; 56(2): 445–457.
13. Arthurs D and Ziada S. Self-excited oscillations of a high-speed impinging planar jet. J Fluids Struct 2012; 34: 236–258.
14. Norum T. Supersonic rectangular jet impingement noise experiments. AIAA J 1991; 29(7): 1051–1057. 15. Tam C and Norum T. Impingement tones of large aspect ratio supersonic rectangular jets. AIAA J 1992; 30(2):
304–311.
16. Hourigan K, Rudman M and Brocher E. The feedback loop in impinging two-dimensional high-subsonic and supersonic jets. Exp therm fluid sci 1996; 12(2): 265–270.
17. Gojon R, Bogey C and Marsden O. Investigation of tone generation in ideally expanded supersonic planar impinging jets using large-eddy simulation. J Fluid Mech 2016; 808: 90–115.
18. Gojon R, Bogey C and Mihaescu M. Oscillation modes in screeching jets. AIAA J 2018; 56(7): 2918–2924. 19. Nonomura T, Tsutsumi S, Takaki R et al. Impact of spatial and temporal resolution on the aeroacoustic wave
from a two-dimensional impinging jet. 7th International Conference on Computational Fluid Dynamics 2012; ICCFD7-3103.
20. Nonomura T, Goto Y and Fujii K. Aeroacoustic waves generated from a supersonic jet impinging on an inclined flat plate. Int J Aeroacoust 2011; 10: 401–425.
21. Tsutsumi S, Nonomura T, Fujii K et al. Analysis of acoustic wave from supersonic jets impinging to an inclined flat plate. 7th International Conference on Computational Fluid Dynamics 2012; ICCFD7-3104.
22. Thurow B, Samimy M and Lempert W. Structure of a supersonic impinging rectangular jet via real-time optical diagnostics. 32nd AIAA Fluid Dynamics Conference 2002; AIAA Paper 2002-2865.
23. Bogey C and Bailly C. A family of low dispersive and low dissipative explicit schemes for flow and noise computations. J Comput Phys 2004; 194(1): 194–214.
24. Berland J, Bogey C, Marsden O et al. High-order, low dispersive and low dissipative explicit schemes for multiple-scale and boundary problems. J Comput Phys 2007; 224(2): 637–662.
25. Tam C and Dong Z. Wall boundary conditions for high-order finite-difference schemes in computational aeroacoustics. Theor Comput Fluid Dyn 1994; 6: 303–322.
26. Bogey C, Marsden O and Bailly C. Large-eddy simulation of the flow and acoustic fields of a reynolds number 105
subsonic jet with tripped exit boundary layers. Phys Fluids 2011; 23(035104).
27. Bogey C, Marsden O and Bailly C. Influence of initial turbulence level on the flow and sound fields of a subsonic jet at a diameter-based reynolds number of105
. J Fluid Mech 2012; 701: 352–385.
28. Bogey C, de Cacqueray N and Bailly C. A shock-capturing methodology based on adaptative spatial filtering for high-order non-linear computations. J Comput Phys 2009; 228(5): 1447–1465.
29. de Cacqueray N, Bogey C and Bailly C. Investigation of a high-mach-number overexpanded jet using large-eddy simulation. AIAA J 2011; 49(10): 2171–2182.
30. Gojon R and Bogey C. Numerical study of the flow and the near acoustic fields of an underexpanded round free jet generating two screech tones. Int J of Aeroacous 2017; 16(7-8): 603–625.
31. Tam C and Hu F. An optimized multi-dimensional interpolation scheme for computational aeroacoustics applications using overset grids. 10th AIAA/CEAS Aeroacoustics Conference 2004; AIAA Paper 2004-2812. 32. Chicheportiche J and Gloerfelt X. Techniques de recouvrement de maillages pour le calcul direct en
a´eroacoustique. 2011.
33. Marsden O, Bogey C and Bailly C. High-order curvilinear simulations of flows around non-cartesian bodies. J Comput Acous2005; 13(4): 731–748.
34. Kremer F and Bogey C. Large-eddy simulation of turbulent channel flow using relaxation filtering: Resolution requirement and reynolds number effects. Comput Fluids 2015; 116: 17–28.
35. Viazzo S, Dejoan A and Schiestel R. Spectral features of the wall-pressure fluctuations in turbulent wall flows with and without perturbations using les. Intl J Heat Fluid Flow 2001; 22(1): 39–52.
36. Gloerfelt X and Berland J. Direct computation of turbulent boundary layer noise. 15th AIAA/CEAS Aeroacoustics Conference2009; AIAA Paper 2009-3401.
37. Schlatter P, Li Q, Brethouwer G et al. Simulations of spatially evolving turbulent boundary layers up to reθ=
38. Irwin H. Measurements in a self-preserving plane wall jet in a positive pressure gradient. J Fluid Mech 1973; 61(01): 33–63.
39. George W, Abrahamsson H, Eriksson J et al. A similarity theory for the turbulent plane wall jet without external stream. J Fluid Mech 2000; 425: 367–411.
40. Panda J, Raman G and Zaman K. Underexpanded screeching jets from circular, rectangular and elliptic nozzles. 3th AIAA/CEAS Aeroacoustics Conference1997; AIAA Paper 97-1623.
41. Papamoschou D and Roshko A. The compressible turbulent shear layer: an experimental study. J Fluid Mech 1988; 197: 453–477.
42. de Cacqueray N and Bogey C. Noise of an overexpanded mach 3.3 jet: non-linear propagation effects and correlations with flow. Int J Aeroacoust 2014; 13(7): 607–632.
43. Ffowcs-Williams J, Simson J and Virchis V. crackle: An annoying component of jet noise. J Fluid Mech 1975; 71(02): 251–271.