O
pen
A
rchive
T
OULOUSE
A
rchive
O
uverte (
OATAO
)
OATAO is an open access repository that collects the work of Toulouse researchers and
makes it freely available over the web where possible.
This is an author-deposited version published in : http://oatao.univ-toulouse.fr/
Eprints ID : 17744
To link to this article : DOI:10.1002/admi.201601185
URL : http://dx.doi.org/10.1002/admi.201601185
To cite this version : Aviziotis, Ioannis G. and Duguet, Thomas and
Vahlas, Constantin and Boudouvis, Andreas G. Combined
Macro/Nanoscale Investigation of the Chemical Vapor Deposition of
Fe from Fe(CO)5. (2017) Advanced Materials Interfaces. pp. 1601185.
ISSN 2196-7350
Any correspondence concerning this service should be sent to the repository
administrator: [email protected]
Combined Macro/Nanoscale Investigation of the Chemical
Vapor Deposition of Fe from Fe(CO)
5
Ioannis G. Aviziotis, Thomas Duguet,* Constantin Vahlas, and Andreas G. Boudouvis
DOI: 10.1002/admi.201601185
molecular compounds have been tested for the deposition of iron compounds containing metalloid and nonmetal ele-ments. It thus appears that the design of precursors for the CVD of pure or alloyed Fe films showed limited progress in recent years. This is in part due to the availability of appropriate precursors for pure Fe deposition, such as the widely used iron pentacarbonyl, Fe(CO)5. Fe(CO)5 is highly
toxic, flammable, and heat-, air-, and light-sensitive. On the other hand, it is a low cost chemical, its transport into the reactor chamber is facilitated by a high vapor
pressure at room temperature,[8] while
its low deposition temperature allows the surface treatment of thermally sensitive substrates. Last but not least, despite the
existence of FeC bonds, Fe(CO)5 yields fairly pure Fe films at
relatively high deposition rates.[9] For these reasons, it is
reason-able to consider the CVD of Fe from Fe(CO)5 and consequently
it is necessary to establish a robust model which allows process optimization. This is the objective of the present contribution.
The mechanisms of the CVD of Fe from Fe(CO)5 and the
behavior of the latter in CVD conditions have been extensively investigated in the literature. It is proposed that the pentac-arbonyl precursor is adsorbed on the surface prior its surface
decomposition to Fe and five carbon monoxides (CO).[10] This
global dissociation scheme has also been adopted in other
works[9] where the thermal decomposition of the precursor is
studied. However, intermediate surface species such as Fe(CO)4
and Fe(CO)3 have been observed experimentally, suggesting
that the Fe(CO)5 surface decomposition involves more than one
step.[11,12]
The CVD of Fe at temperatures higher than 200 °C has
also been examined elsewhere.[8,13] A constant decrease of the
Fe deposition rate is observed as temperature increases. This behavior is attributed to the etching of the films by the CO by-product. The same trend for the reduction of the Fe
deposi-tion rate above 200 °C has been reported in similar works[14,15]
where it is speculated that besides the effect of CO on growth, homogeneous gas phase reactions of the precursor could also contribute to the decrease of the Fe deposition rate. Finally, it
has been shown in a recent study[16] that CO molecules impact
not only the deposition rate but also the microstructure of the Fe films.
The above-mentioned reports do not consider the gas phase whereas it can have a significant effect on the Fe deposition rate. Such information is provided by other authors using
infrared spectroscopy[17] and energy-resolved collision-induced
Experiments and computations are performed to model the chemical vapor
deposition of iron (Fe) from iron pentacarbonyl (Fe(CO)5). The behavior of
the deposition rate is investigated as a function of temperature, in the range 130–250 °C, and pressure in the range 10–40 Torr. Furthermore, the evolu-tion of the surface roughness is correlated with the deposievolu-tion temperature. By combining previously published mechanisms for the decomposition of
Fe(CO)5, a predictive 3D macroscale model of the process is built.
Addition-ally, a nanoscale and a multiscale framework are developed for linking the evolution of the surface of the film with the operating conditions at the reactor scale. The theoretical predictions from the coupled macro/nanoscale models are in very good agreement with experimental measurements indi-cating poisoning of the surface from carbon monoxide and decrease of the film roughness when temperature increases.
Dr. I. G. Aviziotis, Prof. A. G. Boudouvis School of Chemical Engineering National Technical University of Athens Heroon Polytechniou 9, 15780 Zografou, Greece Dr. I. G. Aviziotis, Dr. T. Duguet, Dr. C. Vahlas CIRIMAT
CNRS
Université de Toulouse
4 allée Emile Monso, BP 44362, 31030 Toulouse cedex 4, France E-mail: [email protected]
1. Introduction
Iron (Fe) thin films and coatings are involved in a wide spec-trum of advanced applications, for example, for the stabilization of magnetic skyrmions in spintronics technology to produce topologically protected spin textures and electronic states for
the transportation and storage of information.[1] They can also
be applied as components in magnetic metal multilayers[1] and
in metallic alloys, such as NiFe, FeMn, FePt, and NdFeB to provide advanced materials with high quality magnetic proper-ties[2] or as dopants to form semi-insulating InP layers.[3] It was
shown recently that the bulk Al13Fe4 intermetallic alloy presents
excellent catalytic activity which may be further improved if
pro-cessed in the form of thin films.[4] Several methods have been
developed for the production of Fe and Fe-containing thin films, among which chemical vapor deposition (CVD) that combines high deposition rates, moderate process temperatures, reduced effluents volume, and conformal coverage of complex surfaces.
Various Fe metalorganic precursors have been studied for the CVD of Fe films.[5] More recently, traditional[6] and new[7] iron
dissociation of Fe(CO)5 and its intermediates[18] or by
compu-tational methods such as ab initio studies.[19,20] These studies
describe the gas phase sequential decarbonylations of the pen-tacarbonyl precursor and the recombination reactions of the intermediate carbonyls with CO.
The present work provides a combined experimental and
theoretical study of the deposition of Fe from Fe(CO)5. A 3D
macroscopic model is developed based on first principles, i.e., the conservation of mass, momentum and energy, and it accounts for transport mechanisms in the bulk of the CVD reactor. In addition, the macroscopic model includes for the first time a detailed chemistry model based on comprehensive literature information, and describes the gas phase and the sur-face reactions of the precursor. The predictive capability of the model is validated through the comparison of the theoretical output with corresponding experimental results, namely with the deposition rate determined as a function of the deposition temperature.
Microstructural characteristics depend on process condi-tions, e.g., deposition temperature, operating pressure, and mass inflow rates. In a previous work,[21] we revealed the effect
of the root mean square (RMS), roughness on the electrical
resistivity of Al films. Similarly, it has been proven that surface roughness impacts the magnetoresistance and the magnetic properties of thin films through the increase of the in-plane demagnetization factor[22] as well as wetting and bio-properties
of surfaces.[23] From this discussion it comes out that the
effi-cient control of film properties passes through a consolidated relation between process parameters and films microstructural characteristics, such as the RMS roughness. This can be met
through the nanoscale modeling[24] and multiscale modeling[25]
of the CVD process. The linking between the two different length scales is performed through the deposition rate which is assumed to remain unchanged regardless the considered scale (see the Supporting Information).[26]
2. Results and Discussion
2.1. Morphological Observations and Elemental Composition
The microstructures of Fe films deposited at several tem-peratures between 130 and 250 °C are observed by scan-ning electron microscopy (SEM (and presented in Figure 1.
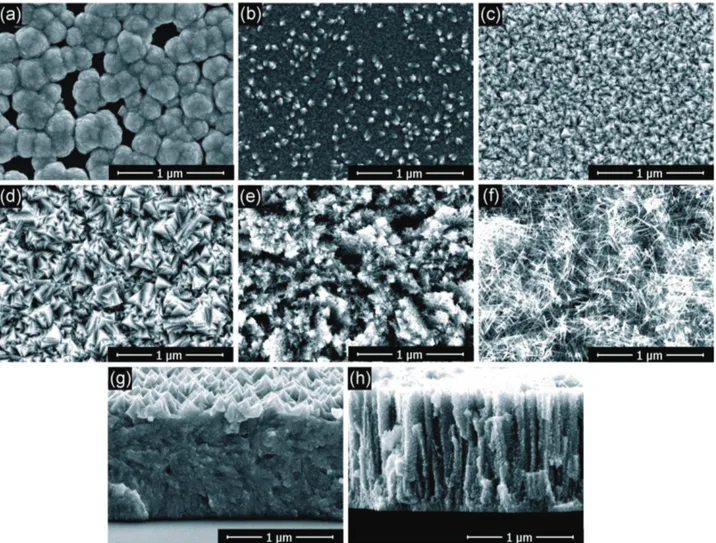
Figure 1. Surface SEM micrographs of Fe films deposited at a) 130, b) 150, c) 170, d) 190, e) 200, and f) 240 °C. Additional cross sections images are shown for g) Ts = 190 and h) 200 °C.
Surface micrographs are shown for surface temperatures
130 °C ≤ Ts ≤ 240 °C and cross sections are shown for
Ts = 190 and 200 °C. Deposition at the lowest Ts (Figure 1a)
shows scattered grains on the surface and yields films with
poor uniformity and no continuity. At Ts = 150 °C (Figure 1b)
faceted grains start to form and densify because of grains coalescence. The size of the grains varies, as it is shown in Figure 1b, where some larger grains emerge (bright con-trast). When the temperature is increased to 170 and then to
190 °C (Figure 1c,d), angular and sharply faceted grains are
formed with apparently homogeneous sizes. The high den-sity of the film and the sharply faceted grain morphology are confirmed from the cross section of Figure 1g. However, at
Ts = 200 °C (Figure 1e) the angular and faceted
characteris-tics of the grains are attenuated. They are gradually replaced
by an acicular morphology up to Ts = 240 °C (Figure 1f). The
acicular morphology may result in the increase of porosity, especially for temperatures higher than 200 °C. On the other hand, roughness decreases.
The cross section of Figure 1h at Ts = 200 °C, shows
a columnar morphology and limited faceting. Whereas films thickness is uniform at the temperature shown in
Figure 1g,h, it is relatively poor at lower Ts. Cross sections
above 200 °C were not observed, since these temperatures are off-range regarding the co-deposition of Fe with other
metals that we target. However, previous works[16,27]
comple-ment our SEM analysis by showing that films deposited above 200 °C or at higher temperatures present a smooth and lamellar morphology.
Measurement of the mass gain, assuming Fe bulk den-sity, gives an estimation of thickness of 3.4 (±0.1 µm) and 3.7 µm (±0.1 µm) for 190 and 200 °C, respectively, to be com-pared with SEM measurements of 3.5 (±0.05 µm) and 4.0 µm (±0.05 µm), respectively. The comparison of the film thick-nesses estimated by mass difference and measured by SEM reveals that the results are similar for the conformal and dense film (Figure 1d) and present small discrepancies for the film of lower density attributed to an increased porosity (Figure 1f).
The composition of the films deposited at Ts = 160, 200,
and 240 °C is investigated by electron probe microanalysis (EPMA). At 160 °C, Fe is 90% as O and C heteroatoms are up to 4% and 6%, respectively (at%). The C content may be due to the incomplete decomposition of the precursor on
the surface at this low Ts and its subsequent incorporation
into the film. At 200 °C, the Fe and O contents are slightly increased to ≈93% and 5.5%, respectively, whereas C is sig-nificantly decreased to ≈1.5%. The increased O contamination can be correlated with the increase of the decomposition rate of the reactants in the gas phase which subsequently leads to O incorporation in the films. The decomposition rate becomes even higher at more elevated temperatures (240 °C) and as a result the O contamination of the film is further increasing to ≈9% while Fe and C remain relatively stable (90%–91% and 1%–2%, respectively). Similar atomic compositions are also
reported by others.[14] The thermal metalorganic chemical
vapor deposition (MOCVD) of Fe from Fe(CO)5 results in
rela-tively pure films in which the O and C concentrations are a few at%.[9]
2.2. Dependence of the Fe Deposition Rate on Temperature and Pressure
Figure 2 presents the Arrhenius plot of the process where both
experimental measurements and macroscale computational predictions are shown. In the Arrhenius plot the deposition
rate continuously increases with increasing Ts up to 180 °C,
implying a kinetically limited regime. A transition regime is observed in the range 180–200 °C, where both surface pro-cesses and transport phenomena impact the process. In this range, the deposition rate reaches a plateau and a maximum
value at 200 °C. At higher Ts, competitive phenomena, such as
gas phase reactions or diffusion through the mass boundary layer, dominate the process and the deposition rate decreases.
The Arrhenius plot is in agreement with previous works[13]
where the deposition rate increases with increasing Ts below
200 °C, and remains relatively unaffected above. But more
recent studies,[8,13,14,16] show that beyond T
s = 200 °C the Fe
deposition rate drops in accordance with the present observa-tions. In absolute values, the Fe deposition rate is in
agree-ment with previous results,[8,13] where a value of 42 nm min−1
is obtained at 200 °C as compared to 60 nm min−1 at the same
temperature in the present work. The same dependence of the deposition rate on the surface temperature is observed in the
MOCVD of Ni from Ni(CO)4,[8,28] which belongs to the same
family of carbonyl precursors.
The computational predictions are in very good agreement with experimental data and the model is able to predict the behavior of the deposition rate over the entire temperature range. In particular, in the low temperature regime, the pre-dicted deposition rate approaches very well the corresponding experimental data and lies within deviations. The large
Figure 2. The Arrhenius plot of the CVD of Fe from Fe(CO)5. The
pres-sure is fixed at Preactor = 10 Torr. Experimental measurements (squares)
and computational results (line) are shown. Error bars correspond to the minimum and the maximum deviations of the deposition rate and include potential overestimations of the incubation time.
deviation shown for the lowest Ts experimental point comes
from a possible overestimation of the incubation time. As tem-perature increases, and up to 215 °C, the model continues to predict accurately the measured deposition rates. Above this temperature, the computational model follows the experimental trend that is, a steep reduction with a slight underestimation.
We now further explore the successful prediction of the behavior of the deposition rate. We compare the volumetric reaction rates and the mass fractions of the species which con-tribute to the deposition rate, in the range 215–223 °C, where the steep reduction of the deposition occurs.
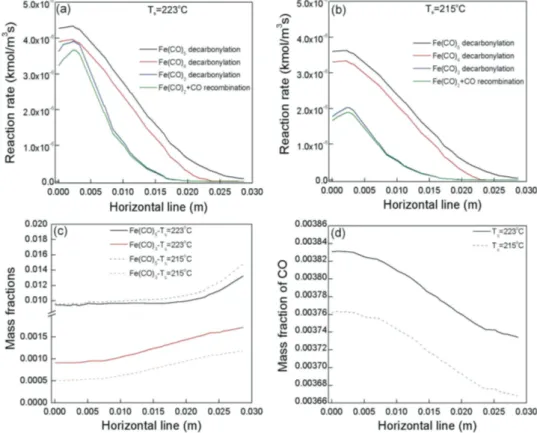
Figure 3 shows the volumetric reaction rates at Ts= 223 °C (Figure 3a) and Ts = 215 °C (Figure 3b), along a horizontal line
1 mm above the susceptor. Therefore it shows the radial distri-bution from the center of the susceptor (0 m in the x-abscissa). Reactions which are not shown yield zero reaction rates. At the
higher Ts the decomposition rates of the precursor and the
tet-racarbonyl and tricarbonyl intermediates are higher than the corresponding rates at Ts = 215 °C, resulting in the decrease of
the precursor available for Fe deposition. Interestingly enough,
the rate of recombination of Fe(CO)2 with CO (green lines) is
almost the same as the decomposition rate of Fe(CO)3 (blue
lines). As a result, the Fe(CO)2 decomposition (Table 1, G4)
and consequently the FeCO decomposition (Table 2, SR3) do
not occur, since all Fe(CO)2 intermediates are consumed in the
recombination with CO to form Fe(CO)3. The recombination
of Fe(CO)4 with CO yields null rates, consistent to literature
reports,[17] whereas the recombination of Fe(CO)
3 with CO
occurs at negligible rates (≈10−9 kmol m−3 s−1), due to the
consumption of the tricarbonyl by the surface reaction (Table 2, SR2).
Figure 3c shows the mass fractions of Fe(CO)5 and Fe(CO)3
at Ts = 223 °C (black and red solid lines, respectively) and
Ts = 215 °C (black and red dashed lines, respectively), still
1 mm above the susceptor. The mass fractions of the other
car-bonyl species are null. Following the trend of Fe(CO)5
decar-bonylation for these two temperatures, the Fe(CO)5 available
for the surface reaction decreases at Ts= 223 °C. On the other
hand, Fe(CO)3 increases with the increased decomposition of
Fe(CO)5. This trend is reinforced in the vicinity of the susceptor
where the temperature is higher (see also Figure 4a,b, left) and eventually, this combination leads to the decrease of the dep-osition rate. As shown in Figure 3d, the CO mass fraction is higher at Ts = 223 °C contributing to a higher inhibition of the
surface processes by CO (Equation (3)) and subsequently to the decrease of the deposition rate. Thus, the model validates the two main reasons for the reduction of the deposition rate at high temperatures that is, increased decomposition rate of the
precursor and poisoning of the surface by CO.[19,21]
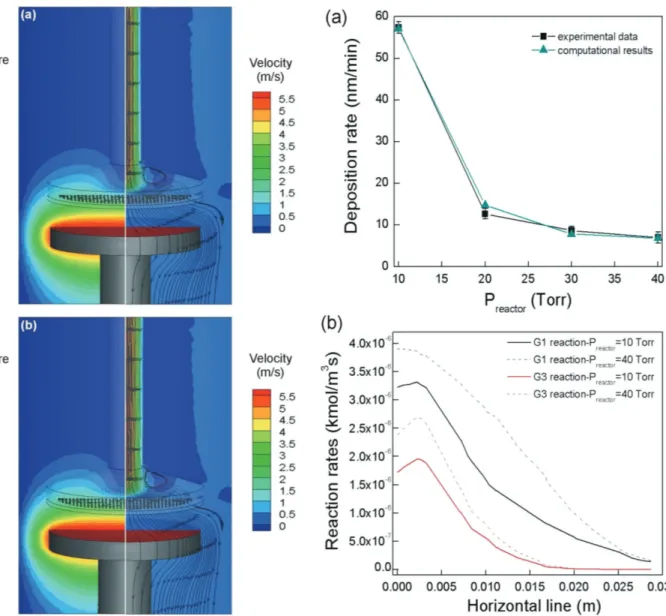
Figure 4 shows the temperature (left) and the gas velocity
profiles (right) at Ts = 223 °C (Figure 4a) and Ts = 215 °C
(Figure 4b). In both conditions, the temperature increases
Figure 3. The volumetric reaction rates at Ts a) 223 °C and b) 215 °C. For both figures the black lines correspond to Fe(CO)5 decarbonylation (Table 1,
G1), the red lines to Fe(CO)4 decarbonylation (Table 1, G2), the blue lines to Fe(CO)3 decarbonylation (Table 1, G3) and the green lines to Fe(CO)2 +
CO recombination (Table 1, G3′). Other reactions give zero rates. c) The mass fractions of Fe(CO)5 (black lines) and Fe(CO)3 (red lines) at Ts = 223
(solid lines) and 215 °C (dashed lines). d) The mass fraction of CO at Ts= 223 (solid line) and 215 °C (dashed line). All the quantities are calculated
closer to the susceptor and accelerate the gas phase
decomposi-tion of Fe(CO)x species. In the right panels of Figure 4a,b, it
is shown that in both cases the mixture reaches the susceptor with a velocity of 0.5 m s−1 and the streamlines reveal that there is a higher concentration at the edges of the susceptor. This fact justifies the elevated concentration of Fe(CO)5 at this part of the
reactor, as observed in Figure 3c as well as the elevated Fe depo-sition rate (not shown).
We now investigate the effect of the operating pressure,
Preactor, on the Fe deposition rate in the range 10–40 Torr at the
fixed temperature Ts = 180 °C. The results of this investigation
are presented in Figure 5a, for both experimental measure-ments (black squares with black trendline) and computational predictions (cyan triangles with cyan trendline). An
eight-fold decrease of the deposition rate from 58 to 7 nm min−1 is
observed when Preactor is increased from 10 to 40 Torr. A
sim-ilar trend has been observed in a previous work,[16] where the
increase of the pressure is achieved by adding CO in the input
gas mixture and in the case of the CVD of Ni from Ni(CO)4.[28]
The macroscale computational predictions capture the decrease and the overall behavior of the deposition rate and show very good agreement against the experimental data. In Figure 5b,
we present the decomposition rates of Fe(CO)5 and Fe(CO)3.
The results are shown for Preactor = 10 Torr and Preactor = 40 Torr
along a horizontal line located 1 mm above the susceptor. By
increasing the pressure the decomposition rates of Fe(CO)5
and Fe(CO)3 are increased. This results in the reduction of the
deposition rate. Moreover, the increase of Preactor leads to the
decrease of the mass diffusion coefficients of these two species
for an order of magnitude. For these two pressures, the Peclet number, Pe, which provides relative magnitude for diffusion and convection effects, equals Pe = 0.95 at Preactor = 10 Torr and
Pe = 0.89 at Preactor= 40 Torr. That is, in both pressures Pe < 1
and diffusion phenomena dominate the process. Consequently,
the concentration of Fe(CO)5 and Fe(CO)3 at the susceptor are
lower and the deposition rate is decreased. Thus, the model illustrates that the two main reasons for the reduction of the deposition rate at high pressures are the increased gas phase decomposition rate of the precursor and the decrease of the mass diffusion coefficients of the reactants to the substrate.
2.3. Dependence of RMS Roughness on Temperature
Macroscopic deposition rates are used to fit the s0 needed in
the adsorption rate expression of the stochastic algorithm (Equation (S1), Supporting Information). Figure 6a presents the dependence of the RMS roughness on the temperature for both experimental measurements and computational pre-dictions. We observe that the RMS initially increases up to 150 °C, from 0.67 to 0.75 µm. Above this temperature and up to 190 °C, it monotonously decreases from 0.75 to 0.48 µm. The film at 160 °C (fourth point from the left) peeled off during the scratching of the surface and for this reason it is probably off the trend. Beyond 200 °C, the RMS decreases and tends to sta-bilize at 0.16 µm in the range 230–250 °C.
The behavior of the RMS roughness is a partial indicator of the change of the microstructure. As shown in Figure 1, at the lowest temperature the coverage of the surface is poor and no faceted crystals are observed. The increase of the deposition temperature up to 150 °C results in the enhanced surface cov-erage and in angular crystals which are sharply faceted. How-ever, the variation of the size of the crystals leads to higher differences between the maximum and the minimum surface heights and to the increase of the RMS. In the temperature range 160–190 °C, the size distribution is more homogeneous, resulting in a monotonous decrease of the roughness. Above 200 °C the change of the crystal structure from angular and fac-eted to acicular results to the sharp decrease of the RMS and then to its stabilization.
It can be seen that the multiscale framework predicts with sufficient accuracy the general behavior of the RMS in the investigated temperature range. However, discrepancies exist at
particular Ts. We have seen from the experimental results that
at the lowest Ts the coverage of the surface is poor. This feature
can lead to an underestimation of the roughness during meas-urements. Additionally, neglecting the uncovered Si surface in the calculations may cause errors at this temperature. Up to 160 °C, the model predicts the small changes in RMS quite well, except for the measurement at 130 °C, where the surface
of the film lacks conformal coverage. Moving at higher Ts and
until 190 °C, the experimental RMS decreases and the com-putational predictions follow this trend. However, the step of abrupt reduction between 190 and 200 °C cannot be captured.
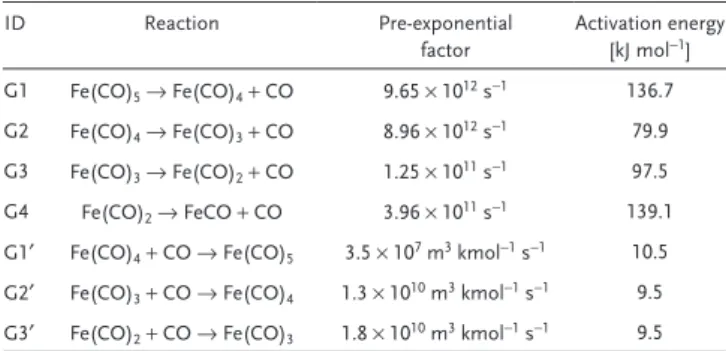
As discussed, this reduction is attributed to the change of the crystals morphology from sharp-faceted to acicular. The multiscale model does not simulate the morphology of the crystals accurately and as a consequence, a smoother decrease Table 1. The decomposition and the recombination gas phase
reac-tions of Fe(CO)x, x = 1 − 5. The Arrhenius rate expressions are given by
Equations (1) and (2). ID Reaction Pre-exponential factor Activation energy [kJ mol−1] G1 Fe(CO)5 → Fe(CO)4 + CO 9.65 × 10¹² s−1 136.7 G2 Fe(CO)4 → Fe(CO)3 + CO 8.96 × 10¹² s−1 79.9 G3 Fe(CO)3 → Fe(CO)2 + CO 1.25 × 10¹¹ s−1 97.5 G4 Fe(CO)2 → FeCO + CO 3.96 × 10¹¹ s−1 139.1
G1′ Fe(CO)4 + CO → Fe(CO)5 3.5 × 10⁷ m3 kmol−1 s−1 10.5
G2′ Fe(CO)3 + CO → Fe(CO)4 1.3 × 10¹⁰ m3 kmol−1 s−1 9.5
G3′ Fe(CO)2 + CO → Fe(CO)3 1.8 × 10¹⁰ m3 kmol−1 s−1 9.5
Table 2. The applied surface chemistry model. Reaction rates are given
by the Langmuir–Hinshelwood type expression of Equation (3). The pre-exponential factor of reaction SR4 is given in Torr−1, for consistency with the units of Fluent.
ID Reaction Pre-exponential
factor
Activation energy [kJ mol−1]
SR1 Fe(CO)5 → Fe(s) + 5CO(g) 2.4 × 10⁷ m s−1 27.9
SR2 Fe(CO)3 → Fe(s) + 3CO(ads) →
Fe(s) + 3CO(g) 5.3 × 10⁷ m s−1 75.3 SR3 FeCO → Fe(s) + CO(ads) → Fe(s) + CO(g) 3.7 × 10¹⁰ m s−1 19.3 SR4 CO adsorption 3.8 × 10⁸ Torr−1 89.9
of the RMS between these two Ts is predicted. At higher
tem-peratures, it is shown that the computed RMS reaches a pla-teau; the computational predictions capture well the experi-mental trend.
We now analyze the occurrence of the kinetic Monte Carlo algorithm events, i.e., adsorption, migration, and desorption. Figure 6b shows the number of surface events—adsorption,
desorption, and migration—as a function of Ts. We observe
that in the entire temperature range, the number of adsorp-tion events is much higher than the corresponding number of migration and desorption events, and consequently adsorp-tion dominates the process. The trend of adsorpadsorp-tion events seems to follow the behavior of the deposition rate (Figure 2)
and of s0 in the investigated temperature range (Equation (S1),
Supporting Information), i.e., it increases up to a maximum
value at Ts = 200 °C, and then it decreases. This is expected
since the adsorption rate incorporates s0, and it is assumed to
express the chemical information incorporated in the sticking coefficient. Despite the predominance of adsorption, the impact of the migration, which is not fitted, on the RMS roughness is significant. In particular, it can be seen that as the number of migration events increases, the surface roughness decreases. At higher temperatures in the range 230–250 °C, the number of migration events stabilizes explaining the plateau which is observed for RMS in Figure 6a. The number of desorption events slightly increases up to 200 °C and increases faster up to 250 °C, where they become equal to migration events. It is noted that during the simulations we have observed desorption of Fe atoms with one neighbor, exclusively, in consistence with literature where it is reported that at temperatures up to 250 °C Figure 5. a) The dependence of the deposition rate on Preactor for both
experiments (black squares with black trendline) and computational pre-dictions (cyan triangles with cyan trendline). Error bars correspond to the minimum and the maximum deviations of the deposition rate. The tem-perature is fixed at Ts= 180 °C. b) The decomposition rates of G1 (Table 1,
black lines) and G3 (Table 1, red lines). All the quantities are calculated along a horizontal line 1 mm above the susceptor and are plotted against the radial distribution from the center of the susceptor.
Figure 4. The temperature (left) and the gas velocity (right) profiles
inside the reactor during the CVD of Fe from Fe(CO)5 at Ts a) 223 and
b) 215 °C. The streamlines added to the velocity profiles show the flow of the mixture inside the reactor.
the probability to detach an atom with more than one neigh-bors is negligible.[29]
3. Conclusions
The CVD of Fe from Fe(CO)5 is investigated with the aim to
understand and control the behavior of the deposition rate as a function of temperature in the range 130–250 °C and operating pressure at 10–40 Torr. Moreover, the evolution of the rough-ness is correlated with the deposition temperature within the investigated temperature range.
Deposition results in a relatively pure chemical composi-tion with only a few percent of O and C heteroatoms origi-nating from the precursor. The surface morphology varies with increasing temperature and these variations are correlated with the final surface roughness. In the range 190–200 °C, a transi-tion from sharply faceted to acicular morphology is observed which breaks the observed trend.
The Arrhenius plot of the process reveals three regimes. The surface reaction limited regime lies within the tempera-ture range 130–180 °C. Between 180 and 200 °C, both surface reactions and transport phenomena impact the process. In this range, the Fe deposition rate shows a maximum value of
≈60 nm min−1 at 200 °C. Beyond this temperature, the process
is controlled by the diffusion of the reactants through the mass transport boundary layer to the surface and the deposition rate of Fe decreases abruptly. The macroscopic computational model including the chemistry mechanisms of the process (seven gas phase reactions and three surface reactions) predicts with high accuracy the behavior of the deposition rate in the examined temperature range. It further shows that the steep reduction of the deposition rate at high temperatures is attributed to the high gas phase decomposition rates of the species contributing to the Fe deposition and to the inhibition of the surface from the CO ligand whose surface concentration increases with increasing temperature. Concerning the dependence of the deposition rate on the operating pressure, the combined experi-mental and computational investigation shows that as pressure increases the gas phase decomposition rates increase and the
mass diffusion coefficients of Fe(CO)5 and Fe(CO)3 decrease.
As a result the concentration of these species at the surface decreases and consequently, the deposition rate decreases.
Following the macroscopic computational analysis, a multi-scale framework is developed to simulate the surface of Fe films. The framework predicts the RMS measurements with sufficient accuracy but discrepancies exist. The most important of them lie in the range 190–200 °C. In this range, the model shows a monotonous decrease of RMS whereas experimental data show a steep reduction. This discrepancy is attributed to the fact that no information is incorporated in the model con-cerning the morphology of the crystals and thus, the alteration of the microstructure in this range cannot be predicted. Finally, multiscale simulations at higher temperatures follow the exper-imental trend, i.e., the stabilization of RMS, in correlation with the number of migration events that reach a plateau.
The developed multiscale computational framework can be implemented to perform simulations for more detailed sys-tems. The incorporation of chemical reactions at the nanoscale and the consideration of the correct crystallographic structure (bcc for Fe) of the developed material within the nanoscale algo-rithm may allow the simulation of more surface features, such as island or mounts formation during the Fe growth.
4. Macroscopic Model—Chemistry Mechanism
4.1. Gas Phase Reaction and Kinetics
The gas phase scheme consists of successive decarbonylation steps of the pentacarbonyl precursor and recombination of Figure 6. a) Evolution of RMS roughness with surface temperature, Ts.
Experimental data (black squares and trendline) and multiscale predic-tions (cyan triangles and trendline) are shown. b) The number of surface events as a function of Ts. Adsorption, migration, and desorption are
the free CO ligands with carbonyl intermediates.[11,12,17–20,30,31]
The detailed description of the steps is given in the Sup-porting Information. The gas phase reactions with their cor-responding energies are summarized in Table 1. For this scheme, we modify the Arrhenius law implemented in Fluent to account for the stoichiometry of the reactions. We define two types of Arrhenius reaction rates corresponding to forward (G1–G4) and inverse reactions (G1′–G3′); they are designated by Equations (1) and (2), respectively
exp G 0, G , G gas Fe(CO) , gas i i i i R k E RT C a = − (1) exp G 0,G , G gas
Fe(CO) , gas CO, gas
i i ii i R k E RT C C a = − ′ ′ ′ (2)
where RGi and RG′i denote the identity of reactions, CFe(CO) , gasi and
CCO,gas are the gas phase concentrations of each carbonyl
spe-cies and CO, respectively, Ea, Gi and Ea, Gi′ are the activation ener-gies of the decomposition and the recombination reactions, respectively, and Tgas is the temperature of the gas phase in the
reactor. The values of the pre-exponential factors of the reverse reactions, k0,G′i, are obtained from Seder et al.[17] The pre-expo-nential factors of the forward reactions, k0,Gi, are fitted to the experimental data. In order to fit the unknown pre-exponential factors of the gas-phase reactions, the process is simulated first at the high-temperature regime, where the gas phase reaction rates are high and gas phase processes becomes dominant for the deposition process. The fitting of these parameters is facili-tated by the fact that not all the reactions have the same impact on the behavior of the deposition rate (see Section 2). The pre-exponential factors fitted in the diffusion-limited regime are applied for the simulation of the process in the whole tem-perature range for a fine tuning. Values of the pre-exponential factors for each reaction are summarized in Table 1.
4.2. Surface Reactions and Kinetics
The surface reaction pathway that we propose combines the
works reported in the literature. The Fe(CO)5 which does not
undergo gas phase dissociation, reaches the heated surface and reacts completely for the formation of Fe and five CO groups. For the activation of this reaction, the activation energy of
27.9 kJ mol−1 is used, estimated by the slope of the Arrhenius
plot in the reaction-limited regime which is in good agreement with the value of 26 ± 2 kJ mol−1 reported elsewhere.[9] Then,
we consider that the gas phase Fe(CO)3 which does not
decom-pose, reaches the surface and decomposes to Fe and three CO ligands with an activation energy of 75.3 kJ mol−1.[11] Finally, the
FeCO produced by the successive gas phase decarbonylations of the pentacarbonyl precursor may contribute to the surface deposition of Fe. The activation energy for its bond dissociation equals 19.3 kJ mol−1.[31] The surface reactions with their
corre-sponding activation energies are summarized in Table 2. In the above proposed scheme for the surface reactions, we do not consider the exact surface pathway for deposition from
Fe(CO)3, which includes first, its surface adsorption and then
its decomposition to Fe(CO)4, Fe(CO)3 and Fe. Instead, we
neglect the adsorption of Fe(CO)5 and we use the gas phase
Fe(CO)3 which reaches the surface, as a source of Fe. In this
way, we incorporate its effect on the process and at the same time, we keep the model as simple as possible. It has to be noted that the implementation of a 10-reactions chemistry model (Tables 1 and 2) with their corresponding kinetic rate equations (Equations (1), (2), and (3)) is a complicated task. Thus, we choose to examine first the accuracy of this realistic model with regard to experimental results.
As we briefly discussed in the Introduction, the steep reduc-tion of the deposireduc-tion rate at high temperatures can be attrib-uted to high gas phase decomposition rate of the precursor and to the poisoning of the surface by CO ligand. Since no adsorp-tion states of the precursor, of its intermediate products or of the CO ligands are incorporated in the model, the effect of CO on the deposition rate can be investigated macroscopically by applying a Langmuir–Hinshelwood type kinetic expression, which is given by the following equation
exp 1 exp S S , S s Fe(CO) , sur CO , CO s CO, sur i i i i R k E RT C k E RT P a a = − + − (3)
where RSi is the reaction rate of each surface reaction, CFe(CO) , suri is the concentration of the Fe(CO)5, Fe(CO)3, and FeCO species
at the surface, Ts is the surface temperature, Ea, Si is the activa-tion energy of each surface reacactiva-tion and kSi is the
pre-exponen-tial factor of the reaction Si, which is fitted to the experimental
data. For the fitting of these parameters, the process is first simulated at the reaction-limited regime where surface reac-tions are more important than gas phase reacreac-tions or diffusion mechanisms. Then, simulations are performed in the whole temperature range for the better fitting of the pre-exponential factors. The denominator of Equation (3), which is referred as SR4 in Table 2, expresses the inhibition of the deposition
pro-cess by the adsorption of CO. Ea,CO is the adsorption energy of
CO which is taken to be 89.9 kJ mol−1,[10] P
CO,sur is the partial
pressure of CO at the boundary of the surface and kCO is the
pre-exponential factor of this process. The latter is fitted to the experimental data as described before, by starting from the dif-fusion-limited regime, where inhibition by CO is more likely. The values of the pre-exponential factors for each reaction are summarized in Table 2. The implementation of the Langmuir– Hinshelwood expression is performed through user defined functions files.[32]
5. Experimental Section
Deposition of Fe was performed in a vertical, cylindrical, stagnant flow, cold wall, stainless steel CVD reactor which has been previously described in detail.[21,33] Independent experiments were performed
at 13 different Ts, in the range 130–250 °C for a fixed pressure of
Preactor= 10 Torr and at four different Preactor, in the range 10–40 Torr,
for a fixed Ts = 180 °C. The deposition duration for all experiments was
by visual observation of the substrate surface through the windows of the reactor and it was only used in the present study to determine the net experimental deposition rate. The rough optical estimation of this parameter might lead to overestimation of the deposition rate, since what it was assumed to be incubation was actually the upper limit of the incubation time. Such overestimations in the measurements of the deposition rate were included in the error bars of the Arrhenius plot (Figure 2).
Samples morphology observations and estimation of the film thickness from cross section images of the film were performed using SEM on a LEO 435 VP microscope running at 15 keV. Surface roughness of Fe films was determined by stylus profilometry (Tencor P16+) across a 1 mm surface line with a lateral resolution of 0.5 µm. EPMA was used to determine the chemical composition of the films and in particular, the O and C content. It was performed with a Cameca SXFive apparatus operating at 15 keV and 20 nA, and calibrated using a high purity Fe standard.
Supporting Information
Supporting Information is available from the Wiley Online Library or from the author.
Acknowledgements
This work was partially funded by the Institut Français du Petrole et des Energies Nouvelles (IFPEN) through the contract #268821. I.G.A. acknowledges the financial support provided by the National Scholarship Foundation of Greece (IKY-Siemens Program, Grant number: #SpnD/11160/13β). The authors acknowledge Ph. De Parseval and L. Mazenq (LAAS) for their help with EPMA and profilometry measurements. The authors are indebted to the European Integrated Center for the Development of New Metallic Alloys and Compounds (C-MAC) for support.
Conflict of Interest
The authors declare no conflict of interest.
Keywords
chemistry mechanisms and kinetics, CVD of Fe, macro/nanoscale modeling, microcilia, roughness simulation
[1] a) R. Wiesendanger, Nat. Rev. Mater. 2016, 1, 16044; b) M. N. Baibich, J. M. Broto, A. Fert, F. Nguyen van Dau, F. Petroff, P. Etienne, G. Creuzet, A. Friederich, J. Chazelas, Phys. Rev. Lett.
1988, 61, 2472.
[2] a) F. Rottman, F. Dettman, Sens. Actuators, A 1991, 27, 763; b) B. Dieny, V. S. Speriosu, S. Metin, S. S. P. Parkin, B. A. Gurney, P. Baumgart, D. R. Wilhoit, J. Appl. Phys. 1991, 69, 4774; c) J. P. Liu, Y. Liu, C. P. Luo, Z. S. Shan, D. J. Sellinger, J. Appl. Phys. 1997,
81, 5644; d) F. J. Cadieu, T. D. Cheung, L. Wickramasekara,
N. Kamprath, H. Hegde, N. C. Liu, J. Appl. Phys. 1987, 62, 3866.
[3] A. T. Macrander, J. A. Long, V. G. Riggs, A. F. Bloemeke, W. D. Johnston Jr., Appl. Phys. Lett. 1984, 45, 1297.
[4] M. Armbrüster, K. Konvir, M. Friedrich, D. Teschner, G. Wowsnick, M. Hahne, P. Gille, L. Szentmiklósi, M. Feuerbacher, M. Heggen, F. Girgsdies, D. Rosenthal, R. Schlögl, Y. Grin, Nat. Mater. 2012, 11, 690.
[5] V. Krisyuk, A. N. Gleizes, L. Aloui, A. Turgambaeva, B. Sarapata, N. Prud’homme, F. Senocq, D. Samélor, A. Zielinska-Lipiec, D. de Caro, C. Vahlas, J. Electrochem. Soc. 2010, 157, D454, and references therein.
[6] a) N. Pachauri, B. Khodadadi, A. V. Singh, J. B. Mohammadi, R. L. Martens, P. R. LeClair, C. Mewes, T. Mewes, A. Gupta, J. Magn.
Magn. Mater. 2016, 417, 137; b) M. Lubej, I. Plazl, Chem. Eng. J. 2014, 242, 306; c) N. Berry, M. Cheng, C. L. Perkins, M. Limpinsel,
J. C. Hemminger, M. Law, Adv. Energy Mater. 2012, 2, 1124. [7] a) S. Mlowe, D. J. Lewis, M. A. Malik, J. Raftery, E. B. Mubofu,
P. O’Brien, N. Revaprasadu, Dalton Trans. 2016, 45, 2647; b) R. A. Hussain, A. Badshah, A. Younis, M. D. Khan, J. Akhtar, Thin
Solid Films 2014, 567, 58; c) G. Fornalczyk, M. Valldor, S. Mathur, Cryst. Growth Des. 2014, 14, 1811; d) D. Peeters, G. Carraro,
C. Maccato, H. Parala, A. Gasparotto, D. Barreca, C. Sada, K. Kartaschew, M. Havenith, D. Rogalla, H.-W. Becker, A. Devi, Phys.
Status Solidi A 2014, 211, 316; e) S. Saeed, R. Hussain, R. J. Butcher, J. Coord. Chem. 2014, 67, 1693; f) R. Mantovan, S. Vangelista,
S. Cocco, A. Lamperti, O. Salicio, J. Appl. Phys. 2012, 111, 3; g) S. D. Disale, S. S. Garje, Appl. Organomet. Chem. 2010, 24, 734. [8] P. A. Lane, P. J. Wright, P. E. Oliver, C. L. Reeves, A. D. Pitt,
J. M. Keen, M. C. Ward, M. E. Tilsley, N. A. Smith, B. Cockayne, I. Rex Harris, Chem. Vap. Deposition 1997, 3, 97.
[9] R. B. Jackman, J. S. Foord, Surf. Sci. 1989, 209, 151. [10] H. E. Carlton, J. H. Oxley, AIChE J. 1965, 11, 79. [11] F. Zaera, Surf. Sci. 1991, 255, 280.
[12] M. Xu, F. Zaera, Surf. Sci. 1994, 315, 40.
[13] P. A. Lane, P. J. Wright, J. Cryst. Growth 1997, 204, 298.
[14] F. Senocq, F.-D. Duminica, F. Maury, T. Delsol, C. Vahlas,
J. Electrochem. Soc. 2006, 153, G1025.
[15] Y. H. Low, J. H. Montgomery, H. S. Gamble, ECS Trans. 2007, 2, 167. [16] P. Zhang, E. Mohimi, T. K. Talukdar, J. R. Abelson, G. S. Girolami,
J. Vac. Sci. Technol. A 2016, 34, 051518.
[17] T. A. Seder, A. J. Ouderkirk, E. Weitz, J. Chem. Phys. 1986, 85, 1977. [18] L. S. Sunderlin, D. Wang, R. R. Squires, J. Am. Chem. Soc. 1992,
114, 2788.
[19] L. A. Barnes, M. Rosi, C. W. Bauschlicher Jr., J. Chem. Phys. 1991,
94, 2031.
[20] O. Gonzáles-Blanco, V. Branchadell, J. Chem. Phys. 1999, 110, 778. [21] a) I. G. Aviziotis, N. Cheimarios, T. Duguet, C. Vahlas,
A. G. Boudouvis, Chem. Eng. Sci. 2016, 155, 449, and references therein; b) I. G. Aviziotis, Ph.D. Thesis, National Technical University of Athens, Greece, 2016.
[22] G. Choe, M. Steinback, J. Appl. Phys. 1999, 85, 5777.
[23] a) E. Bormashenko, T. Stein, G. Whyman, Y. Bormashenko, R. Pogreb, Langmuir 2006, 22, 9982; b) V. P. Zhdanov, K. Rechendorff, M. B. Hovgaard, F. Besenbacher, J. Phys. Chem.
B 2008, 112, 7267.
[24] a) C. C. Battaile, D. J. Srolovitz, Annu. Rev. Mater. Res. 2002, 32, 297; b) C. Cavallotti, A. Barbato, A. Veneroni, J. Cryst. Growth 2004,
206, 371; c) A. Chaterjee, D. G. Vlachos, J. Comput.-Aided Mater. Des. 2007, 14, 253; d) D. T. Gillespie, J. Phys. Chem. 1977, 81, 2340;
e) D. T. Gillespie, J. Chem. Phys. 2001, 115, 1716.
[25] a) N. Cheimarios, S. Garnelis, G. Kokkoris, A. G. Boudouvis,
J. Nanosci. Nanotechnol. 2011, 11, 8132; b) P. D. Christofides,
A. Armaou, Y. Lou, A. Varshney, in Control Engineering Series (Ed: W. S. Levine), Birkhäuser, Boston, MA, 2008; c) Y. Lou, P. D. Christofides, Chem. Eng. Sci. 2003, 58, 3115; d) S. T. Rodgers, K. F. Jensen, J. Appl. Phys. 1998, 83, 524.
[26] M. Masi, V. Bertani, C. Cavallotti, S. Carra, Mater. Chem. Phys. 2000,
66, 229.
[27] T. Delsol, F. Maury, F. Senocq, in Fifteenth European
Confer-ence on Chemical Vapor Deposition (EUROCVD-15), Proceedings
Vol. 2005–09 (Eds: A. Devi, R. Fischer, H. Parala, M. Allendorf, M. Hitchman), The Electrochemical Society Inc., NJ, 2005, pp. 638–643.
[28] F. Fau-Canillac, F. Maury, Surf. Coat. Technol. 1994, 64, 21. [29] J. G. Amar, F. Family, Phys. Rev. Lett. 1995, 74, 2066.
[30] C. Dateo, T. Gökçen, M. Meyyappan, J. Nanosci. Nanotechnol. 2002,
2, 523.
[31] A. Ricca, Chem. Phys. Lett. 2001, 350, 313.
[32] Ansys/Fluent v12.1sp1. Documentation. Ansys Inc., 2009.
[33] a) T. C. Xenidou, A. G. Boudouvis, N. C. Markatos, D. Samélor, F. Senocq, N. Prud’homme, C. Vahlas, Surf. Coat. Technol.
2007, 201, 8868; b) T. C. Xenidou, N. Prud’homme, C. Vahlas,
N. C. Markatos, A. G. Boudouvis, J. Electrochem. Soc. 2010, 157, D633.