an author's http://oatao.univ-toulouse.fr/23145
Nasri, Mondher and Abbassi, Fethi and Garnier, Christian and Labanieh, Amad and Dalverny, Olivier and Zghal, Ali Numerical models of fabric behaviour using hybrids discrete elastic and hypoelastic modelling. (2018) In: 7th International Symposium on Aircraft Materials (ACMA2018), 24 April 2018 - 26 April 2018 (Compiègne, France).
Numerical models of fabric behaviour using hybrids discrete elastic
and hypoelastic modelling
M. Nasri (1) (2), F. Abbassi (3), C. Garnier (2), A. R. Labanieh(4), O. Dalverny (2), A. Zghal(1)
(1)URMSSDT, ENSIT, University of Tunis, 5 Avenue Taha Hussein, BP, 56, Bâb Manara, 1008 Tunisia, (2)University of Toulouse, INP-ENIT/LGP, 47 Avenue d’Azereix, Postal Code 65016 Tarbes, France,
[email protected], [email protected], [email protected].
(3)Mechanical Engineering Department, College of Engineering, Dhofar University, PO Box 2509, Postal Code 211 Salalah, Sultanate of Oman,[email protected].
(4)Laboratoire Génie et Matériaux Textiles (GEMTEX), ENSAIT, 95170 Roubaix, France, [email protected].
Abstract
This paper present two hybrids discrete continuous models for the simulation of woven fabric reinforcement preforming via explicit finite element analysis. There approaches are based 1D elements on a beam or nonlinear connectors, and 2D element account for shearing resistance of the fabric. The first developed model is built using linear and nonlinear connectors to take into account the tensile stiffness of the fabric, and a shell elastic isotropic element. The second model is based on nonlinear elements and the hypo-elastic behaviour. The determination of the material parameters is straightforward from tensile and bias extension tests. These proposed approaches have been implemented in the ABAQUS explicit finite element programs via subroutine VUMAT. There models allows the simulation of industrial part forming in a reasonable computational time. Simulations of the hemispherical shape of woven fabric 48600 C1300 have been implemented to highlight the performance of these models.
1. Introduction
The composite forming materials with woven reinforcements are generally obtained by stamping or preforming. Their use in the automotive and aerospace industries requires the realisation of a range of simulation on reinforcements: To predict the feasibility of shaping reinforcements, there are several meso and macro numerical structural model.
The investigation of the numerical shear behaviour and stiffness of technical woven fabric are essential to guarantee the performance of the final product. Different approaches used for the simulation of woven reinforcement, using a geometric, continuous, discrete or semi-discrete [1]. The geometric approach consists to place a net on a surface along geodesic linens. The result is the same regardless of the used material [2] .Indeed, although the result of the shaping depends on the mechanical characteristics of the reinforcement. Moreover, the boundary conditions in terms of forces, that is to say, for example, the forces created by the tools (blank holder in particular), are not taken into account [2]. In the continuous approach, the woven fabric is considered a continuous medium juxtaposed and the mechanical behaviour of which is equivalent to those of the textile reinforcements. Three continuous approaches are described within a membrane and shell assumption (continuous non-orthogonal elastic, continuous hypoelastic and continuous hyperplastic) [3]. The discreet approach represents the
reinforcement as an elementary physical cell, which uses finite elements of bars, beams, membranes or shells. In several publications, the focus of the simulation is on representing the arrangement and interaction of the discrete of woven [4]. Ben Boubaker et al. [5] proposed a modelling of woven reinforcements based on mass-spring system modelling the different behaviours. In [6-8] Sharma et al. proposed a model based on an elementary cell constructed only with elastic bars on the sides and elasto-plastic bar positioned according to one of the diagonals to model the nonlinear shear behaviour. Finally, the semi-discreet approach is a combination of the continuous and discreet approach. This approach is based on the virtual work theorem, which links internal, external and acceleration works in the virtual displacement field [10]. The present paper aims to present a comparison of two hybrids discrete models for finite element modelling of woven fabrics. The first one is using elastic isotropic shell elements and axial connectors used by W. Najjar [9]. The second using hypoelastic elements reinforced by specialised connectors to show the effect of the non-linearity of the yarns behaviour, thus the anisotropy of the carbon reinforcements. Four hypotheses have been issued about the behaviour of dry woven reinforcements: The stiffness’s of the reinforcements in tension is important, the low shear stiffness. The flexural and compressive stiffness are negligible, and the variation between yarns is important. The following aspects are presented in this paper:
- Mathematical description of their models
- Validation of the models on a more complex state of deformation (i.e. bias-extension test and forming simulation of a three-dimensional shape).
2. Numerical description models of woven fabric 2.1 Hybrid discrete continuous elastic model
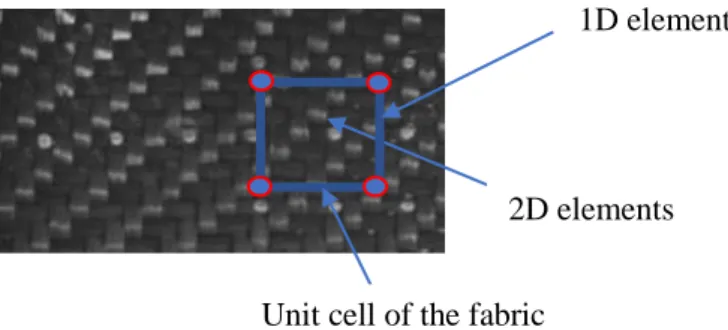
The hybrid discrete elastic model description of the fabric is built using a mesh of 1D and 2D elements of unit cell of the fabric (figure 1). This model includes the following parameters: l is the element dimension and K0 0 (in the case of linear approach) or (Fc,
Uc) are the stiffness of the connectors associated with the connectors, in the case of
nonlinear approach. E11, E22, and e are respectively the stiffness, Poisson’s ratio and
thickness of woven fabric of elastic continuous elements.
Figure 1:Principle of the hybrid discrete mesoscopic modelling using a combination of 1-D and 2-D element
Unit cell of the fabric
1D element
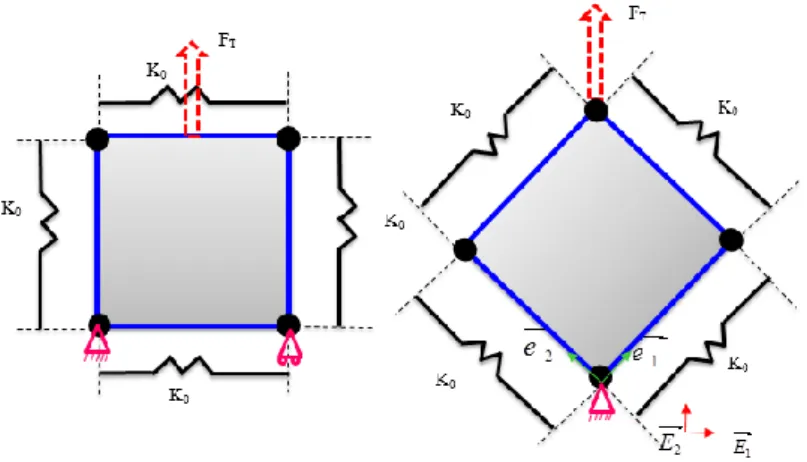
An analytical study of the elementary cell subjected to tensile and shear loading in the direction E2 is formed as shown in figure 2
Figure 2: Simplified digital models of cells: Tension and shear behaviour
In the case of tension, the total force exerted on the cell decomposes it in two terms; the force supported by the connectors and shell expressed by:
F F K l Ee l FT C shell 0 2 1 . ) . . 2 ( (1)Where E the Young’s modulus, v is the Poisson’s ratio and e is the thickness of the element. In the case of shear. The shear angle is given as a function of displacement d and the length of connector l0 by:
0 0 2 2 cos 2 2 l l d ar (2)
The hypothesis of elastic large deformation behaviour is adopted; the law of shear behaviour can be calculated:
L
G
. (3)
Where G is the modulus of rigidity and
L
is the logarithmic shear strain:
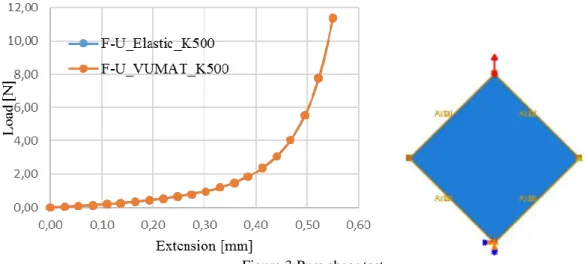
2 4 tan ln L (4) The maximum shear angle is determined by the angle between two connectors each characterising a yarn direction. A VUMAT algorithm was developed to determine the logarithmic shear strain, thus the shear angle given by the expression (4). A numerical test, as shown in the figure 3, was carried out on a hybrid element. The parameters used for the continuous element are length l0 = 1 mm , E = 20 MPa, v = 0.3, e = 0.1 mm.
Figure 3:Pure shear test
2.1.1
1D 1inear elementsAccording to the linear or non-linear case, a uniaxial tensile test is identified, in either each direction in the case of unbalanced reinforcements, a constant stiffness K, or a force / displacement law. The uniaxial tensile test consists of identifying the stiffness of
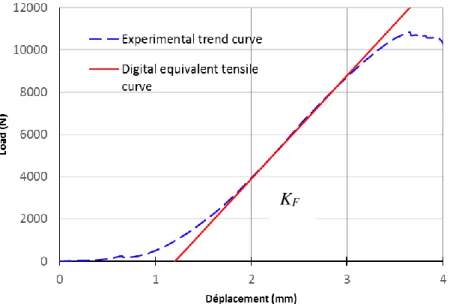
KF fabric (see Figure 4). This parameter modulus is easily found from the slope of the
experimental tensile loud displacement data of the fabric. After discretization by finite element of the sample, the local stiffness K0 is deduced according to the number of
connectors according to the length and according to the number of connectors according to the width. This stiffness can also be written according to the dimensions of the samples and the size of the element l0. The figure 6 shows the typical load–displacement
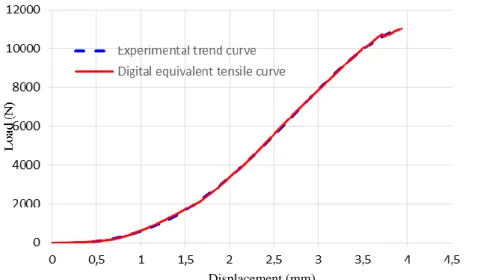
curve for the weft tensile test of 48600 C 1300 woven fabric. The tensile test, made on woven reinforcements of carbon, reveal three phases: the first Setting up of the woven, reducing the crimp phenomenon. In the second the tension of fabric until the maximum load. Finally the progressive deterioration of the specimen. The stiffness of the fabric Kf is calculated
using the mean slope in the second part. In this case, Kfabric0° = 4897 N/mm. The connector
stiffness K0 can the directly identified as per following:
1 1 0 0 l L K n N K K F F (5)
N and n: the number of connectors in direction length and the width of the specimen.
Figure 4: Comparison of uniaxial tensile warp direction (experimental, linear digital)
This approximation seems insufficient to characterise the tensile behaviour of the 48600 C1300 reinforcement: The tensile curve of this reinforcement shows a significant non-linearity at the beginning of the test. In order to account for this phenomenon, a polynomial model of connector behaviour is adopted to describe initial woven fabric behaviour Figure 5. The method of establishing the experimental trend curve and identifying the coefficients of the polynomial.
c u d u c u b u a Ft . t4 . t3 . t2 . t (7)
The nonlinear stiffness associated with the connector level is calculated from the resulting behaviour based on the equivalent model of the test specimen Fc=Kuc ; where
K=f(uc). The limits of the force and displacement of the connectors (Fc,Uc)are defined
from the following formulations:
0 0 , , 1 1 , 1 l Y n l X N F n F u N uc t c t (8)
X, Y are respectively the length and the width of the specimen. A simulate numerical tensile test in commercial software ABAQUS explicit was used. The tests are carried out on specimens of dimensions (150 × 50 mm) with an imposed displacement U = 39 mm and at a speed of 2 mm.min-1; and also the dimension of the mesh element is l =0
1mm. The number of connectors in directions Y and X are respectively given by, N = 150 and n = 50.
Figure 5: Comparison of uniaxial tensile warp direction (experimental, nonlinear digital)
2.1.2 2D shear elements
An identification of the shearing model G characterised by the Young’s modulus E and a Poisson’s ratio v as well as the thickness e, through a pure shear test (test bias) an inverse method identification.
Figure 6: Principle of inverse identification on a bias shear test
2.2 Hybrid hypo elastic discrete continuous elastic model
In this section nonlinear connectors are used. This model takes into account the non-linearity of behaviour of the fabric in tension during modelling.
446 , 3 . 75 , 19 . 13 , 123 . 573 . 85 , 170 4 3 2 t t t t t u u u u F (9)
Hypo elastic model has been proposed for 2 D element material that take into consideration large shear strain and nonlinear behaviour:
D C :
(10)
Where , D and C are the objective derivative of the 2nd Eulerian order tensor of
Cauchy stress, and the strain rate tensor and the constitutive tensor oriented alongthe fibre directions, respectively. This constitutive tensor is referenced to the fibre directions, it is necessary to update the current fibre directions throughout the analysis
Displacement (mm) Initial Parameters (E, v,e) Parameters identified Numerical simulation Experimental data Comparaison Exp/simu
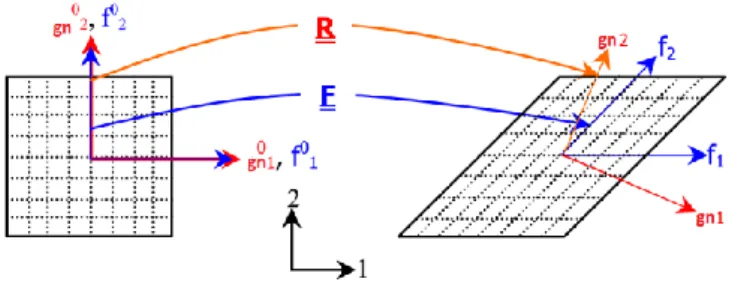
(figure 7). Once the directions of the fibres are updated, it becomes possible to transform the deformations from the Green Naghdi
i
gn base specific to the Abaqus /
Explicit calculation code. The current configuration is updated from the initial orientation axes, 0
2 0 1 , gn
gn using the rotation tensor R. 0 2 2 0 1 1 R.gn ;gn R.gn gn (11)
In the current configuration, the unit vectors in the warp and weft fibre directions 2 1, f f are respectively: 0 2 0 2 2 0 1 0 1 1 . . ; . . f F f F f f F f F f (12) Where
0
2 0 1, gn gn and
0
2 0 1, ff are assumed to coincide initially.
Figure 7. Material axes and GN axes after deformation
Two transformation matrices T1and T2 are established using to facilitate the conversion of stress and strain matrices:
2 2 2 2 2 1 1 1 1 1 cos sin sin cos ; cos sin sin cos T T (13)The first angel is 1 between
1
gn and
1
f . The second 2is the angle between 2
gn and 2
f . Next, the increments of deformations df1 and d f2are provided by Abaqus at the end of each loop, which makes it possible to calculate the deformation increments with respect to the two bases ( , )
2 2 1 f f f and ( , ) 1 1 2 F f
f using the principles of base change are defined as:
1 .
.
1;
2 .
.
2 2 2 1 1 T d T d T d T df T gn f T gn (14)Then, the in-plane shear angle is defined to be the change in the angle between the
warp and weft yarns. The constitutive law can be calcluled for each warp and weft fibre direction d , and solved for incremental stress in the fibre frames using:fi
d f1 C f1 d f1; d f2 C f2 d f2 (15) Where,
12 22 12 11 0 0 0 0 0 0 0 0 0 0 0 0 0 0 2 1 G E C and G E C f f (16)Where (E ,11 E ) and 22 G12 are the elastic tensile modulus and the in-plane shear modulus. Next, In order to calculate the new fibres stresses, at the end of the current time increment,
11 1 1 n f ,
22 1 2 n f ,
12 1 n , a midpoint integration scheme is applied where the incremental fibre stresses from equation (15) are added to the fibres stresses from the previous increment,
f1 n11
,
f2 n 22 ,
. Finally, the stresses in the two 12n directions of the fibres are calculated and then projected into the GN base by the transformation.
f T gn T f gn n gn T1 T1 T2 T2 1 . . . . 1 2 (17) The working code is Abaqus/Explicit, and the formulations developed for stress computation algorithms are written in FORTRAN code and implemented through a user material subroutine VUMAT3 Bias-extension test
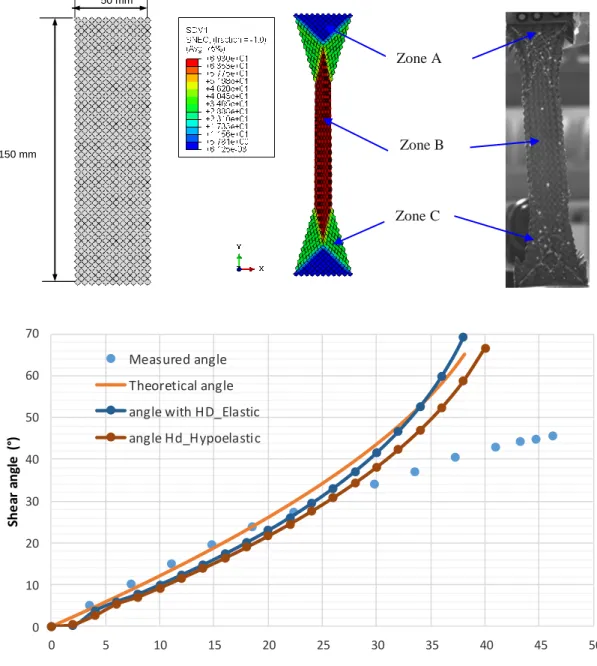
In order to validate these two approaches and to compare the results, a test bias test is used to characterise the shear mechanisms of woven reinforcement 48600 C 1300. During this test, which is often performed on a traction machine, the rectangular test specimen is cut in such a way that the locks in the two warp and weft directions are oriented at 45 ° to the direction of the tensile force.The specimen is cut with a length-to-width ratio greater than or equal to two, to reveal the three deformation zones A, B and C.Full details of this test is in [13]. For a quantitative comparison, the shear angles in the center zone were averaged and plotted versus crosshead displacement in Figure 8. The comparison of the experimental and simulation shear-displacement curves for woven fabric shows good agreement at large displacement, suggesting that the sliding is less marked for this fabric. This sliding phenomenon is particularly marked during bias-extension test but may not necessarily be as high during an actual stamping process [7].
150 mm 50 mm 0 10 20 30 40 50 60 70 0 5 10 15 20 25 30 35 40 45 50 Sh e ar a n gl e ( °) Displacement(mm) Measured angle Theoretical angle angle with HD_Elastic angle Hd_Hypoelastic
Figure 8: Comparison of the average shear angles in the Zone B for woven fabric
4 Simulation of the Hemispherical Preforming
In order to evaluate the potential of discrete hypo elastic model and discrete elastic, a hemispherical forming of 2x2 woven fabric simulation was run in Abaqus/Explicit for
Zone A
Zone C Zone B
comparison of hybrid discrete hypo elastic and hybrid discrete elastic approaches with experimental. The Hybrid elements were automatically generated using python script. Figure 9 shows an exploded view of the simulation assembly using the quarter symmetry blank (for -45°/45°). The modelling cas was created using four parts: the punch, holder, blank and die. The Total force applied on the holder is 238.45 N; and the friction coefficient between the fabric and die is set to 0.2 N. The contact conditions are general (where all bodies are prevented from penetrating other bodies according to the ‘general’ contact rules in Abaqus).
R 6 mm 50 mm 55.4 mm Punch Holder Die
Figure 9: Deep drawing simulation models : (a) tooling geometry;(b) numerical hemispherical model
Table 1: Model parameters
Hybrid discrete elastic model Hybrid discrete hypo elastic model 1D
elements
Non-linear elastic Fc = f (uc) eq. (9)
Non-linear elastic Fc = f (uc) eq. (9)
2D elements Elastique isotrope : E=3.9 V=0.3 e= 0.01mm Hypo-élastique: G=f() of 48600 C 1300 22,9438. 4 23,9304. 3 9,0399. 2 1,3447. 0,0829 12 G e= 0.62mm
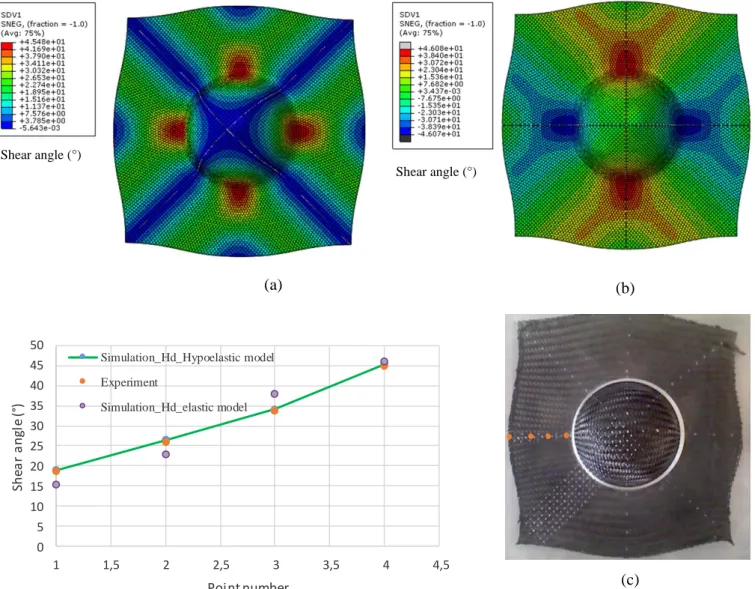
The simulation results are compared with experimental using reel thickness and nonlinear in plane shear. The shear angles are measured in 4 points and the draw-in are measured in 4 points with marker tracking method of surface woven fabric. Figure 10 shows that the hypoelastic discrete model manages the shear behavior even more realistic than the discrete elastic model.
Fig 10: Numerical Results(45°) and experimental: (a) hybrid discrete Hypoelastic model, (b) hybrid discrete elastic model,(c) experimental outputs Hemispherical stamping with 45° initial orientations
5 Conclusion
Two mesoscopic models have been developed for modeling the woven reinforcement. These models based on the combination of linear and nonlinear elastic content element (shear) with specific connectors (linear and non-linear tension rigidity).The nonlinear hypoelastic discrete able to predict the stresses at the level of the fibres and also to determine, with height precision, the shear angles based on the modification of the orientation of the wires in great deformation. A numerical modeling of fabric forming process using hemispherical punch was presented in the last section of this paper which provided close results to the experimental ones, which it shows the comparison ability 0 5 10 15 20 25 30 35 40 45 50 1 1,5 2 2,5 3 3,5 4 4,5 Sh ea r a n gl e (° ) Point number Simulation_Hd_Hypoelastic model Experiment Simulation_Hd_elastic model (a) (b) (c) Shear angle (°) Shear angle (°)
of this two approaches to describe the composite behavior and the height accuracy of shear angle prediction
Acknowledgement
The authors acknowledge this work therefore relies jointly on the skills and material resources of these entities (UMSSTT-ENSIT, Tunisia: Numerical Modelling, LGP, and ENI de Tarbes, France: Experimental Means and Numerical Modelling). This work also benefits from the support of the company Nimitech Innovation.
References
[1] Boisse, P., Hamila, N., Vidal-Sallé, E., & Dumont, F. Simulation of wrinkling during textile composite renforcement forming. Influence of tensile, in-plane shear and bending stiffnesses. J.
Composites Science and Technology. 71 (2011) 683-692.
[2] Van Der Weeën, F. Algorithms for draping fabrics on doubly‐curved surfaces. J. International journal
for numerical methods in engineering. 31 (1991) 1415-1426.
[3] Khan, M. A., Mabrouki, T., Gauthier, S., Vidal-Salle, E., & Boisse, P.Preforming simulation of the reinforcements of woven composites: continuous approach within a commercial code. J.
International Journal of Material Forming. 1 (2008) 879-882.
[4] Sidhu, R. M. J. S., Averill, R. C., Riaz, M., & Pourboghrat, F. Finite element analysis of textile composite preform stamping.J. Composite structures, 52 (2001) 483-497.
[5] Boubaker, B. B., Haussy, B., & Ganghoffer, J. F. Discrete models of fabric accounting for yarn interactions: Simulations of uniaxial and biaxial behaviour. J. Revue Européenne des Eléments 14
(2005)653-675
[6] Sharma, S. B., & Sutcliffe, M. P. F. A simplified finite element model for draping of woven material.
J. Composites Part A: Applied Science and Manufacturing.35 (2004) 637-643.
[7] Jauffrès, D., Sherwood, J. A., Morris, C. D., & Chen, J. Discrete mesoscopic modelling for the simulation of woven-fabric reinforcement forming. J. International Journal of Material Forming.
3(1205-1216).
[8] Harrison, P., Clifford, M. J., & long, A. C. Shear characterisation of viscous woven textile composites: a comparison between picture frame and bias extension experiments. J. Composites
Science and Technology 64 (2004) 1453-1465.
[9]Najjar, W., Legrand, X., et Dalsanto, P. Conference paper A novel simulation model for textile renforcement preforming. Innovative Textile for High Future Demands. 12th Word Textile
conference AUTEX, Zadar (Croatia), June 13th to 15th, 2012.
[10] Boisse, P.,Aimène,Y., Dogui, A., Dridi, S., Gatouillat, S., Hamila, N., & Vidal-Sallé, E. Hypoelastic, hyperplastic, discrete and semi-discrete approaches for textile composite reinforcement forming. J.
International journal of material forming.3 (2010) 1229-1240.
[11] Hexcel, Hexflow® 48600 C 1300, 2015.
[12] Boisse, P., Cherouat, A., Gelin, J. C., & Sabhi, H. Experimental study and finite element simulation of a glass fibre fabric shaping process. J. Polymer composites 16 (1995) 83-95.
[13] Cao, J., Akkerman, R., Boisse, P., Chen, J., Cheng, H. S., De Graaf, E. F., ... & Lee, W.
Characterization of mechanical behavior of woven fabrics: experimental methods and benchmark results. J. Composites Part A: Applied Science and Manufacturing 39 (2008) 1037-1053