Gait and Posture Original Manuscript
This is the author’s copy of this published article: https://doi.org/10.1016/j.gaitpost.2018.02.009
Unmatched speed perceptions between overground
and treadmill manual wheelchair propulsion in
long-term manual wheelchair users
Félix Chénier1,2,3, Audrey Champagne1,4, Guillaume Desroches1,4, Dany H Gagnon1,4
1. Pathokinesiology Laboratory, Centre for Interdisciplinary Research in Rehabilitation of Greater Montreal, Institut universitaire sur la réadaptation en déficience physique de Montréal, 6300 Darlington, Montreal, QC, H3S 2J4, Canada. 2. Department of Physical Activity Sciences, Université du Québec à Montréal, Biological Sciences Building, 141 President-Kennedy, Montreal, QC, H2X 1Y4, Canada. 3. Department of Automated Manufacturing Engineering, École de technologie supérieure, 1100 Notre-Dame Ouest, Montreal, QC, H3C 1K3, Canada 4. School of Rehabilitation, Université de Montréal, 7077 Park, Montreal, QC, H3N 1X7, Canada
Corresponding Author
Félix Chénier Department of physical activity science, Faculty of Sciences Université du Québec à Montréal (UQAM) SB-4455, Biological Sciences Building 141 President-Kennedy, Montreal, QC, H2X 1Y4, Canada Tel : 514-987-3000 ext. 5553 Email : felix@felixchenier.comAbstract
Background: Manual wheelchair (MWC) propulsion is increasingly assessed on a motorized treadmill (TM), which is often considered more ecologically valid than stationary rollers. However, no clear consensus on the similarities between overground (OG) and TM propulsion has yet been reached. Furthermore, no study has investigated the participants’ perceptions of propelling a MWC on a TM compared to OG. Research question: The present study aims to assess the perception of speed when propelling on a TM vs OG, and to relate this perception to measured spatiotemporal variables, kinetics and work. Methods: In this repeated-measures study, the propulsion’s spatiotemporal variables, kinetics, and work of nineteen experienced wheelchair users with a spinal cord injury were compared between three conditions: 1) OG at a self-selected speed, 2) on a TM at a self-selected speed perceived as being similar to the OG speed (TMperceived), and 3) on a TM at the same speed as OG (TMmatched). Each variable wascompared between conditions using an analysis of variance for repeated measures.
Results: All participants selected a lower speed for TMperceived
than OG, with a difference of -0.6 m/s (-44 %). This adaptation may be due to a combination of two factors: 1) the absence of speed
information, and 2) the feeling of urgency to grab the wheels during the recovery phase. The power output, work per cycle, and work per minute were also much lower on TMperceived than OG. However, in
contrast to other work on MWC propulsion on a TM, the kinetic variables assessed were all similar between the OG and TMmatched conditions.
Significance: Training on a TM should be performed at a speed that matches the OG speed and not at a self-selected speed on the TM, which would reduce the power output and work and therefore reduce the efficiency of the training. Keywords: biomechanics; rehabilitation; treadmill; wheelchairs; spinal cord injuries.
Introduction
Manual wheelchair (MWC) propulsion is frequently assessed and trained in clinical practice and research protocols. The use of stationary MWC ergometers (rollers) has been gaining in popularity during the last few decades, allowing for continuous, stationary propulsion sessions. However, since the MWC is fixed to the ergometer, the inertial effects experienced during overground (OG) propulsion cannot be reproduced. In an attempt to offer a more realistic propulsion experience, propelling a MWC on a motorized treadmill (TM) is emerging as a promising alternative [1,2]. However, only three studies have compared OG and TM propulsion to date. Based on pushrim kinetics among a group of 28 MWC users with diverse neurological impairments, Kwarciak et al. [3] found that TM propulsion is similar to OG propulsion on a low-pile carpet as long as the TM is inclined at about 0.8°. A second study by Stephens and Engsberg [4] has shown a significant difference in the hand trajectory between OG and TM for eight MWC users with tetraplegia. In the last and most recent study, Mason et al. [5] measured the oxygen uptake and pushrim kinetics in fifteen able-bodied participants. They found that TMs don't accurately reproduce OG pushrim kinetics, but that the oxygen uptake is similar if the TM is inclined at 0.7°. No clear consensus on the similarities between OG and TM propulsion has yet been reached. Furthermore, none of these studies have investigated the participants’ perceptions of propelling on a TM. In parallel, walking and running have been studied and compared extensively between OG and TM: in addition to differences of cadence, muscle activation patterns and lower-limb kinetics [6–9], it has also been reported that participants perceived they were going faster on the TM although they walked at the same speed as OG [10]. Participants preferred a lower walking speed of -38 % on the TM compared to OG [11]. Finally, when they were instructed to match their OG speed, participants tended to go slower on the TM, by 17% for walking [12] and 27% for running [13]. These differences of speed perceptionbetween OG and TM gait may also be observed for MWC propulsion. Hence, the similarity between OG and TM, often taken for granted, deserves to be investigated further.
In the present study, we compared the spatiotemporal variables, kinetics, and work between propulsion OG at a self-selected speed, on a TM at a self-selected speed perceived to be similar to the OG speed (TMperceived), and then on a TM at the same speed as OG (TMmatched). Based on the reviewed
studies on gait on a TM, we hypothesized that the TMperceived speed will be lower than the OG speed.
Methods
Participants
Nineteen individuals who had sustained a spinal cord injury at least one year prior to their participation in this study and who use a MWC independently as their primary mode of ambulation were recruited. Potential participants were excluded if they presented associated conditions (e.g., upper-limb pain) that might have altered their ability to propel a MWC. Table 1 summarizes the participants' characteristics. The participants read and signed an informed consent form before entering the study. Ethical approval was obtained from the Research Ethics Committee of the Center for Interdisciplinary Research in Rehabilitation of Greater Montreal (CRIR #715-0312). Insert Table 1 hereInstrumentation
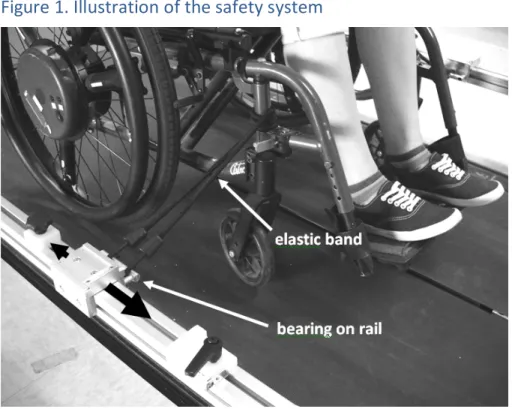
A 24-inch or a 26-inch instrumented wheel (SmartWheel, Outfront Corp.) was installed on the non-dominant side of the participants’ wheelchairs to record the tridimensional forces and moments applied on the pushrim and the angular position at a sampling frequency of 240 Hz. A matching wheel was installed on the other side. The wheel diameter was chosen to closely match the participants’ own wheels. A 0.84-meter wide and 1.84-meter long motorized TM was used for TM propulsion. The TM was equipped with a custom safety system as shown in Figure 1; elastic bands were used to secure the front of the MWC to linear low-friction bearings mounted on two lateral rails. This system, which prevents excessive lateral movements of the MWC while allowing a forward/backward excursion of 50 cm, is comparable to the one used in a previous study on MWC propulsion on a TM [3]. Insert Figure 1 herePropulsion assessments
Overground (OG)
The participants propelled their MWC in a hallway over a 20-meter-long level tiled surface at a self-selected natural speed. They were instructed to keep a constant speed until they had passed the finish line. The mean speed was calculated over three trials based on the time needed to complete the task [14].Treadmill at perceived overground speed (TM
perceived)
Before the TM assessments, the participants were given time to familiarize themselves with TM propulsion at a self-selected speed, for a maximum of five minutes followed by a rest period to avoid
fatigue. Then, the participants propelled their MWC on the TM at a speed that they perceived as similar to the speed they had in the hallway. The TM speed was initially set at 0.5 m/s and was gradually increased by 0.05 m/s increments until they confirmed their speed selection.
Treadmill at matched overground speed (TM
matched)
Thereafter, the participants propelled their MWC on the TM at an imposed speed matching their OG speed. They were informed that this speed matched their own OG speed. For both TM conditions, one trial of 30 seconds was recorded at a steady speed. Two-minute rest periods were allowed between the trials.
Data processing
The instrumented wheel data were corrected for possible sinusoidal offsets in the force channels [15]. Then, the following outcome variables were calculated.Spatiotemporal variables
• Push, recovery and cycle time in seconds, where push detection was based on a dual threshold of 5 N (push) and 2 N (recovery) on the total force 𝐹tot; • Cadence in pushes/min, calculated as 60 divided by the cycle time; • Push angle in degrees, using the angular displacement of the wheel during the push phase; • Wheelchair speed in m/s, by filtering the rear wheel’s angular position using a time-derivative second-order low-pass Butterworth filter with a cut-off frequency of 6 Hz.Pushrim kinetics: mean, peak, and time-normalized profile during the push phase
• Total force 𝐹tot applied on the pushrim in newtons, defined as the vectorial sum of the force
components;
• Propulsive moment 𝑀prop measured around the hub, in Nm;
• Power output 𝑃𝑂 in watts, calculated as 𝑀prop multiplied by the wheel’s angular speed.
Work
• The work per cycle (𝑊/cycle) in joules, calculated as the product of the mean 𝑃𝑂 and the push time; • The work per minute (𝑊/min) in joules, calculated as the product of 𝑊/cycle and cadence. Each outcome variable was calculated on the five most repeatable cycles of steady-state propulsion, then averaged over these five cycles. Steady state propulsion was defined as starting on push #4. The five most repeatable pushes were selected automatically based on the similarity of the 𝐹tot curves. Allthe data processing was performed using Matlab software (Mathworks Inc, Naticks, USA).
Statistical analysis
For every scalar variable, the mean and standard deviation were calculated for every participant, and an analysis of variance for repeated measures was performed between the three propulsion conditions with a significance level of 𝑝 < 0.05. Whenever a significant main effectwas detected, planned pairwise comparisons were conducted using paired t-tests with an adjusted significance level of 𝑝 = 0.05/3. For each statistically significant comparison, the effect size 𝑑 was estimated using:
𝑑 =meanTM− meanOG s.d.OGC2(1 − 𝑟)
where 𝑟 is the Pearson correlation coefficient between both conditions [16]. The effect size was interpreted according to the guidelines proposed by Cohen [17]: small (𝑑 < 0.2), medium (0.2 ≤ 𝑑 < 0.5), and large (𝑑 ≥ 0.8).
For the time-normalized profiles of 𝐹tot, 𝑀prop and 𝑃𝑂, the Pearson correlation coefficient (𝑟) and the
root-mean-square (RMS) difference were calculated to analyse the similarities between OG and TMperceived, and between OG and TMmatched.
Results
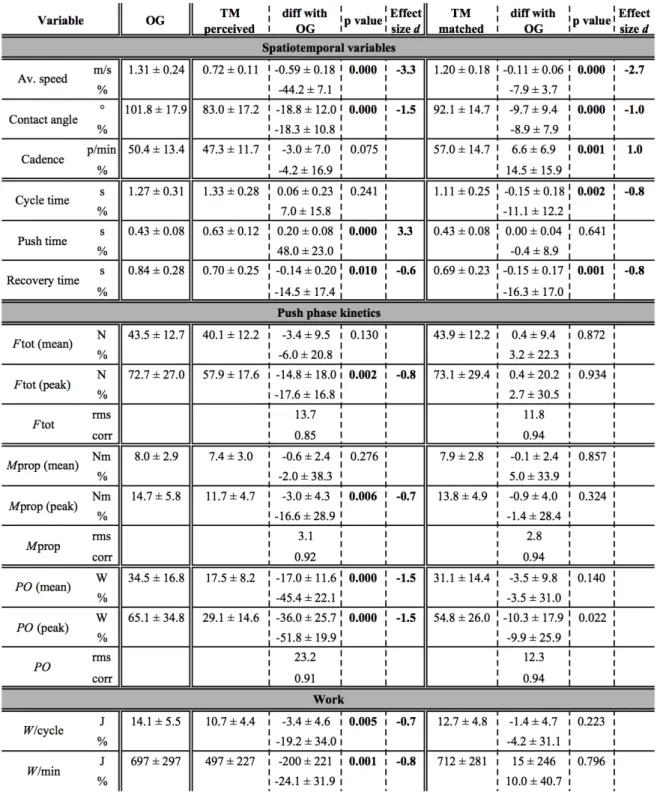
Table 2 shows the outcome variables and descriptive statistics. Although the instruction for the TMperceived conditions was to try matching their OG speed, all participants consistently selected a lower
speed, with an average absolute difference of -0.6 m/s (0.72 m/s vs 1.31 m/s) and a relative difference of -44 %. On TMmatched, although the TM speed was set to match OG, the measured speed was slightly
lower (-0.1 m/s, -8 %).
Insert Table 2 here.
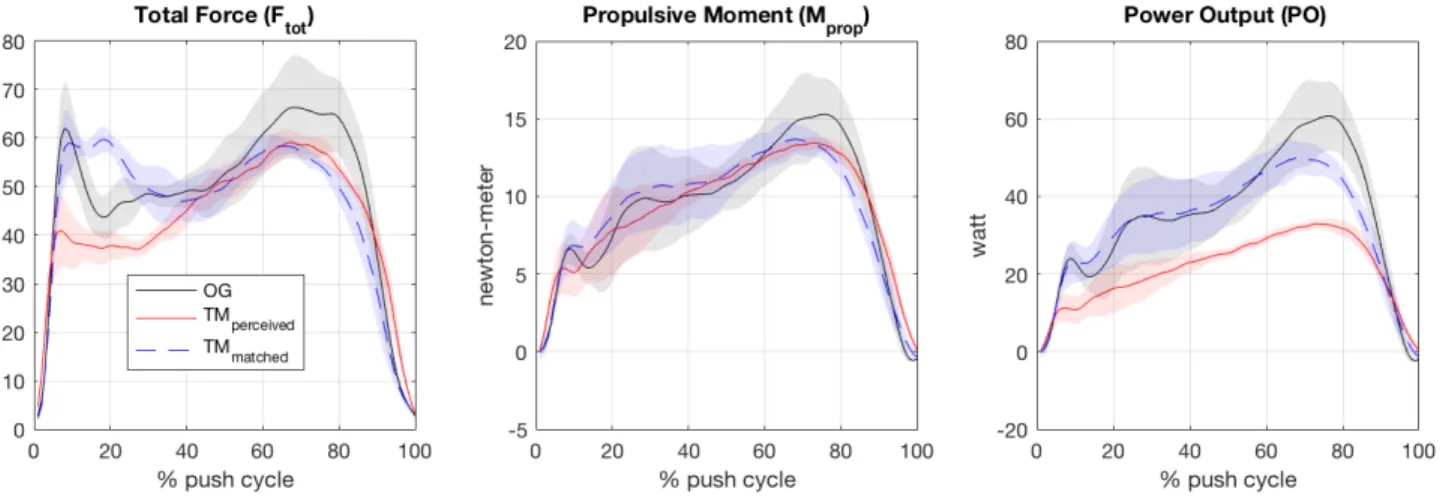
Almost all kinetic and work variables were significantly different between OG and TMperceived, while no
difference was found between OG and TMmatched. The kinetic curves (Fig. 2) were slightly more similar
between OG and TMmatched than between OG and TMperceived, which was reflected in the smaller RMS
differences and higher Pearson correlation coefficients. This was particularly true for the power output, probably because of the large speed difference between OG and TMperceived. The differences in
spatiotemporal variables were more varied, with differences both between OG and TMperceived, and
between OG and TMmatched. For every statistically significant difference, the effect size was either large
(𝑑 ≥ 0.8) or medium (0.5 ≤ 𝑑 < 0.8). Insert Figure 2 here.
Discussion
As hypothesized, the participants selected a lower speed on the TM than OG. This adaptation may not be related to kinetic factors, since all push phase kinetics were closer to OG in TMmatched than inTMperceived. It also may not be related to the required propulsion effort, since the mean and peak 𝑃𝑂,
𝑊/cycle and 𝑊/min were also closer to OG in TMmatched than in TMperceived. In a similar study on gait,
Kong et al. [13] have proposed that a discrepancy between real and perceived speed may be influenced by altered and contradictory sensory inputs from the visual, somatosensory and vestibular systems. However, this could not explain precisely why, in the present study, the participants consistently overestimated their speed on the TM. In the absence of speed information, the participants must select an alternative sensory input to estimate their speed. Cadence is a rich candidate, because it generally increases with speed [18] and stimulates the proprioceptive, haptic and auditory senses (i.e. the impact sound on the hand contact). Therefore, by attempting to reproduce their OG wheeling speed on a TM, the participants may have instead reproduced their OG cadence. This is strongly supported by this work’s data, where cadence was the only variable found to be similar between OG and TMperceived, while being slightly higher (15 %)
In gait, cadence was reported to increase on the TM compared to OG [6,12]. Alton et al. [6] have suggested that this is possibly due to a sense of urgency to bring the swinging leg forward while the support leg is pulled behind. This feeling of urgency definitively exists during the recovery phase of MWC propulsion, where the users must quickly return their hands back to the pushrims to maximize their MWC control and ensure staying on the TM platform. This reduces both the recovery time and contact angle (to reduce the required hand travel), which was effectively observed in both TM conditions.
Therefore, the lower speed on TMperceived is most likely explained by a combination of two factors:
1. The absence of speed feedback, which led the participants to match their cadence (and thus their cycle time) instead of their speed.
2. The feeling of urgency during the recovery phase, which reduced their recovery time and contact angle.
Since push time = cycle time − recovery time, both factors combined also increase the push time, which was effectively observed in TMperceived. Following this approximate relationship:
MWC speed ∝contact angle push time increasing the push time and decreasing the contact angle necessarily decreases the MWC speed. In the present study, the perceived speed difference was larger than in similar studies on gait: 44% compared to 17% (walking) and 27% (running) [12,13]. This may be explained by a greater sense of urgency on the TM due to the synchronous nature of MWC propulsion: no control of the MWC trajectory is possible during the recovery phase of MWC propulsion. In gait, which is asynchronous, such repetitive bilateral loss of contact occurs only during the aerial phase of the running cycle. A longer familiarization period could attenuate the difference of recovery time between OG and TM. In gait studies, this difference tended to vanish after at least six minutes of familiarization [19,20]. In the present study, the familiarization time was limited, but not controlled, to five minutes. Moreover, the required familiarization time may be higher than six minutes due to the complexity of steering a MWC on a TM, even when using a safety system as previously described.
The kinetic variables 𝐹tot, 𝑀prop and 𝑃𝑂 were similar between the OG and TMmatched conditions. This
contrasts with Mason et al. [5], who found with 15 able-bodied participants that unless the TM was inclined, Ftot and P.O. were significantly lower on the TM compared to OG. In the present study, the
participants were 19 MWC users who may have a greater inter-participant variability than able-bodied participants, which can limit the detection of statistical differences between the propulsion conditions. However, this higher variability was reduced by using a repeated measures analysis. We believe this disagreement to be mainly due to the different safety systems used in both studies. The present study used elastic bands and two linear low-friction bearings, which gives more freedom and less friction than the more rigid stabilizer used by Mason et al. In contrast to OG propulsion, increasing the friction alleviates the effort required to propel on a TM: this concords with Mason et al., who have observed that the participants barely had to push the wheels at a 0° incline when they shifted their weight forward. While such systems are required for the safety of the users, their impact on propulsion biomechanics is still not well understood [21].
Although in the TMmatched condition the speed was much closer to OG than it was for the TMperceived
conditon, it was still lower than OG. This is because the TMmatched speed was adjusted to the mean OG
speed as measured over the complete trial including the initial acceleration. In future studies the average OG speed should be measured during steady state only. Moreover, the selection of a fixed starting TM speed of 0.5 m/s may have affected the speed perception of the users, since the fastest users had to propel longer than the slowest users before reaching TMperceived speed. In following studies,
the starting speed may be set to a fraction of OG speed, which, from our results, should be less than 50% to ensure that the TMperceived speed is greater than the starting speed.
Clinical and research implications
Clinicians and researchers should consider that the MWC users overestimate their speed when propelling on a TM. Therefore, training on a TM instead of OG could be less efficient if the TM speed is self-selected, since 𝑃𝑂, 𝑊/cycle and 𝑊/min are all strongly reduced as the speed decreases. The TM speed should instead be progressively and rapidly matched to the MWC user’s natural speed as measured OG.
In the TMmatched conditions, only the spatiotemporal variables were different from OG. In future
research, the use of a system offering spatiotemporal feedback should be envisaged to encourage the users to increase their recovery time, which could have repercussions on every other spatiotemporal variable. For example, a metronome could indicate when to grab and release the wheels. Increasing the similarities of the spatiotemporal variables between OG and TMmatched conditions could optimize the
ecological validity of MWC propulsion on a TM.
Conclusion
The aim of this study was to investigate if, as is true for gait, MWC users overestimate their speed when propelling over a TM, which has proved to be the case. When instructed to match their self-selected OG speed on the TM, the participants selected a much lower speed of -0.6 m/s (-44%). This adaptation may be due to a combination of two factors: (1) the absence of speed information, and (2) the feeling of urgency to grab the wheels during the recovery phase. In contrast to other works on MWC propulsion on TMs, the kinetic variables were similar between OG and on a TM when the TM speed was matched to the OG speed, which could be related to the different safety systems used to secure the MWC to the TM. When a TM is used for MWC training, its speed should not be self-selected directly on the TM but instead matched to OG speed; otherwise, training on the TM could be less efficient.Acknowledgements
This project was supported by the Fonds de la recherche du Québec-Santé. The equipment and material required to complete this project were financed primarily by the Canada Foundation for Innovation. The authors wish to thank Annie-Claude Babineau for her assistance with data collection and part of the data pre-processing.Conflict of interest
There is no conflict of interest in this work.References
[1] X. Martin, N. Tordi, M.P. Bougenot, J.D. Rouillon, Critical analysis of apparatus and evaluation methods for determination of physical capacity of spinal cord injured people using wheelchair, Science and Sports. 17 (2002) 209–219. [2] Y. Vanlandewijck, D. Theisen, D. Daly, Wheelchair propulsion biomechanics: implications for wheelchair sports, Sports Medicine. 31 (2001) 339–367. doi:10.2165/00007256-200131050-00005. [3] A.M. Kwarciak, J.T. Turner, L. Guo, W.M. Richter, Comparing handrim biomechanics for treadmill and overground wheelchair propulsion, Spinal Cord. 49 (2011) 457–462.[4] C.L. Stephens, J.R. Engsberg, Comparison of overground and treadmill propulsion patterns of manual wheelchair users with tetraplegia, Disability and Rehabilitation: Assistive Technology. 5 (2010) 420–427. [5] B. Mason, J. Lenton, C. Leicht, V. Goosey-Tolfrey, A physiological and biomechanical comparison of over-ground, treadmill and ergometer wheelchair propulsion, Journal of Sports Sciences. 32 (2013) 1–14. doi:10.1080/02640414.2013.807350. [6] F. Alton, L. Baldey, S. Caplan, M.C. Morrissey, A kinematic comparison of overground and treadmill walking, Clin Biomech. 13 (1998) 434–440. doi:10.1016/S0268-0033(98)00012-6. [7] S.J. Lee, J. Hidler, Biomechanics of overground vs. treadmill walking in healthy individuals, Journal of Applied Physiology. 104 (2008) 747–755. doi:10.1152/japplphysiol.01380.2006. [8] M. Murray, G. Spurr, S. Sepic, G. Gardner, L. Mollinger, Treadmill vs. floor walking: Kinematics, electromyogram, and heart rate, Journal of Applied Physiology. 59 (1985) 87–91. [9] G.M. Strathy, E.Y. Chao, R.K. Laughman, Changes in knee function associated with treadmill ambulation, Journal of Biomechanics. 16 (1983) 517–522. doi:http://dx.doi.org/10.1016/0021-9290(83)90066-0. [10] S.C. White, H.J. Yack, C.A. Tucker, H.-Y. Lin, Comparison of vertical ground reaction forces during overground and treadmill walking, Medicine and Science in Sports and Exercise. 30 (1998) 1537– 1542. [11] A.P. Marsh, J.A. Katula, C.F. Pacchia, L.C. Johnson, K.L. Koury, W.J. Rejeski, Effect of Treadmill and Overground Walking on Function and Attitudes in Older Adults, Medicine & Science in Sports & Exercise. 38 (2006) 1157–1164. doi:10.1249/01.mss.0000222844.81638.35. [12] U. Dal, T. Erdogan, B. Resitoglu, H. Beydagi, Determination of preferred walking speed on treadmill may lead to high oxygen cost on treadmill walking, Gait & Posture. 31 (2010) 366–369. doi:10.1016/j.gaitpost.2010.01.006. [13] P.W. Kong, T.M.C. Koh, W.C.R. Tan, Y.S. Wang, Unmatched perception of speed when running overground and on a treadmill, Gait & Posture. 36 (2012) 46–48. [14] D.H. Gagnon, A. Roy, M.C. Verrier, C. Duclos, B.C. Craven, S. Nadeau, Do Performance-Based Wheelchair Propulsion Tests Detect Changes Among Manual Wheelchair Users With Spinal Cord Injury During Inpatient Rehabilitation in Quebec?, Archives of Physical Medicine and Rehabilitation. 97 (2016) 1214–1218. doi:10.1016/j.apmr.2016.02.018. [15] F. Chénier, R. Aissaoui, C. Gauthier, D.H. Gagnon, Wheelchair pushrim kinetics measurement: A method to cancel inaccuracies due to pushrim weight and wheel camber, Medical Engineering and Physics. 40 (2017) 75--86. doi:10.1016/j.medengphy.2016.12.002. [16] S.B. Morris, R.P. DeShon, Combining effect size estimates in meta-analysis with repeated measures and independent-groups designs., Psychological Methods. 7 (2002) 105–125. doi:10.1037//1082-989X.7.1.105. [17] J. Cohen, Statistical Power Analysis for the Behavioral Sciences, L. Erlbaum Associates, 1988. [18] J.S. Slowik, P.S. Requejo, S.J. Mulroy, R.R. Neptune, The influence of speed and grade on wheelchair propulsion hand pattern, Clin Biomech (Bristol, Avon). 30 (2015) 927–932. doi:10.1016/j.clinbiomech.2015.07.007. [19] V. Lavcanska, N.F. Taylor, A.G. Schache, Familiarization to treadmill running in young unimpaired adults, Human Movement Science. 24 (2005) 544–557. doi:10.1016/j.humov.2005.08.001. [20] A. Matsas, N. Taylor, H. McBurney, Knee joint kinematics from familiarised treadmill walking can be generalised to overground walking in young unimpaired subjects, Gait & Posture. 11 (2000) 46–53. [21] F. Chénier, C. Gauthier, D. Gagnon, Effects of a wheelchair stabilization and safety system on spatiotemporal and kinetic parameters during motorized treadmill propulsion, in: 4th Joint Annual Scientific Meeting of ISCoS and ASIA, 2015. [22] F.M. Maynard, M.B. Bracken, G. Creasey, J.F. Ditunno, W.H. Donovan, T.B. Ducker, S.L. Garber, R.J. Marino, S.L. Stover, C.H. Tator, International standards for neurological and functional classification of spinal cord injury, Spinal Cord. 35 (1997) 266–274.
[23] K.A. Curtis, K.E. Roach, E. Brooks Applegate, T. Amar, C.S. Benbow, T.D. Genecco, J. Gualano, Development of the Wheelchair User’s Shoulder Pain Index (WUSPI), Paraplegia. 33 (1995) 290– 293. doi:10.1038/sc.1995.65.
Tables
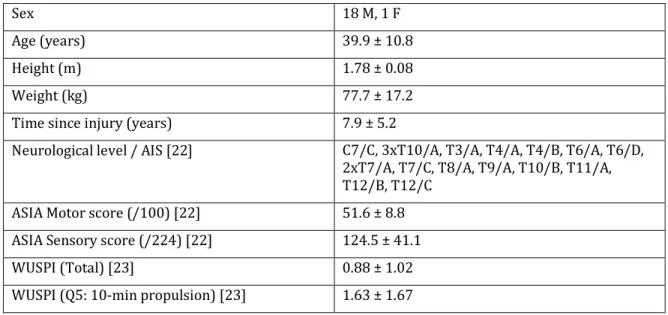
Table 1. Participants’ characteristics
Sex 18 M, 1 F Age (years) 39.9 ± 10.8 Height (m) 1.78 ± 0.08 Weight (kg) 77.7 ± 17.2 Time since injury (years) 7.9 ± 5.2 Neurological level / AIS [22] C7/C, 3xT10/A, T3/A, T4/A, T4/B, T6/A, T6/D, 2xT7/A, T7/C, T8/A, T9/A, T10/B, T11/A, T12/B, T12/C ASIA Motor score (/100) [22] 51.6 ± 8.8 ASIA Sensory score (/224) [22] 124.5 ± 41.1 WUSPI (Total) [23] 0.88 ± 1.02 WUSPI (Q5: 10-min propulsion) [23] 1.63 ± 1.67
Table 2. Outcome measures for the three propulsion conditions and planned
comparisons
Bold values indicate significant difference between conditions
Figures
Figure 1. Illustration of the safety system
Figure 2. Time-normalized profiles of the total force, propulsive moment and
power input for a typical participant