Université de Montréal
Changes in Frame of Reference After Exposure to Emotional Stimuli
par Eva Best
Mémoire
présentée en vue de l'obtention de la maîtrise (M.Sc) en psychologie
juillet, 2018
Table of Contents
French Abstract……….6
English Abstract……….7
Problem Position………8
Theoretical Context………...8
The Positivity Effect………...………9
Mather’s Positivity Effect Theory..……….……….12
Issues With Mather’s Theory………12
An Alternative Explanation of The PE………...………….……….14
The Current Study………17
Objectives………..18 Hypotheses………19 Method………..19 Participants………19 Materials………20 Procedure………...22 Design………25 Data Analysis……….25 Within-Subjects Component…………..………26 Between-Subjects Component……...………26 Correlations………27 Results……….…...………...27 Between-Groups Component……….………27
Participant Characteristics………27 Attention……….29 Mood………...30 Correlations………...31 ANOVA………...33 Discussion……….36
Priming and The PE………..38
Acknowledgements……….………44
List of Table Table 1………...28 Table 2………...30 Table 3………...31 Table 4………...31 Table 5………...33 Table 6………...33 Table 7………...36
List of Figures Figure 1………..…………11 Figure 2………..24 Figure 3.………...24 Figure 4.………...34 Figure 5.………...35
Résumé
L'hypothèse de la présente étude était que le développement émotionnel culmine chez les personnes âgées. Ceci s'expliquerait par un changement perceptif de l'importance des stimuli négatifs au cours des décennies de la vie. L'effet de positivité ou le biais de positivité (EP) serait alors le résultat de la désensibilisation aux stimuli négatifs
chroniques liés à l'expérience de la vie. Cette recherche présente une preuve de concept en induisant l'EP chez les jeunes adultes par l'exposition à des types spécifiques de stimuli émotionnels. Plus précisément, 39 participants ont été assignés au hasard à deux groupes: le premier groupe fût exposé à des visages tristes seulement et le second à des visages neutres seulement. Les participants ont complété une évaluation de référence et trois évaluations de comparaison où ils ont dû qualifier les expressions faciales sur une échelle dimensionnelle. Entre ces évaluations, ils ont été exposés aux stimuli spécifiques à leur groupe tout en accomplissant une tâche de mémoire de travail pour maintenir leur attention. Le temps requis pour désensibiliser les jeunes adultes normaux a été estimé à l'aide d'un plan d'expérience en blocs puisqu'il s'agissait d'une étude exploratoire. Les symptômes dépressifs et l'anxiété ont été mesurés avant la procédure expérimentale. L'humeur et l'excitation ont été mesurées avant et après la procédure expérimentale. Tout comme les personnes âgées qui expriment l'EP, les participants jeunes adultes ont qualifié les stimuli négatifs de moins négatifs, et les stimuli neutres comme plus positifs au fil du temps.
Mots-clés : Effet de positivité; biais de positivité; développement humain;
développement émotionnel; priming; jeunes adultes; vieillissement; émotion; personnes âgées; cadre de référence.
Abstract
The goal of the current study was to demonstrate the possibility that elderly people represent the climax of emotional development through a perceptual shift in the
importance of negative stimuli over decades of life. The proposed hypothesis was that the positivity effect or positivity bias (PE) is the result of desensitization to chronic negative stimuli through life experience. This was done as a proof of principle by inducing the PE in young adults after exposure to a specific type of emotional stimuli. Specifically, 39 participants were randomly assigned to two groups, one where they were only exposed to sad faces and the other only to neutral faces. Participants completed baseline and
comparison ratings of their group’s emotional stimuli, and were equally exposed while completing a working memory task to maintain their attention. As this was an explorative study, a blocked design was used to capture the time required to desensitize in normal young adults. We controlled for depressive symptoms, anxiety, and controlled for mood and arousal pre and post the experimental procedure. Just like elderly adults in the PE, the young adult participants rated negative stimuli as less negative, and neutral stimuli as more positive over time. This suggests that the PE represents a climax of normal
emotional development where humans slowly desensitize to negative stimuli over time. Keywords: Positivity Effect; Positivity Bias; Frame of Reference; Emotional Development; Human Development; Priming; Elderly; Aging; Young Adults; Emotion.
Changes in Frame of Reference After Exposure to Emotional Stimuli Problem Position
Current perspectives on the positivity effect or bias (PE), where older adults see positive stimuli as more positive and negative stimuli as less negative, suggest that it is driven by emotional regulation, a higher order cognitive process, and thus may not consider age-related abilities, experience and deficiencies specific to elderly adults. In fact, considering their vast experience in emotional perception, elderly adults with the PE may represent the climax of adaptation in emotional development. What if young adults were considered as part of the emotional development continuum that leads up to what may be the true peak of emotional adaptation, the PE? Is it possible that young adults’ responses to emotional stimuli could change towards the positive direction after exposure to negative stimuli, thus demonstrating that the PE could be a natural mechanism of emotional development to the environment? Although this hypothesis is difficult to test empirically without a longitudinal study paradigm, it is possible to try by testing the hypothesis in a shorter time-scale in young individuals using a perceptual task, as a proof of principle that humans develop emotionally through a mechanism of emotion
perception as opposed to emotion regulation. It is proposed that exposure to negative emotional stimuli throughout life changes the way people perceive emotions.
Theoretical Context
In this section, the theoretical context that is most accepted will be presented in terms of behavioural response results found, their implications for that theory of the PE, and the available evidence for this theory, including cognitive and neurological findings. Afterward, certain limitations to this theory will be presented in order to support the
current study objectives and hypotheses. Methodological considerations, the current study, its objective and its hypotheses will be presented afterward. However, before getting into these subjects, the positivity effect (PE) will be presented in more detail.
The Positivity Effect. Older people tend to pay less attention to negative stimuli, and more attention to positive stimuli, compared to younger adults (Mather & Carstensen, 2005). Older people also rate emotional stimuli differently; that is, they rate positive stimuli as more positive and negative stimuli as less negative compared to young adults (Ritchey, Bessette-Symons, Hayes, & Cabeza, 2011). This pattern of responding is known as the positivity effect (PE). If this pattern were put into terms of an emotion spectrum where one side is very negative and the other is very positive, the range of responses shifts over to the positive side of the spectrum in elderly adults. Thus far, the PE has been tested and demonstrated through recall and recognition memory research paradigms. For example, Mather and Carstensen (2005) compared younger and older adults in their capacity to remember positive (happy faces) or negative (sad faces) stimuli. In line with the PE that comes with age, elderly adults remembered negative stimuli less than young adults. This was interpreted as a deficit by the authors. However, their results also demonstrated that the elderly adults scored better than the young adults on memory for positive stimuli. Thus, it could be argued that, because the older adults scored better for positive stimuli, the PE is not necessarily a deficit as much as a change in focus from the negative for young people to the positive in the elderly for memory-related tasks.
The PE has also been demonstrated in elderly adults by combining behavioural and neurobiological measures. Emotional processing, which includes all constituents of
emotion, whether behavioural, cognitive or emotional, is relatively unaffected by aging. That is, emotional experiences activate the same brain areas in elderly adults as they do in young adults, and elderly adults respond similarly to young adults in most situations that involve emotion (Dolcos, Katsumi, & Dixon, 2014). However, the PE demonstrates that there are certain differences, especially in terms of emotion perception, a term that is defined in more detail in Figure 1. Indeed, older adults’ patterns of brain activation differ from young adults in that they have different levels of activation in certain areas in response to specific types of stimuli. In response to negative stimuli, older adults show decreased activation in the amygdala, a brain area involved in emotion and emotional memories. However, in response to neutral and positive stimuli, elderly adults’ amygdala activation pattern does not significantly differ from young adults (Ritchey et al., 2011). This result falls into a current theory that will be presented in more detail later. The current theory essentially demonstrates that the similarities in activation for positive and neutral stimuli in young and older adults is indicative that their different patterns of responding are more related to how negative emotional stimuli is processed. Considering that elderly adults pay less attention to negative stimuli (Mather & Carstensen, 2005), it would make sense that older adults’ amygdala activates less in response to negative stimuli. In other words, this different pattern of activation for negative stimuli may not be indicative of a true difference in emotion perception at the neural level (Ritchey et al., 2011). Now that the main behavioural and neurobiological evidence for the existence of the PE has been summarized, it would be useful to explore the theory behind this phenomenon, especially in terms of emotion perception.
Figure 1. Emotion processing. “The main processes important for emotion perception: 1) Appraisal and identification of the emotional significance of the stimulus; 2) Production of a specific affective state and behavior in response to the stimulus; and 3) Regulation of the affective state and emotional behavior, which may involve an inhibition or modulation of processes 1 and 2, indicated by the negative and positive signs in the circles, so that the affective state, emotional experience, and behaviors generated are contextually appropriate.” (Philips, Drevets, Rauch, & Lane, 2003). Although this only represents one of several models, this model was chosen because it clearly differentiated between the judgment and regulation phase in emotion perception. Emotion perception is a 3-step process. In the appraisal step, the stimulus is perceived and automatically appraised. This simultaneous perception and appraisal then causes the internal experience of an affective state, which is the second step of the process. Finally, regulation occurs to ensure that the perceiver reacts in a socially appropriate way. The regulatory stage can affect the appraisal of the stimulus or the affective state that occurs as a result of the perceived stimulus (Philips, Drevets, Rauch, &
the role of emotion processing in the PE. Retrieved from Philips, Drevets, Rauch, & Lane (2003).
Mather’s Positivity Effect Theory. The most accepted theory (Armony & Vuilleumier, 2013) on the emotion processing basis of the PE is from Mather (2006), who postulated that the PE occurs in the last step of the emotion processing loop: Emotion regulation. Mather (2006) proposed that the PE in the elderly is caused by a desire to make the most of the time they have left of life by regulating their emotions when confronted with emotional stimuli. Older adults thus focus on the positive and dismiss the negative. This proposition is supported by Mather and Carstensen’s (2005) attention findings, where they compared young adults to older adults in their attention to negative and positive stimuli. They found that older adults pay less attention to negative stimuli than young adults. Mather’s (2006) theory is also supported by the findings described earlier that older adults exhibit reduced amygdala activation to negative stimuli, compared to young adults (Ritchey et al., 2011). However, considering that elderly adults pay less attention to negative stimuli (Mather & Carstensen, 2005), it would make sense that older adults’ amygdala activates less to negative stimuli. In other words, this different pattern of activation for negative stimuli may not be indicative of a true difference in emotion perception at the neural level (Ritchey et al., 2011). There are several other issues with this theory, based on neurobiological and cognitive changes in relation to aging, which will be discussed next.
Issues with Mather’s theory. In general, Mather’s theory does not account for age-related deficits in the medial prefrontal cortex (mPFC) and anterior cingulate cortex (ACC). There are marked differences between young and old adults in the mPFC and
ACC, which are part of the emotion-processing loop, which is the flow of information from one area to the next in the brain during emotion processing, but these brain areas also participate in cognitive processes (Etkin, Egner, & Kalisch, 2011). fMRI data shows that the elderly exhibit increased activation in the mPFC and the ACC (Gunning-Dixon et al., 2003), which are part of the emotion perception part of the emotion-processing loop, when exposed to negative emotional stimuli. Self-reflection, which is a significant part of the first step of emotion processing (judgment and appraisal), is associated with the mPFC and the ACC. Self-reflection is more specifically a comparison of the self’s multimodal experience of the emotion perceived (Northoff & Bermpohl, 2004). In perception, the ACC and mPFC would be involved in comparing one’s own experiences of the specific emotion perceived on someone else’s face (e.g., extremely sad, very sad, somewhat sad, etc.) with the actual expression on the person’s face. The process of self-reflection associated to the ACC and mPFC are part of a perceptual task, which is a lower order cognitive process than emotional regulation. These brain areas are important in self-reflection, which contributes to the first stage of emotion perception by comparing the self’s previous experiences with current experiences. However, they are most important for successful emotion regulation and the regulation of autonomic responses (Phillips, Drevets, Raunch & Lane, 2003). The mPFC also shows the largest amount of age-related atrophy (Raz et al., 2004), whereas the ACC has less cerebral-spinal fluid and blood-flow with age (Mann et al., 2011), which demonstrates that these areas are severely affected by aging. As such, the increased activation may in fact be compensatory to structural and functional deficits in the mPFC and the ACC (Dennis & Cabeza, 2008). Above all, the age-related neurological deficits decrease the probability that the PE is
caused by emotional regulation, because emotional regulation is a higher-order process that requires more resources and energy in the brain than judgment and appraisal (self-reflection). A critical review by Phillips and colleagues (2003) demonstrated the strong implication of the mPFC and the ACC in emotion regulation (Northoff & Bermpohl, 2004). Considering older adults’ cognitive and neurological deficits, and the fact that it is a higher order task to emotionally regulate, emotional regulation seems a less likely explanation for the PE than the less cognitively demanding perceptual task of self-reflection in judgment and appraisal during emotion perception (Zalazo, 2000). Taken together, the neurological evidence presented opens the possibility that the PE be not based on emotion regulation, but rather the intrinsic comparison to emotional experiences that shape our internal reference of comparison to new emotional experiences.
An alternative explanation of The PE. What if the PE occurs because of the time that has passed as opposed to the time the elderly have left? The basic tenant of the PE is that something changes in the way humans process emotional stimuli when they are older. If one bases their idea on this in an effort to explain the mechanisms behind the PE, keeping in mind the aforementioned particularities of older adults, it is possible that the main contributing factor is the passing of time where older adults live more experiences. They tend to have seen more positive or negative stimuli than young people, simply because they have been alive longer. Time also increases the probability that they have lived more high-valence experiences. However, based on the differential activation patterns in the amygdala in elderly adults, as presented previously, the PE seems based on a change in response to negative stimuli.
Negative stimuli are more salient to young adults than they are to older adults and young adults are most aroused by negative emotional stimuli (Denburg et al, 2003). Indeed, DeCoster and Claypool (2004) conducted a meta-analysis of priming – a
perceptual process where individuals are biased by recent exposure to a previous stimulus when they make judgments – and found that negative stimuli showed the greatest priming effects in young adults. The idea that negative stimuli are more salient and arousing is supported by a comparison between children and young adults as well. Children tend to be better at recognizing and recalling negative rather than positive stimuli compared to young adults (Forgas, Burnham, & Trimboli, 1988). They also have a more negative self-concept that becomes more positive as they age (Marsh, 1986). Taken together, the PE seems to be a gradual process that begins in childhood and continues to develop
throughout the lifetime, such that younger people are more affected by negative stimuli. As they age, and their self-reflection basis becomes more negative as a result of their focus on negative stimuli, they begin to rate emotional stimuli as more positive. In other words, people become gradually more desensitized to negative stimuli and
hypersensitized to positive stimuli.
This proposed hypothesis is supported by various findings in addition to those already presented. Specifically, emotional functioning is maintained at normal levels in the elderly (Dolcos et al., 2014). This suggests that the mechanism behind the PE is associated to normal development. Further, the elderly show less activation in the amygdala in response to negative stimuli, but similar brain activation to that of young adults in response to neutral and positive stimuli (Ritchey et al., 2011). This suggests that the PE is associated to a change that is specific to the perception of negative stimuli, as
opposed to a constant mechanism of emotional regulation. As well, negative stimuli have been shown to be less arousing for the elderly through electro dermal and cardiac rhythm monitoring compared to young adults. This supports the idea that they have become desensitized to negative stimuli. This represents a new basis for the interpretation of emotion perception changes in the elderly, in particular the PE. This study’s objective was to test this alternative hypothesis for the mechanisms behind the PE.
Methodological Considerations. In the context of this study, certain
methodological considerations must be regarded. Certain traits have been found to interact with emotional judgments like those Mather and Cartensen (2005) used in their research to support Mather’s theory. Phillips and colleagues (2003) conducted a critical review to identify the neural bases of the interacting factors that have been found to be important in emotion perception research. It was already demonstrated and generally accepted that physiological arousal, subjective experience and appraisal occur in emotion perception (Plutchnik, 1984; Phillips et al., 2003). Brain imaging studies have
demonstrated the relevance of psychological pathologies in emotion perception, including phobias, post-traumatic stress disorder (PTSD), and major depressive disorder (Charney & Drevets, 2002). However, these disorders had more of an effect if the emotion they perceive is relevant to their affliction. In other words, people with phobias or PTSD would differ more from healthy participants when perceiving fearful emotions or stimuli that relate to the participant’s specific fears (Andrade, Kavanagh, and Baddeley, 1997), whereas people with depressive symptoms would be more affected by sad stimuli (Kohler, Hoffman, Eastman, Healey, & Moberg, 2011). Anxiety and attention are strong contributors to emotional processing, and are particularly affected by amygdala lesions
(Kapp et al., 1994). Anxiety disorders tend to affect attention to tasks and controlled emotion processing (such as in emotion appraisal tasks; Cosgrove & Rauch, 1995), so it seems that both state and trait anxiety can impact results in an emotion appraisal task (Phillips et al., 2003). There are many studies that demonstrate how mood can affect each of the aforementioned factors directly and indirectly through mood’s strong effect on arousal, so it seems pertinent to evaluate mood before and after exposure to an emotion to control for the probability that the participant was physiologically aroused by the
emotional stimuli (Phillips et al, 2003). Therefore, attention, depressive symptoms, mood, arousal, and state and trait anxiety should be controlled for in an emotion perception task. As the goal of this study was to explore the PE as a natural process in healthy individuals, people with diagnosed psychopathologies were excluded.
The Current Study. The proposed hypothesis is that the PE is the result of desensitization to chronic negative stimuli due to life experience, which would explain the behaviour in the PE. Previous studies have focused on young versus old people’s memory abilities in a variety of contexts, but not emotional regulation specifically. Yet, they made assumptions about emotional regulation. In other words, these were
correlational, not causational, experimental designs (Reed et al., 2014).
As well, the change in frame of reference (a window that represents the average of past environmental information that is used to compare to new environmental
information (Frijda, 1988)) could better explain normal emotional development throughout the lifespan (Reed et al., 2014). To our knowledge, this study is the first to assess the changes in response to neutral and negative stimuli in normal populations, which would clarify normal emotional development with a novel, experimental testing
design, which will be further explained later. We sought to determine whether young adults show a PE after exposure to emotionally negative stimuli. This would be a proof of principle to demonstrate the existence of a natural mechanism for chronic emotional adaptation that leads to the PE. The experimental manipulation, or independent variable, was the exposure to negative or neutral emotional stimuli over time. The dependent variable was their ratings of emotional stimuli before, during and after exposure, where exposure lasts much longer than in priming studies.
Objectives
The first objective was to assess if young adults can become desensitized to an emotion (sadness). Sadness was used in this study because it was used in prior PE studies that are central to the proposed hypothesis (Mather & Cartensen, 2005; Isaacowitz, Wadlinger, Goren & Wilson, 2006). Because this has never been done before to our knowledge, we had to operationalize desensitization in normal populations, which was the second objective of the study. This was achieved by comparing responses over time to emotional stimuli (sadness) in one group, and neutral stimuli in a second group. If there was a change in emotion rating results over time, this would have shown that young adults can be desensitized to emotional stimuli. The neutral group served as a control to rule out nonspecific effects of time, repeated stimulus presentations, task, overall habituation, etc. Most importantly, if responses similar to the PE were demonstrated in healthy young adults, this study would have added to the knowledge of how the emotion system evolves throughout the lifespan, using a new perspective. Attention, depressive symptoms, mood, arousal, and state and trait anxiety were controlled for. This was to
ensure that the results found are not due to depression symptoms, anxiety, mood, arousal or a lack of attention to the task. This was the third and final objective of the study. Hypotheses
It was expected that young adults would rate sad faces less negatively after exposure to negative emotional stimuli (desensitization). It was expected that young adults would not significantly differ in their responses after exposure to neutral emotional stimuli (control group).
METHOD Participants
Forty-eight healthy young adults between 18 and 30 years of age were recruited to participate in the study from a list of participants who already participated in studies at the Brain Research Laboratory, Music and Sound Research (BRAMS), by email and from notices posted on bulletin boards of the University of Montreal, as well as the McGill Classifieds website. The final sample size consisted of 18 participants who were exposed to sad stimuli (sad group) and 21 were exposed to neutral stimuli (neutral group).
Participants were randomly assigned to groups. All participants had signed the consent form. This study was approved by the ethics committee of the University of Montreal. Brain imaging studies have demonstrated the relevance of psychological pathologies in emotion perception, including phobias, post-traumatic stress disorder (PTSD), and major depressive disorder (Charney & Drevets, 2002). However, these disorders had more of an effect if the emotion they perceive is relevant to their affliction. In other words, people with depressive symptoms would have been affected by sad stimuli (Kohler, Hoffman, Eastman, Healey, & Moberg, 2011), which could have skewed the results of our study.
Although the results from depressive participants would have been interesting, this study attempted to provide a proof of principle that younger adults could experience a version of the PE with experience (in this case, exposure) based on the PE that has only been demonstrated in healthy older adults. Taken together, depressive young adults had to be excluded from the study. Similarly, anxiety has been shown to affect attention to emotion appraisal tasks (Cosgrove & Rauch, 1995), so it seems that both state and trait anxiety can impact results in an emotion appraisal task (Phillips et al., 2003). There are many studies that demonstrate how mood can affect each of the aforementioned factors directly and indirectly through mood’s strong effect on arousal, so it seems pertinent to evaluate mood before and after exposure to an emotion to control for the probability that the participant was physiologically aroused by the emotional stimuli (Phillips et al, 2003). Therefore, attention, depressive symptoms, mood, arousal, and state and trait anxiety should be controlled for in an emotion perception task by taking their scores into consideration in the analyses. As the goal of this study was to explore PE as a natural process in healthy individuals, people with diagnosed psychopathologies or particularly high scores in the STAI-Y1, STAI-Y2 or the BDI-II were excluded. The specific cut-off scores are below.
Materials
Sad and neutral faces from the Karolinska Directed Emotional Faces (KDEF; Lundqvist, Flykt, & Öhman, 1998) was used in this study. This inventory is composed of 70 stimuli for each emotion (35 female, 35 male). They are amateur actors’ faces,
converted to grayscale, with the background and hair blacked out. These stimuli were used because they have been previously validated and employed in several studies (e.g.,
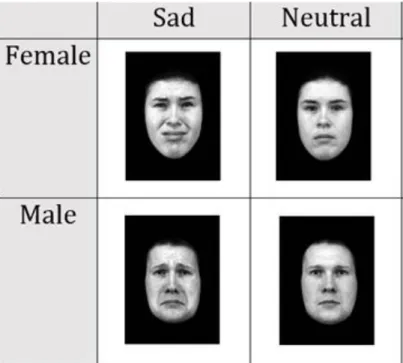
Sergerie, Lepage & Armony, 2006). The sad group only saw sad faces, and the neutral group only saw neutral faces because it was unclear whether the exposure effect of desensitization would be diminished or eliminated if the participant is exposed to other emotions during the tests. Examples of the faces are presented in figure 3.
Scales. The Beck Depression Inventory II (BDI-II) has been used to measure depressive symptoms (Beck, Steer & Brown, 1996). It has a high coefficient alpha, (.80) its
construct validity has been established, and it is able to differentiate depressed from non-depressed patients (Beck, Steer & Brown, 1996). It is a 21 question, multiple-choice questionnaire where responses range from 0 to 3. Twenty points or more indicate that the participant has at least moderate depressive symptoms. Thus, as in previous studies, this was used as the cut-off result to the BDI-II. The STAI Y1 and Y2 were used in order to evaluate state and trait anxiety. There is a total of 40 questions including both parts (Y1 and Y2). The responses range from “Not at all” to “Very much so” in a four point Likert-scale. A score of 64 or more indicates the presence of moderate anxiety. Thus, as in previous studies, this score was used as the cut-off result to the STAI Y1 and Y2. The STAI was used on approximately 10 000 people to verify its validity (α = .73 to .85) and reliability (α = .86 or higher) when it was published, and both of those values are very high (Spielberger & Reheiser, 2004). Both the BDI-II and the STAI were used because of their excellent validity and reliability values.
The Brief Mood Introspection Scale (BMIS) is a 17-item questionnaire that evaluates the participant’s current mood as well as arousal, and is very short to administer, which is why it was selected in this study. The first 16 items are a 4-point Likert scale ranging from “definitely do not feel” to definitely feel”. The 17th item asks
the participant to rate their current mood from “Very unpleasant”, which is coded as “-10”, to “Very pleasant”, which is coded as “10”. The responses for this item range from “-10” to “10” and include a “0”. The BMIS was chosen because it is particularly brief for the participant but highly informative. Most importantly, it has a measure of arousal. Procedure
The procedure is illustrated in Figure 2. Participants had completed general information questionnaire in order to characterise our groups (e.g., sex, age, etc.) and to evaluate the presence of exclusion criteria: uncorrected visual deficiencies, previously diagnosed psychopathologies or neurological traumas and consumption of psychoactive medication. This was important because the medication could have interfered with emotional processing. Qualifying applicants were invited by email to come to the
laboratory in order to participate. Depressive symptoms, state and trait anxiety, mood and arousal were controlled for using the Beck Depression Inventory (BDI-II; Beck, Steer & Brown, 1996), the State-Trait Anxiety Inventory-Y version (STAI; Spielberger, 1983), and the Brief Mood Introspection Scale (BMIS; Mayer, 1989) because it also measures arousal.
The BDI-II, the STAI-Y1 and the STAI-Y2 were scored while the participant was in the sound-proof room completing the exposure and test phases. This was done at that time because, if a high score was attained, the participant was told at the end of the session that their scores on the BDI-II or the STAI Y1 and Y2 indicated that it might be pertinent for them to be evaluated for depression or anxiety. The participant was given phone numbers to call to be evaluated and receive support. The BMIS was also
administered before the participant began the visual emotion perception ratings task. A visual representation of the procedure, from beginning to end, is presented in figure 2. For the experiment, the participant was seated in a soundproof room in front of a computer and a mouse. They completed two Full Tests, containing 20 faces in different orders, as well as two Mini-Tests, containing 10 different faces. In these tests, the participant received written instructions on the screen to rate the emotion on the face by clicking on a line ranging from “very negative” to “very positive”. A “0” was located in the middle of the line to indicate neutrality. The test phases would prompt the participant to rate the expression on the face presented on the dimensional line. Time of response was unlimited as the next face would only appear once the dimensional scale had been clicked. There were also three exposure tasks, which comprised of 30 of the same faces, in different orders. Three of the faces were repeated as part of the 1-Back task, where participants were asked to identify if the face presented following the exact same face. The time limit to respond was 2 seconds, as all faces were exposed for 2 seconds. A fixation point was also presented between each face for half a second. The order of the 30 faces and which faces are repeated were randomized for each of the tasks. Taken
together, the participant came in once they had been selected for the study, read and signed the consent form, completed the BDI-II, the STAI and the BMIS, then sat in a sound-proof room to do the baseline full test, the first exposure block, the first mini-test, the second exposure block, the second mini-test, the third and last exposure block, the comparison full-test and finally the BMIS for a second time (figure 2).
Figure 2. A visual representation of this study’s procedure on the day of testing. General information was taken before the participant presented on site to avoid them coming if they had attained any exclusion criteria. Each box represents a block of the procedure.
Figure 3. Examples of the stimuli used in this project. The faces were retrieved from the Karolinska Directed Emotional Faces (KDEF;
Lundqvist, Flykt, & Öhman, 1998).
The faces shown in figure 3 appeared in every block, whether the tests or the exposures, and were randomized, such that no bias was possible for the order of
rated (see Figure 2 for more details about the blocks). E-Prime 2.0 (Psychology Software Inc., 2012) was used to present the instructions, stimuli, and collect response data. The study lasted between 45 minutes and an hour. Participants were compensated $10 for their participation.
As previously mentioned, participants were asked to click along a line to indicate what they perceive to be the emotional state of the presented face. Coordinates of the click were used to calculate the intensity and type (positive or negative) that was rated. The first Full Test served as a baseline, and the last Full Test was to complete the pre-post comparison of equivalent test stimuli (same faces, different order, and substantial time and distractors (other faces) between presentations). The two Mini-Tests were included to explore the time course of the predicted desensitization effects. We used a reduced number of faces in these tests in order to keep the overall duration of the experiment relatively short and also due to the limited number of different individual faces available in the set.
Design
Data Analysis. A mixed-design ANOVA that included within- and between-subjects components was used to analyse data. Furthermore, correlation analyses were necessary to evaluate if the results for the BDI-II, the STAI-Y1 and STAI-Y2, as well as the BMIS pre and post results correlated with the results to each subtest for each group. If significant correlations were found, it would have indicated a potential confound in any significant main effects that are based on the main hypotheses. Results were considered significant at the α<.05 level.
Within-Subjects Component. This research project had a within-subjects design component, where there was a comparison between ratings responses on a dimensional scale at test for baseline, Time 2, Time 3, and Time 4 for both the sad and the neutral group. An ANOVA was used to compare each mean to each other for each group, and to compute effect sizes. Also, correct responses were evaluated between baseline, Time 2, and Time 3 for working memory in the 1-Back task. There was a comparison between the means of Time 1 and Time 2 for each subscale of the BMIS to evaluate if mood
contributed to our results using a paired-samples t-test, one group at a time. The T-Test was two-tailed, because no direction for the change in responses to the BMIS was assumed.
Between-Subjects Component. There was also a between-subjects design component, where the neutral group was the control group to which the sad group was compared for emotion ratings as well as correct responses on the 1-back task. The 1-back task involved indicating with a left mouse click whether the face presented was the same as the one presented just before it. To evaluate relative desensitization based on the type of emotional stimuli, a comparison between group mean differences at baseline and Time 4 for emotional ratings was conducted. To do this, a two-sample equal variance t-test was used to determine if the difference between the baseline and Time 4 for each stimulus was greater for the sad group compared to the neutral group. As well, comparisons between group scores in the 1-Back task were conducted to evaluate working memory values based on the type of emotional stimuli. To do this, false positives, correct responses, and missed responses were each compared between groups using a mixed-design ANOVA that considered group and time of test to ensure that groups did not differ
on their diligent participation in the 1-Back task, and that they further did not differ based on the time of exposure, as the blocked design demonstrated that there are three exposure periods. In other words, this mixed-design ANOVA was to ensure that the participants in both groups paid equal attention to the faces at all times throughout the exposure periods.
Correlations. As discussed in the section on methodological considerations, attention, depressive symptoms, mood, arousal, and state and trait anxiety had to be controlled for in an emotion perception task. Thus, the data collected in the perceptual task were correlated with these variables to see if they covary. Correlations analyses were conducted between Time 1 and Time 2 of the BMIS, the BDI-II and the STAI-Y1 and STAI-Y2 (i.e., all the control measures) and baseline, Time 2, Time 3 and Time 4 for both the sad and neutral group to ensure that depressive symptoms, state- and trait-anxiety and any change in mood were not alternative explanations for any significant results that related to the main hypotheses. Any significant correlations between the results to the Tests and the control measure (BDI-II, STAI-Y1 and Y2, or BMIS pre and post) would have indicated that the results to the Tests were partially explained by depressive symptoms, anxiety, arousal and/or mood.
Results Between-Groups Component
Participant Characteristics. Although 48 participants were tested, 39
participants were included in analyses. The 9 participants whose data were not analyzed in the study scored too high on the BDI-II, the STAI-Y1 or the STAI-Y2 and one participant was excluded because they were too old to participate in the study. A Chi-Square analysis was used to compare groups on sex. Furthermore, two-sample
independent t-tests were used to compare groups on age, birth control use, student status and years of education. Birth-control use was included because it has been shown to affect emotional processing (Petersen, Kilpatrick, Goharzad & Cahill, 2014). Chi-squared analyses can provide erroneous results in situations where there are less than five events. This situation was present for birth control and for student status in the present sample. As a result, the data was transformed into a frequency distribution. Birth control
consumption was analyzed by entering “0” for no birth control and “1” for birth control for each group and conducting a two-sample independent T-Test between groups. Similarly, a “0” was entered for student status and a “1” was entered for non-student status and the groups were compared using a two-sample independent T-Test. No statistically significant differences were found between groups. Results are presented in table 1.
Table 1. Participant Characteristics Results. Two-sample independent T-Tests were conducted between groups for all participant data except for
Sad (n=18) Neutral (n=21) t-test; (chi-square) Age Mean 22.83 24.19 0.24 Standard Deviation 2.62 3.59 n.s. Female/Male 11/8 13/8 (0.69) (n.s.) n for non-students 2 4 0.51 n for students 16 17 n.s. Mean 0.11 0.19 0.51 Standard Deviation 0.32 0.4 n.s. Mean 17 17.05 0.83 Standard Deviation 2.77 3.04 n.s.
n for birth control 0 3 0.10
n for no birth control 18 19 n.s.
Mean 0 0.14 0.10 Standard Deviation 0 0.36 n.s. Sex Student Status Years of Education Take Birth Control
Under normal circumstances, birth control and student status would be analyzed with a chi-squared test because they are categorical, but the frequencies were below 5. As a result, the data was analyzed as a
frequency distribution using a two-sample independent T-Test. Chi-Square analyses results are in parentheses.
Attention. Attention was analyzed as a control to ensure participants paid
attention to the stimuli being presented through a working memory task. It was analyzed by using a 1-Back task to ensure that participants remained engaged in the exposure portion of the experiment. This was a measure used to ensure that no group differences in exposure engagement could better explain any differences found between groups, and to ensure that the exposure portion of the blocked design was equivalently attended to between groups. A mixed-design ANOVA was used to examine any differences between groups based on the exposure session (1, 2, or 3). No significant results were found, demonstrating that responses to the 1-Back task did not differ between groups nor between sessions. No interaction between group and session was found (F (1,
124)=0.849, p=.43, partial eta squared = .015). Correct responses (M=2.70, SD=0.70), false positive responses (M=0.87, SD=2.19) and missed responses (M=0.31, SD=0.69) were considered in this analysis. Groups were consistent in their correct responses (F (1, 62)=1.207, p=.27, partial eta squared = .011), false positive responses (F (1, 62)=2.551, p=.113, partial eta squared = .022) and missed responses (F (1, 62)=.488, p=.468, partial eta squared = .004). The results between sessions were also consistent for correct
(1, 62)=.876, p=.419, partial eta squared = .016) and missed responses (F (1, 62)=.461, p=.632, partial eta squared = .008). See table 2 for the attention results.
df F η p Main Effects Group Correct 1 1.207 0.011 0.270 Missed 1 0.488 0.004 0.468 False Positive 1 2.551 0.022 0.113 Test Correct 1 0.641 0.011 0.529 Missed 1 0.461 0.008 0.632 False Positive 1 0.876 0.419 0.016 Table 2. Results to Attention Analyses.
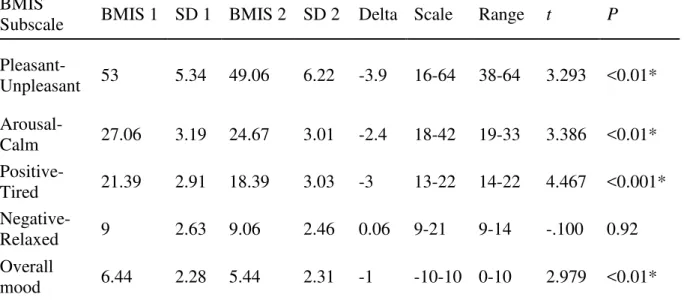
Mood. A t-test was conducted to compare pre and post responses to the BMIS (BMIS 1 and BMIS 2, respectively) for each mood scale for each group. Specifically, the BMIS is composed of the pleasant-unpleasant mood scale, the arousal-calm mood scale, the positive-tired mood scale, the negative-relaxed mood scale, and the overall mood scale. There were no statistically significant changes in mood for the neutral group. Alternately, moods changed significantly in the sad group. Mood became significantly less pleasant (t=3.293; p<.01, α=0.05), less aroused (t=.3.386; p<.01, α=0.05), less positive (t=4.467; p<.001, α=0.05), and participant overall mood decreased after the tests and exposure blocks. The fact that their overall mood did not become more positive (t=2.979; p>.01, α=0.05) is consistent with these results. Interestingly, none of the mood scales were significant for the neutral group, which shows that mood was unaffected by the neutral stimuli. Correlation analyses were thus performed on the significant mood results to evaluate if they affected the responses to the perceptual task. Means, standard deviations and ranges for each mood scale are presented in table 3 for the sad group and table 4 for the neutral group. The table includes the means and standard deviations for the
group at both times of the BMIS. The difference between the first and second mean (i.e., Delta) are presented and the t-value is presented for each BMIS scale.
BMIS
Subscale BMIS 1 SD 1 BMIS 2 SD 2 Delta Scale Range t P Pleasant-Unpleasant 53 5.34 49.06 6.22 -3.9 16-64 38-64 3.293 <0.01* Arousal-Calm 27.06 3.19 24.67 3.01 -2.4 18-42 19-33 3.386 <0.01* Positive-Tired 21.39 2.91 18.39 3.03 -3 13-22 14-22 4.467 <0.001* Negative-Relaxed 9 2.63 9.06 2.46 0.06 9-21 9-14 -.100 0.92 Overall mood 6.44 2.28 5.44 2.31 -1 -10-10 0-10 2.979 <0.01* Table 3. Sad Group BMIS Results (n = 18). This table displays the sad group results to
the BMIS scales as well as their p values for the T-Test. BMIS
Subscale BMIS 1 SD 1 BMIS 2 SD 2 Delta Scale Range t p Pleasant-Unpleasant 50.95 6.61 50.57 6.76 0.38 16-64 33-61 0.377 0.7 Arousal-Calm 26 4.74 25.38 3.8 0.62 18-42 18-32 1.163 0.3 Positive-Tired 20.38 4.66 19.62 4.24 0.76 13-22 13-26 1.35 0.2 Negative-Relaxed 9.05 2.6 9.71 3.58 -0.7 9-21 9-21 -0.81 0.4 Overall mood 6.9 1.79 6.62 1.91 0.29 -10-10 0-10 1.511 0.3 Table 4. Neutral Group BMIS Results (n = 21). This table displays the neutral group
results to the BMIS scales as well as their p values for the T-Test.
Correlations. Correlation analyses were conducted between p = time of test and results to all control measures (BDI-II, STAI-Y1, STAI-Y2, and the significant scales for
STAI-Y1 and STAI-Y2 to the variation in the test responses, the difference (or delta) was used between time 4 (Full Test 2) and Time 1 (Full Test 1) was correlated to the results of all participants to the BDI-II, STAI-Y1 and STAI-Y2. Participant characteristics were not used in the correlation because none of them were found to be significantly different between groups. Alternatively, to correlate the BMIS results at time 1 and time 2 with the test responses during the visual appraisal task would be more meaningful if the
difference, or change in responses to BMIS be correlated with the change in responses to the task. Thus, the deltas of each significant BMIS scale that was significant were
correlated with the same responses to the task. Because the statistical significance was limited to 4 of the BMIS scales only in the sad group, only sad group results were compared to their results in these subscales. The null result of all these correlations means that although mood changed significantly for the sad group, the results did not correlate with the results from the perceptual task. As such, mood does not seem to have influenced the responses to the perceptual task. This effectively isolates exposure as the only known factor in this study that caused a significant change resembling a PE in their ratings.
Delta PU Delta AC Delta PT Delta OM BDI-II STAI-Y1 STAI-Y2 Correlation with Delta Test Response r -0.02 0.13 0.35 0.17 -0.20 -0.09 0.09 Sig 0.93 0.62 0.15 0.49 0.23 0.58 0.58 n 39 39 39 39 39 39 39 Mean -2.03 -1.44 -1.80 -0.62 5.23 29.74 37.49 SD 5.11 2.82 2.90 1.29 5.20 7.00 9.32 Range -20 - 10 -7 - 5 -10 - 4 -4 - 2 0 - 17 20 - 52 21 - 57 Table 5. Correlation Analyses Results. Abbreviations:
PU=Pleasant-Unpleasant, AC=Arousal-Calm, PT=Positive-Tired. Delta is the last value minus the first value. In the case of the BMIS scales, it is the result at the second test minus the result at the first test for each subscale. In the case of the Test Response, it is the result at the final test minus the result at the baseline measure.
Neutral (n=21) Sad (n=18)
Test BDI STAI-Y1 STAI-Y2 BDI STAI-Y1 STAI-Y2 Range 0-17 20-52 21-57 0-11 20-44 22-57
SD 5.94 7.41 9.08 3.65 6.83 9.93
Mean 6.67 30.14 37.86 3.56 29.28 37.06 Table 6. Group scores on BDI-II, STAI-Y1 and STAI-Y2.
ANOVA. A mixed-design ANOVA was used to compare means between sad and neutral groups, and to evaluate the within-subjects component of test time. Test time had four levels, that is the baseline (Full-Test 1), the two intermediaries to evaluate the effect of exposure throughout the experiment (Mini-Test 1 and Mini-Test 2) and a final test that was equivalent to baseline (Full-Test 2). Test time (F (1, 40)=11.051, p<.001 partial eta squared = .216) and group (F (1, 40)=70.521, p<.001, partial eta squared = .638) were both found to be statistically significant main effects. There was no statistically significant interaction effect (F (1, 40)=1.739, p=.165).
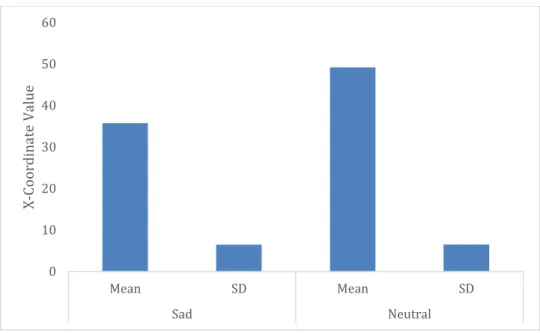
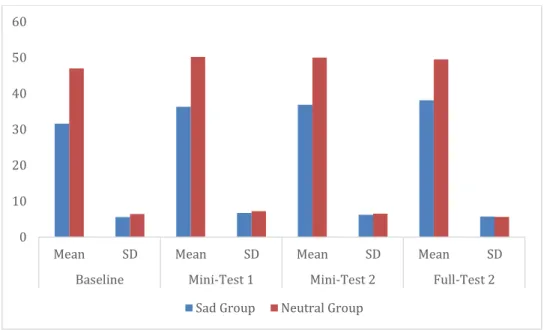
The range of responses were based on the x-coordinate of the mouse click a dimensional scale ranging from 158 to 461, 309.5 being the exact middle, or “0”, of the scale. For ease, these values have been converted to a 0-100 scale. The main effect of group was such that the sad group (M=35.73, SD=6.46) rated the faces as more negative than the neutral group (M=49.18, SD=6.49) overall. The main effect of test time was such that the sad group (baseline M=31.61, SD=5.58; Mini-Test 1 M=36.29, SD=6.74; Mini-Test 2 M=36.88, SD=6.20; Full-Test 2 M=38.14, SD=5.73) slowly but consistently rated the faces as less negative, whereas the neutral group rated Mini-Test 1 as the most positive and the baseline as least positive (baseline M=47.00, SD=6.43; Mini-Test 1 M=50.20, SD=7.20; Mini-Test 2 M=50.00, SD=6.54; Full-Test 2 M=49.51, SD=5.64).
Figure 4. Average Group Values for Face Judgments. This figure represents the converted x-coordinate that participants clicked in response to emotional stimuli by group. It represents the group main effect.
0 10 20 30 40 50 60 Mean SD Mean SD Sad Neutral X -C oor din a te Va lue
Figure 5. Group Values for Face Judgments by Test Time. This figure represents the converted x-coordinate that participants clicked in response to emotional stimuli by group by test time. It represents the test time main effect.
Because there are four levels for the within-subjects factor of test time, a post hoc analysis with Bonferroni adjustments was conducted. The comparisons demonstrated a significant difference between the baseline and all other test times. Specifically, there was a statistically significant difference between the baseline and mini-test 1 (F (1,
40)=11.941, p=.002), which could be attributed to priming, whereas the statistically significant difference between the baseline and Mini-Test 2 (F (1, 40)=12.535, p<.001) could be attributed to desensitization. As previously mentioned, priming is a perceptual process where humans are biased by recent exposure to a priming stimulus when they make judgments (DeCoster & Claypool, 2004). The difference between the baseline and the equivalent final test (F (1, 40)=13.689, p<.001) was the greatest statistical difference. There was no statistically significant difference between Mini-Test 1 and Mini-Test 2 (F
0 10 20 30 40 50 60
Mean SD Mean SD Mean SD Mean SD
Baseline Mini-Test 1 Mini-Test 2 Full-Test 2 Sad Group Neutral Group
(1, 40)=.594, p=1.000), demonstrating that the desensitization effect was gradual. There was also no statistically significant difference between Mini-Test 1 and Full-Test 2 (F (1, 40)=1.749, p=1.000). Finally, there was no statistically significant difference between Mini-Test 2 and Full-Test 2 (F (1, 40)=1.739, p=.169), further demonstrating the gradual effect of desensitization between the baseline and the final test. Taken together, a priming effect occurred during the baseline test, and a more gradual desensitization effect took place throughout the experiment. This is in part substantiated by the fact that the only sequential tests that garnered statistically significant results were the first two, but the greatest effect was compounded through time such that the greatest difference was found between the baseline and the last test. See Table 6 for a summary of the results.
df F η p
Main Effects
Group 1 70.5 0.64 <.001 Test 1 11.1 0.22 <.001 Post Hoc (comparisons to baseline)
Mini Test 1 1 11.9 n/a 0.002 Mini Test 2 1 12.5 n/a <.001 Full Test 2 1 13.7 n/a <.001 Table 7. ANOVA Results.
Discussion
The goal of this research project was to demonstrate the possibility of a positivity effect that is both perceptual and gradual throughout the lifetime. As a first step, the specific goal of this study was to test it only in young adults through a limited, and controlled, exposure, as a proof of principle. It was expected that young adults would rate negative stimuli at a lower negative magnitude after exposure to negative emotional stimuli (desensitization). In this study, negative emotional stimuli were represented by
Cartensen, 2005). It was further expected that young adults would not significantly differ in responses after exposure to neutral emotional stimuli. Participants were exposed to either sad or neutral stimuli for approximately 25 minutes. The stimuli were presented and perceptual differences were measured through a blocked design of presentation. The magnitude (from “0” to extremely negative, for example) and valence (positive or
negative) perceived were both of interest. The participants began the study by responding to the general information questionnaire, the BDI-II, the STAI-Y1, the STAI-Y2 and the BMIS to measure depressive symptoms, state and trait anxiety and mood including arousal, respectively. Then, participants responded to the baseline test (also known as Full-Test 1), where they rated faces on the emotion perceived on a dimensional scale ranging between extremely negative to extremely positive with a “0” at the neutral mark. Participants then did a 1-Back design task while being exposed to new faces. Mini-Test 1 followed, where participants rated 10 new faces. Another exposure with the 1-Back task followed Mini-Test 1. Then, Mini-Test 2 was presented, where 10 new faces were rated. Finally, a third exposure and 1-Back task was presented, followed by the final test, where a randomized presentation of the first 20 faces was to be rated. Immediately after this final test, which was also known as Full Test 2, the participants completed a second BMIS to measure any mood differences. Taken together, the experiment took into consideration mood and evaluated the effect of time on the participant responses, as well as the emotional stimuli to which they were exposed by assigning them to either the sad or the neutral group. The results were such that participant characteristics including sex, age, education, student or employment status, birth-control consumption, depressive symptoms, state and trait anxiety, attention to the stimuli and mood before and after the
experiment were not significant factors to explain the variability in participant responses to the rating tests. The results isolate type of stimuli presented (group) and time of exposure as main and sole factors to explain the differences in ratings throughout the experiment. The greatest difference was found to be between the baseline and final tests, where participants rated stimuli as less negative (and in some cases, the responses went into the positive spectrum) as they were exposed to the negative and neutral stimuli. In other words, although there was a statistically significant effect between groups, both the neutral and the sad group demonstrated the positivity effect over time. A priming effect was also found within the first few minutes of the experiment, which supports previous findings that the priming effect takes place after exposure to emotional stimuli. Most interesting is that the neutral group also had a more positive response after exposure to strictly neutral stimuli, which supports the idea that humans change their basis of
comparison for different emotions whether the emotional valence of the stimuli is of high or low magnitude. It is probable that, with these results in mind, the positivity effect found in this sample of young adults is a constant and automatic process, because a perceptual task was used.
Priming and The PE. An important consideration for the hypothesis presented in this study is the mechanism of priming as a potential basis for the desensitization to negative stimuli. In the priming literature, some researchers have studied trait-judgments, such as “adventurous” or “reckless”. Participants are exposed to a written or visual priming stimulus that is intended to bias them toward the negative or positive trait. For example, they would read or watch something that is either positive or negative. These priming stimuli have a varying degree of relevance to the final judgment, depending on
the study, but must at least be somewhat applicable (Higgins, Rholes, & Jones, 1977). After a delay, participants are asked to judge whether they consider a person
“adventurous”, the positive judgment, or “reckless”, the negative judgment. Priming could be the mechanism of input that leads to either long term or short-term changes to emotional judgments. It is possible that the time of exposure or frequency of exposure to the emotional stimuli is the factor that determines if self-reflection is affected at short, medium or long-term.
DeCoster and Claypool (2004) published a meta-analysis reviewing several decades of priming research. From that literature, they examined what aspects of the stimuli most affect judgments. They put together the existing theories (Schwartz & Bless, 1992; Wegener & Petty, 1995; Smith & DeCoster, 2000) to propose a holistic theoretical model for future research. The delay between prime presentation and the judgment phase varies from no delay to 10 minutes of delay. Studies have found that primes that do not share the same meaning but are similar in valence can prime each other (e.g., “kindness” can prime a participant to be more likely to judge someone else as “honest”; Devine, 1989; DeCoster & Claypool, 2004). It seems that humans are easily and quickly influenced by their context, because 10 minutes, which is the maximum amount of time a prime is considered to have been significant, is a short delay. This adds to the proposed hypothesis where repeated exposure to negative stimuli throughout our lifetime has deeper and more permanent effects on judgment tendencies, and human priming mechanisms are a part of this intrinsic mechanism where humans adapt to their long-term emotional environment in how they judge and appraise future emotional stimuli.
Indeed, DeCoster and Claypool (2004) propose that priming may be a filter to retain only relevant judgment information. This allows for a constant ability to use or ignore chronically accessible judgment information. Mussweiler (2003) suggested that judgments tend to require a comparison. He explained that people select a relevant standard and evaluate based on that internalized standard. In other words, anchoring, which is the use of the prime as a standard of comparison, is the natural mechanism behind social judgments. DeCoster and Claypool (2004) report that research on priming effects show that anchoring is an automatic process, or a perceptual mechanism, which occurs most automatically in the context of chronic future-event expectancies in the absence of a high cognitive load. In other words, in non-stressful judgment situations, humans compare their internal standard based on previous primes to form their
expectations (Weary & Reich, 2001). DeCoster and Claypool (2004) wrap up their meta-analysis by suggesting that repeated priming stimuli (e.g., sad faces) would lead to an exemplar used as a consistent standard of comparison for future similar stimuli. They suggest that future research consider the functional implications of these processes for humans. This conclusion is in line with the proposed hypothesis in this study.
This research project had several strengths, the greatest of which is the measurement of emotion perception during the experimental activation of the PE. A meta-analysis from Reed, Chan and Mikels (2014) highlights the greatest strength of this study, because it demonstrates the limits to how the PE has been studied thus far. Their study is a meta-analysis of the PE literature. The article aggregates a large body of research on the PE to determine if it exists in elderly adults. Their principal conclusion is that the PE has been shown across studies to exist. However, one of the rules they applied
in their search for papers is that «All included studies needed to have direct measures of attention and/or memory for emotionally valenced information» (Reed, Chad & Mikels, 2014). This approach is reductive, and is present in most studies of the PE (e.g., Mather & Cartensen, 2005). The PE is supposed to be based on emotion regulation according to the theoretical foundations of their search (Mather, 2006). Attention and memory represent two separate moments in the encoding process. Measuring attention through eye-tracking devices would allow you to know what the person is focusing on. This information allows us to know that if something is encoded, it would be related to what the person was focusing on. To then test memory adds information about what was encoded over a certain period of time. Attention and memory thus only englobe certain aspects of the full PE. Although they measure encoding of the emotionally valenced information in two different ways, they do not specifically measure emotion-regulation itself. The fact that this particular study did not take into consideration a larger approach to the PE reduces the validity of their study and most of the PE research, because the PE is an emotion-regulation based phenomenon. In other words, current perspectives in research on the PE have made an effort to prove it exists, but have not viewed it as a lifelong process in emotional development. The current study has added to the PE literature by aggregating current neurological, emotion processing, PE and aging knowledge to frame the PE in terms of emotional processing. This study proposed a better supported emotion processing mechanism, and attempted to directly measure it in response to stimuli that would set off the PE. Taken together, this study adds a new theoretical basis to the PE, which adds a new research perspective to the PE literature that may be more holistic.
This research project also had several limitations that need to be mentioned. In particular, part of the theoretical basis for the research project was neurological, but no imaging was done to better support our hypotheses. As well, to truly say that the PE is a lifelong, gradual mechanism in response to emotional stimuli in our environment,
different research designs could have been more appropriate. Testing participants an hour later or having participants of all ages, or using a longitudinal design would have been necessary. Furthermore, it would have been better to measure the participants’ memory of the emotional faces and their attention to the stimuli as had been done in most PE studies. Finally, having a group exposed to happy stimuli would have provided insights into the specificity, or not, of these effects to negative stimuli.
It seems that this mechanism would only apply to healthy humans. Indeed, research similar in method but with contradictory results to that of the PE has been conducted with people suffering from psychopathologies. Depressed adults tend to have intact processing of negative stimuli, but impoverished abilities to recognize somewhat happy faces
(Joormann & Gotlib, 2006). In psychologically healthy people, response shift research shows that humans adapt their judgment of their quality of life over time to degraded circumstances (Schwartz, Bode, Repucci, Becker, Sprangers & Fayers, 2006). Response shift is the change in judgments of a variety of emotion-related constructs, including quality of life, pain, fatigue and psychological well-being, for example. They start by feeling more negative about being ill, for example, but over time adjust their perspective on their quality of life such that they see it as more positive than their initial reported judgment. Although this response shift phenomenon is generally studied with the aims of improving the objective accuracy of self-report measures in clinical research, this change
in judgment seems to reflect the same natural mechanism of adaptation through the PE. Specifically, one’s perspective of their experience changes over time in a way similar to the PE in the face of degraded health, or after being chronically exposed to high- and low- magnitude negative experiences (Schwartz et al., 2006). It seems that, in general, in self-reflection, the self’s experience is more negative when in degraded circumstances, or when one has more experience of negative emotional stimuli. Similarly to the elderly with the PE, their responses become shifted toward a more positive pattern, because their internal basis of comparison has become more negative. Again, despite having both positive and negative high-magnitude experiences, the negative experiences would have the greatest effect on their frame of reference. The evidence found from response shift supports the idea that it would be this natural mechanism of changes in self-reflection, brought on by a life of experiences where negative stimuli affects these changes the most. It further supports that the elderly would become hypersensitized to positive stimuli as a result.
This study has allowed the research on the PE to be conducted in a new way. Through the experimental procedure to verify perception and appraisal as potential underpinnings of the PE, it has provided a new explanation for emotional development. This project has also provided the possibility of a preventative approach to emotional psychopathologies. In particular, if much more research is completed on this subject and reliable definitions of the PE at different times throughout human life are found,
clinicians could screen patients for pathological emotional perceptions for their age. It has also provided a new way to evaluate the PE in experimental conditions, and has put a focus on the emotion processing part of the PE and its implications for emotional
development. The use of deltas as a basis for analyses is also a more meaningful and direct measure of the changes in responses and mood. It may be a better way to conduct analyses for future studies on the emotional processing component of the PE.
In the future, the blocked design and delta analyses could be used to measure emotional regulation during the PE phenomenon. It would be useful to incorporate an imaging component, especially one with good temporal resolution to better understand the emotional underpinnings of the PE. Finally, this project opens countless new possibilities for research projects which, as mentioned, could lead to a reliable understanding of emotional development and support clinicians in detecting and preventing emotional psychopathologies.
Acknowledgements. I would like to begin by thanking my supervisors, prof. Jorge Armony and prof. Nathalie Gosselin, for their unending patience and understanding through what was a difficult time. I would like to thank Simon Rigoulot and Mayra Smith Romero for their tangible help in my project. I would like to thank my parents, Gregory Best and Margarita Silva, for listening and being there through the hardest times. I would like to thank Paul Lemaître, as well as my friends (especially Sebastian Gonzalez) for their support and their ear when I needed to discuss my ideas. My rabbit, Cornelius, and my cat, Lego have been there for me when I needed comfort. I would like to thank my computer for staying strong and caffeine for keeping me strong. Thank you all for your encouragement and for believing in me. I could not have done this without you.
References
Andrade, J., Kavanagh, D., & Baddeley, A. (1997). Eye‐movements and visual imagery: A working memory approach to the treatment of post‐traumatic stress disorder. British Journal of Clinical Psychology, 36(2), 209-223. DOI: 10.1111/j.2044-8260.1997.tb01408.x
Armony, J., & Vuilleumier, P. (Eds.). (2013). The Cambridge handbook of human affective neuroscience. Cambridge university press. URL:
http://dx.doi.org/10.1017/CBO9780511843716
Bargh, J. A., & Pietromonaco, P. (1982). Automatic information processing and social perception: The influence of trait information presented outside of conscious awareness on impression formation. Journal of personality and Social psychology, 43(3), 437.
Beck, A. T., Steer, R. A., & Brown, G. K. (1996). BDI-II. Beck Depression Inventory- Second Edition Manual.
Breiter, H. C., Etcoff, N. L., Whalen, P. J., Kennedy, W. A., Rauch, S. L., Buckner, R. L., Strauss, M.M., Hyman, S.E., & Rosen, B. R. (1996). Response and habituation of the human amygdala during visual processing of facial expression. Neuron,17(5), 875-887. DOI: http://dx.doi.org/10.1016/S0896-6273(00)80219-6
DeCoster, J. & Claypool, H.M. (2004). A Meta-Analysis of Priming Effects on Impression Formation Supporting a General Model of Informational Biases. Personality and Social Psychology Review, 8(1), 2-27. URL: