HAL Id: hal-01894535
https://hal-imt-atlantique.archives-ouvertes.fr/hal-01894535
Submitted on 16 Oct 2018
HAL is a multi-disciplinary open access
archive for the deposit and dissemination of
sci-entific research documents, whether they are
pub-lished or not. The documents may come from
teaching and research institutions in France or
abroad, or from public or private research centers.
L’archive ouverte pluridisciplinaire HAL, est
destinée au dépôt et à la diffusion de documents
scientifiques de niveau recherche, publiés ou non,
émanant des établissements d’enseignement et de
recherche français ou étrangers, des laboratoires
publics ou privés.
Optimizing the Performance of a Microservice-Based
Application Deployed on User-Provided Devices
Bruno Stévant, Jean-Louis Pazat, Alberto Blanc
To cite this version:
Bruno Stévant, Jean-Louis Pazat, Alberto Blanc. Optimizing the Performance of a
Microservice-Based Application Deployed on User-Provided Devices. ISPDC 2018 - 17th International Symposium
on Parallel and Distributed Computing, Jun 2018, Genève, Switzerland. pp.133-140,
�10.1109/is-pdc2018.2018.00027�. �hal-01894535�
Optimizing the performance of a microservice-based
application deployed on user-provided devices
Bruno St´evant
IMT Atlantique, IRISA
Jean-Louis Pazat
Univ Rennes, Inria, CNRS, IRISA [email protected]
Alberto Blanc
IMT Atlantique, IRISA
Abstract—It is now feasible for consumers to buy inexpensive devices that can be installed at home and accessed remotely thanks to an Internet connection. Such a simple “self-hosting” can be an alternative to traditional cloud providers, especially for privacy-conscious users. We discuss how a community of users can pool their devices in order to host microservices-based applications, where each microservice is deployed on a different device. The performance of such an application depends heavily on the computing and network resources that are available and on the placement of each microservice. Finding the placement that minimizes the application response time is an NP-hard problem. We show that, thanks to well known optimization techniques (Particle Swarm Optimization), it is possible to quickly find a service placement resulting in a response time close to the optimal one. Thanks to an emulation platform, we evaluate the robustness of this solution to changes in the Quality of Service under conditions typical of a residential access network.
Index Terms—Edge computing, Performance modelization, QoS-aware placement, Particle Swarm Optimization, Microser-vice application design
I. INTRODUCTION
Over the last decade, the number of public cloud providers has increased significantly. It is now possible to rent resources located in one or more data-center. Such an infrastructure can satisfy the needs of a large number of users, but it does have the downside that data must be moved (and often stored) in these shared data-centers, raising doubts about the privacy of the data and, potentially, its ownership (for instance, in the case of providers going out of business).
Data-centers are not alone in taking advantage of techno-logical progress: user devices, including personal computer and set-top boxes, have ever increasing computing and storage capabilities. Computer networks offer higher data rates to the wider public, with the spread of Fiber To The Home (FTTH) solutions and high speed wireless networks. Thanks to all this, it is conceivable for the devices hosted on the user premises to offer services to their owners, even remotely. Such a solution has the added advantage of addressing the data privacy and ownership issues mentioned above.
An obvious shortcoming of such an approach is that it introduces two single points of failures, namely the user device and the corresponding network connection. Either one can fail, rendering the service unavailable remotely. While modern hardware is reasonably reliable, such a solution is no match for the public cloud providers that can offer highly available services thanks to their redundant infrastructure.
A possible solution to overcome these limitations is for sev-eral users to cooperate, by pooling their individual resources to form a larger (redundant) system. A few devices (for instance between 10 and 20) can already be enough to significantly increase the availability and, potentially, the performance with respect to a single device. As an example, let us consider a sport club, whose members would like to share pictures and other materials related to the club activities. One member decides to use the storage space available on one of his devices connected at home to let other members store and retrieve their photos. When comparing this solution with the service provided by a public platform, two limitations stand out. First, as these devices are provisioned for individual usage, they might not have enough local resources (CPU, storage, network) for a larger number of users. In our example, the storage space and the residential network will become bottle-necks as members of the club are uploading and browsing more photos. The second limitation comes from the lower availability of these on-premise devices. The photo-sharing storage will be unavailable anytime the device is powered off or experiencing a network outage. If multiple members of the sport club are willing to share their devices and network connectivity, they could significantly improve the situation, provided they have a large enough variety of network providers and usage patterns. Extended functionalities like generating thumbnails and presenting them in a web gallery can be offered to the community as the different devices contribute to the application with their computing and networking resources. Members of the community will fully benefit from the cooperation between the devices as the application can be distributed over these devices. Many frameworks for distribut-ing applications over user-provided devices have been already proposed, such as Cloud@Home[6], Nebulas[4], Community Cloud[13] or CNMC[17]. These solutions aim at creating an Infrastructure-as-a-Service (IaaS) interface on top of the user-provided devices where applications embedded inside virtual machines can be deployed and managed the same way as in a data-center. Such solutions however tends to be complex as they have to adapt to devices and networks which are much more heterogeneous and with a lower availability rate than the infrastructure of a data-center.
In this paper we focus on a higher level solution where the application is based on a microservice architecture[11]. In such an architecture, each basic functionnality of the application is
provided by a separate microservice. The application can be considered as a composition of these different microservices. Distributing the application on the user-provided devices is then possible by deploying each microservice on the different devices. Once each microservice is deployed and accessible from any other devices, the composition of these services offers a fully functional application.
Such a distribution solution is very flexible as many possible placements of the services of the application are possible. The performance of application is however highly dependent of the chosen placement. Each service may indeed be deployed on devices with CPU and network resources that are insufficient for the task handled by the service. Finding the devices where to deploy the microservices which result in the optimal per-formance of the application is a difficult problem. The choice of a placement of the service has to match the requirements of the services and the resources available on the devices.
As a first contribution of this paper, we describe in Sec-tion III a model to evaluate the performance of the applicaSec-tion depending on the capabilities of devices chosen for hosting the microservices. In section IV we define the problem of finding the placement of the services that optimize the performance as defined by our model. The Particle Swarm heuristic is used to find acceptable solutions to this problem in constant time. A second contribution of this paper is the evaluation of the results of this heuristic on a platform emulating user-provided devices interconnected by a network with similar capabilities to residential networks. We demonstrate in Section V that with relatively little information on the infrastructure and on the application, the heuristic can find good solutions close to 15% of the optimal performance.
II. A CONCRETEEXAMPLE:APHOTOSHARING
APPLICATION
In this paper, we consider a photo sharing application, allowing users to upload their photos and browse a web gallery with thumbnails of the stored photos. Such an application could be used, for instance, by the people belonging to a sport club. As Figure 1 (a) shows, we have implemented the application using four microservices:
• WebUI (UI): provides a web photo gallery with thumb-nails and a form to upload photos.
• PhotoHub (PH): stores the photos.
• ThumbHub (TH): produces the thumbnail of a photo by
resizing the original photo.
• MetaHub (MH): stores the photo metadata.
It is important to note that the microservices are inter-dependent: in order to accomplish a task, a microservice may need to call other services to get some data or perform other tasks. For example, the ThumbHub service relies on the PhotoHub service to retrieve the original bitmap of the photo and on the MetaHub service for the metadata of the photo.
We want to distribute these microservices on different user-provided devices, characterized by heterogeneous CPU and network capabilities. Figure 1 (b) shows a representation of these devices interconnected by the Internet. Each device
offers a different amount of CPU resources, depending on its hardware profile. The residential access networks that connect the device to the Internet also have heterogeneous capabilities in terms of bandwidth and latency, depending on the technology used by the access network (DSL or Fiber).
Figure 1 (c) gives an example of a deployment of the application over these devices. Some devices are selected to host a service of the application, for example by using a placement algorithm such as the one that we describe later. Once the services are deployed, an external registry service, not described in this paper, is used to make the deployed services known and reachable from the other services. The services, being able to communicate directly with each other, are then capable of cooperating in order to offer all the functions of the photo sharing application.
Many deployments are possible, each one potentially re-sulting in a different performance of the application. The time for a service to handle a request depends on the computing capabilities of the hosting device, especially when this task requires some computations. For example, the ThumbHub service, which has to generate thumbnails by resizing an photo, will perform better if located on a device with more CPU resources.
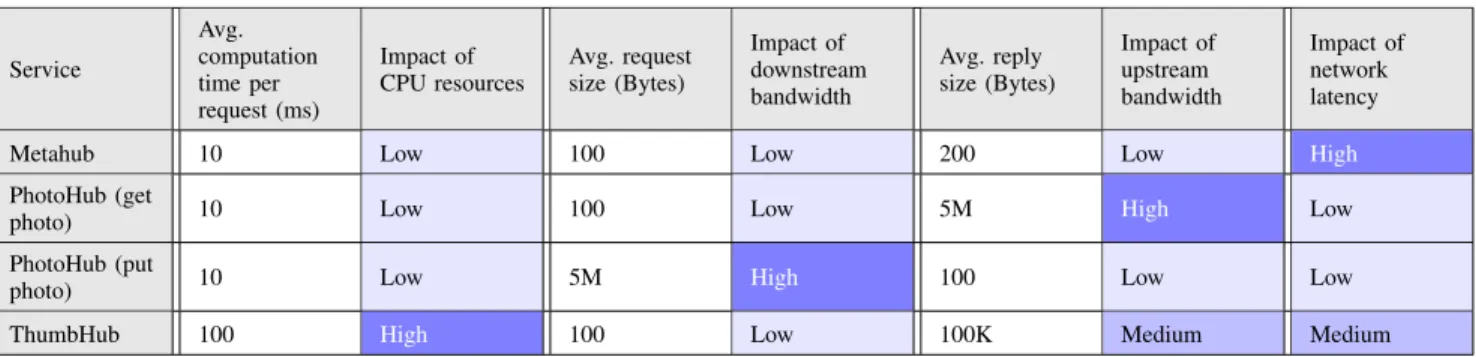
As the microservices communicate through a wide-area network, the time spent in forwarding the requests and re-sponses over the network can have a significant impact on the performance of the application. In the photo sharing application, given that both the UI and the TH services use the PH service, the available bandwidth on the links connecting them to the PH service can influence heavily the performance and hence the user experience. Compared to the PH service, the MH service requires the transfer of a smaller amount of data, namely the metadata of the photos. This service is therefore more impacted by the network latency. Table I gives an overview of the impact of the available CPU resources and of the network Quality of Service (QoS) parameters on the performance of the different services.
For these reasons, the global performance of the application depends on the placement of each microservice. Deciding on which devices one should deploy the microservices, in order to maximize the performance of the application, is a difficult problem. The choice of a placement should consider the requirements of each microservice in terms of computing and communication resources, as well as the interactions between the different services.
III. PERFORMANCEMETRICS
In this section we compute the response time of the appli-cation, from the point of view of its users. That is, the time needed to accomplish different tasks, such as displaying the photo gallery, downloading (or uploading) a photo. We model the performance of the application as a weighted average of the response times of all the possible user actions. This is a proxy for the Quality of Experience (QoE) experienced by the user [8].
UI PH TH
MH
(a) Microservices-based application
Internet
DSL
Fiber
CPU
(b) User-provided devices with different capabilities
Internet UI PH UI TH UI MH
(c) Deployment of microservices on devices
Fig. 1: Deployement of an application based on microservices over user-provided devices.
Service Avg. computation time per request (ms) Impact of CPU resources Avg. request size (Bytes) Impact of downstream bandwidth Avg. reply size (Bytes) Impact of upstream bandwidth Impact of network latency
Metahub 10 Low 100 Low 200 Low High
PhotoHub (get
photo) 10 Low 100 Low 5M High Low
PhotoHub (put
photo) 10 Low 5M High 100 Low Low
ThumbHub 100 High 100 Low 100K Medium Medium
TABLE I: Impact of CPU resources and network QoS on the performance of the services
Such an approach requires knowing the response time of each microservice, on which device each microservice is running, as well as the characteristics of the network paths (available bandwidth and delay) between the devices hosing the microservices. The response time of each microservice depends itself on the resources (CPU, memory) available on the device on which it is running but these factors can be incorporated in the response time of the microservice, if its value is sufficiently stable. This is the case if the network is the bottleneck rather than the computing devices. As reasonably powerful devices are not very expensive, we believe that the network will indeed be the bottleneck most of the times, especially for devices connected by a wide area network, resulting in response times that depend mainly on the network QoS, as long as the devices are not overloaded.
In [16] the authors propose to use the response time of a service deployed on a particular device as a unified utility function to evaluate the performance of a service. This metric unifies in a single value parameters such as CPU ressources and network QoS. In our case, we can apply the same metric to evaluate the performance of a service deployed on a user-provided device. This metric depends on the service itself, on the device where the service is deployed and on the device requesting the service.
We assume that it is possible to estimate the response time of each service, more precisely that it is possible to estimate how long it would take for a service s, running on device n, to call service s0, running on device n0. This could be done,
for instance, by deploying each service on each node and then by running a series of measurements. While such a solution is potentially time consuming, it is feasible and, by repeating it periodically, one could keep up with any changes in the network and/or devices.
Each client can evaluate the performance of the application as the sum of the response times of the calls to the application. In the case of the photo-sharing application, the different calls are: browsing the gallery of photos, downloading a full-size photo, downloading a thumbnail of a photo and uploading one photo.
By knowing the values of the response times for the different services, we can evaluate the response time of the application as the sum of the response times for each mi-croservices involved in the application. We need the following definitions in order to define the objective function f :
• Let N be the set of devices in the infrastructure.
• Let C be the set of devices used as clients of the application (C ⊂ N ).
• Let S be the set of services composing the application. • Let D(si, sj) be the dependency between each service si
and sj; D(si, sj) = 1 if si needs to call sj, otherwise
D(si, sj) = 0.
• Let P (s) be the chosen placement for service s (s ∈ S, P (s) ∈ N )
• Let Rs(ni, nj) be the response time of a service s
requested by device ni when running on device nj.
for this user requesting the front-end service s0 from its own
node c. For the sake of simplicity, we consider that one service makes requests to the other services sequentially. In this case, the response time is the sum of the response time of the others required services seen from the front-end s0. These
others services may also call other services, implying that the objective function to be computed recursively.
f (c, s0) = Rs0(c, P (s0)) +
X
sk∈S
D(s0, sk) × f (P (s0), sk)
The global objective function is the weighted sum of the objective function for each user. Let W (c) be the weight applied to user c:
f (s0) =
X
c∈CW (c)f (c, s0)
In the case of the photo-sharing application the set of services is:
S = {s0, s1, s2, s3, s4}
where s0 is the UI service, s1is the MH service, s2the PH
service used to download a photo, s3 the PH service used to
upload a photo and s4 the TH service.
The dependency function D is built from the call graph of the application, depicted in figure 1 (a):
D(s0, s1) = 1 D(s0, s2) = 1 D(s0, s3) = 1 D(s0, s4) = 1 D(s4, s1) = 1 D(s4, s2) = 1 (1)
These values show that the UI service (s0) calls each of the
other services and the TH service (s4) calls services MH (s1)
and PH (s2).
The objective function for one user can be expressed as: f (c, s0) = Rs0(c, P (s0)) + Rs1(P (s0), P (s1))
+ Rs2(P (s0), P (s2)) + Rs3(P (s0), P (s3))
+ Rs1(P (s4), P (s1)) + Rs2(P (s4), P (s2)) (2)
IV. OPTIMIZING OF THEPERFORMANCE OF THE
APPLICATION
The objective function 2, presented in the previous section, gives the response time of the application for one client located on a given device. The placement Popt(s) that results
in the optimal performance of the application is the one that minimizes the objective function f (s0). Finding Popt(s)
requires finding the values of P (si) ∈ N ; si ∈ S which
minimize the sum in the objective function 2. The number of possible placements is equal to |N ||S|. The complexity of an exhaustive search for the optimal placement Popt(s) is
therefore polynomial in the number of devices and exponential in the number of services.
As this problem is NP-hard, it is necessary to use a heuristic in order to find acceptable solutions in constant or linear time. We found that nature-inspired metaheuristics have shown good
results for the problem of QoS-aware service composition [12], to which our problem can be considered as equivalent. For such problems with a very large solution space, heuristics based on Genetic Algorithms or Ants-colony optimization are indeed particulary efficient as they can find acceptable solution in constant time. We selected Particle Swarm Optimization (PSO) [7] as a candidate for a metaheuristic to be applied to our problem. This algorithm has already been previously used [15] to solve the problem of choosing a composition of services based on QoS parameters.
By applying the PSO metaheuristic, we define a particle location as a placement P (si) ∈ N ; si ∈ S. At the
first iteration, the PSO algorithm initializes a swarm of k particles by randomly selecting their location, i.e., choosing a random placement for the services. The objective function 2 is evaluated for each of these placements and the result is assigned to the corresponding particle as its current score. At each iteration, the PSO algorithm defines a new generation of the swarm where each particle is updated with a new location. The new location for a particle is computed from parameters such as its previous location, its velocity and the minimal score found in the previous iteration. By so doing, the particles will converge at each iteration to the particle with the current minimum score. Other local minima may also be found as new placements are evaluated. The algorithm stops either when all particles have converged to the same minimum score or when it reaches a maximum number of iterations fixed as a parameter of the algorithm.
In order to validate the choice for this heuristic, we tested the PSO algorithm by using as input synthetic values for the response times of the service. We generated these values using a simple model described below. We then compare the score of the placement found by the heuristic to the score of the optimal placement found by exhaustive search. For the heuristic to be considered as valid, the score of the placement found by PSO should be relatively close to the optimal score compared to the score evaluated for others possible placements. We evaluated the scalability of the heuristic by checking if the minimal score found by PSO does not deviate from the optimal solution when the number of devices increases.
We generate the inputs for this test using a simple model for the response times of the service running on the different devices. For one pair (ni, nj), the value of Rs(ni, nj) follows
a Pareto distribution whose parameters depend on the nature of the service s and of the interconnecting network between the devices ni and nj. In order to add some diversity in
these values we use two types of network technology with different QoS parameters: Fiber (high symmetrical bandwidth, low latency) and DSL (low assymetrical bandwidth, high la-tency). Table II gives the parameters of the Pareto distributions (minimum and average value) used to generate the response time Rs(ni, nj) of each service s depending of the type of
network connecting the devices calling the service (ni) and
the device hosting the service (nj). These values have been
deduced from measurements on real deployed services. We choose that 50% of the devices use a DSL network and the
Service s ni nj DSL Fiber MetaHub DSL 50/200 30/100
Fiber 200/800 15/70 PhotoHub DSL 200/800 50/200 (get photo) Fiber 200/800 30/100 PhotoHub DSL 200/800 200/800 put photo) Fiber 50/200 30/100 ThumbHub DSL 150/250 100/150
Fiber 150/250 100/150
TABLE II: Min/Average values for the response times (in ms) for the different services depending on the network used by client ni and server nj
other 50% use a Fiber network.
We initialize the algorithm with the following parameters:
• Number of devices: |N | ∈ {10, 20, 30, . . . , 100}
• Number of clients: |C| = 0.2 ∗ |N |
• Weight applied to clients: W (c) = 1 ∀c • Number of particles: 100
• Maximum number of iterations: 100
In addition to these parameters, we introduce some con-straints on the solution. A first constraint is related to the PhotoHub service that is represented in our model by two virtual services: downloading an existing photo file and up-loading a new photo file. These virtual services are defined in our model as s2 and s3. As these services are offered
by the same microservice, they must be deployed on the same device. The first constraint for the heuristic is therefore P (s2) = P (s3). A second constraint is defined to avoid
trivial solutions where all services are deployed on the same device. Such solutions give good results in our model but are not realistic as the concurrency between the services reduces the performance. To reduce concurrency, all services must be deployed on different devices, except for s3which is colocated
with s2. The second constraint applied to PSO solutions is
P (si) 6= P (sj) ∀i, j ∈ {1, 2, 4}
Based on these inputs, and constraints, the PSO algorithm is able to produce a result which is the placement with the minimal score. It is important to note that several executions of the algorithm with the same parameters and input data may produce different results. It can be explained as the particles may not have converged before the algorithm reaches the maximum number of 100 iterations that we configured. By increasing the number of iterations, the algorithm produces more stable results. However it also increase the execution time. We established that, in our case, 100 iterations is a reasonable compromise for the PSO algorithm to produce consistent results.
We tested the PSO algorithm in different cases by increasing the number of devices from 10 to 100. The execution time of the PSO algorithm was constant as the number of iterations is limited and the evaluation of the objective function does not depend on the number of devices. The execution time
was below 1 second on a 3GHz four-core server. We also performed an exhausive search for the optimal solution by evaluating the score of all possible deployments, in order to find the optimal solution for the test cases.
10 20 30 40 50 60 70 80 90 100 0 2,000 4,000 6,000 8,000 10,000 12,000 14,000 16,000 Number of devices Score
Min. Score (Exhaustive) Score Distribution (PSO) Score Distribution (Exhaustive)
Fig. 2: Results of PSO heuristics compared to exhaustive search.
Figure 2 shows the results of both PSO and exhaustive search algorithms for the different test cases. The score of the optimal solution for each test case found with exhaustive search is marked with a blue dot. The two red horizontal lines delimit the score interval containing 90% of the solu-tions found by 50 different execusolu-tions of the PSO algorithm. The boxes show the distribution (5-percentile, 25-percentile, average, 75-percentile, 95-percentile) of the scores of all the possible placements (found with exhaustive search).
From these results we can conclude that the PSO heuristic is able to find placements for which the performance for the application is very close to the optimal solution found with an exhaustive search. These placements are included in the 5% of the possible placements with the lowest score. Moreover the PSO heuristic is able to find such placement in a maximum of 100 iterations.
The code used for this test is written in Python1 and uses the pyswarm implementation of the PSO algorithm.
V. TEST ANDVALIDATION ON ANEMULATEDNETWORK
The results presented in the previous section are meant only to evaluate the efficacy of the PSO algorithm in our specific use case. The response times of the services Rs(ni, nj) are
static values generated using a simple model. But, in a real-life systems, the response time of a service is a random process that depends on the device hosting the service and the network traffic.
In order to evaluate the impact of such variations on the objective function defined in our model, we use a network emulation platform reproducing the QoS parameters of differ-ent technologies for residdiffer-ential access networks (DSL, Fiber) and the variations of the network performance (jitter, packet loss). By measuring the response time of actual microservices connected to such a network emulator, we can have a realistic evaluation of the performance of the application.
We selected Containernet2 as the network emulation
plate-form for this evaluation. Containernet is a fork of the well-known Mininet network emulator, which can connect Docker containers to the emulated network. This platform allows its users to define the QoS parameters such as the bandwidth, latency, jitter and packet loss ratio, for each emulated network.
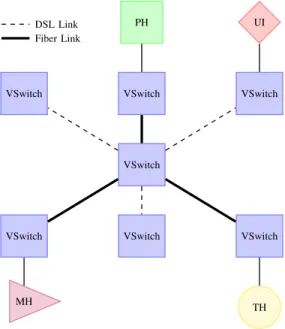
VSwitch VSwitch VSwitch VSwitch VSwitch VSwitch VSwitch UI PH TH MH DSL Link Fiber Link
Fig. 3: Example of a topology used in the network emulator for evaluating a deployment of microservices over devices on user-premise.
Containernet allows us to define network topologies emu-lating devices on user-premise interconnected with different network technologies. An example of such topology is shown in Figure 3. The network connection of each user-provided device is emulated by a virtual switch. When a microservice is to be located on a particular device, the container embed-ding the actual implementation of the service is connected to the corresponding virtual switch. Each virtual switch is then attached to a central switch with a link emulating the residential access network. This link is configured with the QoS parameters of the network technology (DSL or Fiber) chosen for the device. The QoS parameters defined for each type of link are listed in Table III
Using this platform for network emulation, we are able to define different test cases by specifying the number of devices and the access network technology for each device.
2Containernet website: https://containernet.github.io/
Technology Uplink BW Downlink BW Latency Fiber 100Mb/s 100Mb/s 5ms DSL 2Mb/s 20Mb/s 25ms
TABLE III: QoS parameters for emulation of residential access networks.
Once the topology is defined, the resulting emulated network interconnects containers running the actual implementation of the microservices of the photo sharing application. With all the needed microservices deployed, it is possible to measure the performance of the application in realistic conditions. We performed these measurements by generating independent requests to the application from each client and measuring the time needed by the application to provide a response.
For the PSO heuristic to find optimal placements of the microservices, we need the values for Rs(ni, nj); ni, nj ∈
N ; s ∈ S used by the objective function to evaluate a place-ment. Two methods can be applied to bootstrap these values. It is possible to measure them exhaustively by deploying the service on each device and measuring its response time from the other devices. This process is cumbersome and can be relatively expensive when the number of devices is important. Another solution is to estimate the value for the response time based on the QoS parameters given to the platform. We first made sample measurements of the response time of the service on different devices. Then we infered the response time for the other devices by linear regression on the bandwidth and latency parameters.
In addition to the values for Rs(ni, nj) inferred using the
method described above, we defined the following parameters for the PSO algorithm:
• Number of devices: |N | = 50
• Number of clients: |C| = 10
• Weight applied to clients: W (c) = 1 ∀c
• Number of particles: 100
• Maximum number of iterations: 100
• Constraints: P (s2) = P (s3); P (si) 6= P (sj) ∀i, j ∈
{1, 2, 4}
Configured with these parameters, the PSO heuristic is able to produce a placement for the microservices of the photo-sharing application. The containers embedding these services are deployed on the virtual devices specified by the placement. The real performance of the application is then measured from the clients as the sum of the response times of the calls to the application.
To evaluate the stability of the system, we introduce some variations on the performance of the network by adding a jitter parameter. In wide-area network the measured transmission delay for a packet shows variations as the packet is forwarded in the network among many other packets. In order to produce variations in the transmission delay, the network emulator uses the well-known netem3 module. The delay variation (or
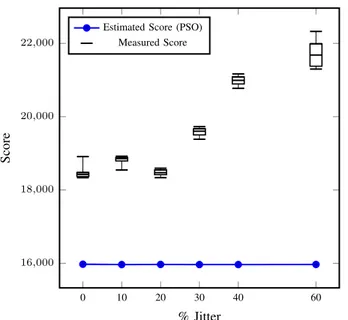
0 10 20 30 40 60 16,000 18,000 20,000 22,000 % Jitter Score
Estimated Score (PSO) Measured Score
Fig. 4: PSO score compared to measured performance on a emulated network with different jitter values.
jitter) is defined in netem by providing the interval for the possible values of the transmission delay. As the link in the emulator have different latency values, we define the jitter as a percentage of the nominal latency for the link. The value for the delay applied to a packet on a link is a random value uniformly distributed between (1 − jitter) × latency and (1 + jitter) × latency.
We evaluated the solution found by PSO algorithm on a single test case (same topology, same devices used as clients) with jitter increasing from 0% to 40% of the nominal latency for the link. The performance of the application is measured by the clients requesting the different services of the appli-cation 10 times each. The values of the optimal performance estimated by PSO and the global performance measured by all clients are shown in Figure 4. These measurements show that for a jitter below 20% of the nominal latency of the link, the performance measured for the application is stable at approximatively 15% of the optimal performance. For jitter above 20%, the measured response times increase and deviate from the optimal performance.
We can conclude from this measurement that the perfor-mance of the photo sharing application, as defined in our model, is not impacted by the fluctuation of the network. With a jitter below 20% of the nominal latency, the measured performance of the application stays in the same interval of 15% of the optimal performance estimated by PSO. In such conditions, we can be confident that the PSO heuristic is able to find an acceptable service placement.
VI. RELATEDWORK
The contribution of this article is connected to various areas of research which have studied performance optimization for application distributed on edge devices.
Volunteer computing and Grid computing are well estab-lished areas of research with many contributions. Some of them are focused on performance considerations [3], [9]. In such a context, the performance is measured as task through-put. Job scheduling strategies are defined by considering resource availability and reliability. These papers proposed to optimize the throughput of the application by reducing the idle time at the device level. The optimization target is different in our case as we are focused on application responsiveness.
In a service-oriented approach, a distributed application can be considered as a composition of service executing a workflow. Choosing a service composition that optimizes the global QoS of the workflow is a problem considered by many contributions listed in [1]. Some proposed solutions to this problem are based on Linear or Mixed Integer Program-ming [20], [2]. Other heuristics to this problem have been proposed such as Genetic Algorithms [14] or Particle Swarm Optimization [15]. The problem of service composition and workflow scheduling is however slightly different from our problem. In such case the services locations are given as input to the scheduling strategy that should decide which service instance to use in the workflow. In our case, the services can be located on any device, increasing the complexity of the problem.
The placement of services considering devices with hetero-geneous CPU and network capabilities also has been studied in various articles. In [10] the placement is considered in the case of servers connected by an overlay network over a wide area network whereas in [18] the servers are located in different public clouds. Each article proposes a heuristic to find an optimal placement by using a fine-grain model of the performance considering the network QoS parameters and the CPU resources. In [17] the authors present the use case of hosting the service in edge micro-clouds. This article proposes as a heuristic to select in the model the significant parameters according to the requirement of the services (e.g., bandwidth demanding or latency sensitive services). In our approach we adopt a higher level model by the use of the response time as the single metric for the evaluation of the performance.
Fog computing [19] is an emerging area of research that focuses on task migration from the cloud to the edge. In [5], the use case of deploying a game service on edge servers to optimize the player latency is presented. These edge servers are selected in a decentralized way using a distributed voting protocol. This approach is interesting as our centralized ap-proach may have some limitations if the number of devices participating in the system increases. Our problem is yet more complex as we consider the placement of inter-dependent services, while the game service is standalone.
VII. CONCLUSION ANDFUTURE WORKS
In this article, we have considered the use case of running an application, comprised of several microservices, on a col-lection of user-provided devices, interconnected by a wide area network. The application response time is a key element for the QoE of it users. Given that placing each microservice
instance in order to minimize the total application response time is an NP-hard problem, we have used the PSO algorithm to find a solution. We have first shown, using simulations, that this algorithm gives satisfactory results in constant time. In order to show that such a solution is applicable in a real network, we evaluated the performance of the application on an emulated network, whose parameters represent different type of Internet connections (FTTH and DSL). When deployed according to the result of the PSO algorithm, the performance of the application is stable for reasonable jitter values. We conclude that even if the PSO heuristic use static values for the response times of the services, the selected placement still results in acceptable performance for the application even if the network QoS is fluctuating.
In addition to the response time of the services, the client behavior is another key parameter to our model for the performance evaluation of the application. In this work, we assumed that all the users are using the application with equal probability, and that each client makes the same number of requests. Some parameters of the model should be adjusted to better capture the average behavior of the client. It is important to evaluate how fluctuations in the request distribution impact the performance of the application. The network emulation platform can be used to emulate concurrent requests from different clients to the services. As our model considers an unloaded system, it should be extended to avoid concurrency. One solution is to define for the same service multiple instances that share the load of processing the incoming requests. The placement should then decide where the different instances should be located.
REFERENCES
[1] Ehab Nabiel Alkhanak, Sai Peck Lee, and Saif Ur Rehman Khan. Cost-aware challenges for workflow scheduling approaches in cloud computing environments: Taxonomy and opportunities. 50:3–21. [2] Mohammad Alrifai and Thomas Risse. Combining Global Optimization
with Local Selection for Efficient QoS-aware Service Composition. In Proceedings of the 18th International Conference on World Wide Web, WWW ’09, pages 881–890. ACM.
[3] D. P. Anderson and G. Fedak. The Computational and Storage Potential of Volunteer Computing. In Sixth IEEE International Symposium on Cluster Computing and the Grid, 2006. CCGRID 06, volume 1, pages 73–80.
[4] Abhishek Chandra and Jon B. Weissman. Nebulas: Using Distributed Voluntary Resources to Build Clouds. In HotCloud.
[5] Sharon Choy, Bernard Wong, Gwendal Simon, and Catherine Rosen-berg. A hybrid edge-cloud architecture for reducing on-demand gaming latency. 20(5):503–519.
[6] V. D. Cunsolo, S. Distefano, A. Puliafito, and M. Scarpa. Volunteer Computing and Desktop Cloud: The Cloud@Home Paradigm. In 2009 Eighth IEEE International Symposium on Network Computing and Applications, pages 134–139.
[7] R. Eberhart and J. Kennedy. A new optimizer using particle swarm theory. In , Proceedings of the Sixth International Symposium on Micro Machine and Human Science, 1995. MHS ’95, pages 39–43.
[8] S. Egger, P. Reichl, T. Hofeld, and R. Schatz. Time is bandwidth ? Narrowing the gap between subjective time perception and Quality of Experience. In 2012 IEEE International Conference on Communications (ICC), pages 1325–1330.
[9] A. Essafi, D. Trystram, and Z. Zaidi. An Efficient Algorithm for Scheduling Jobs in Volunteer Computing Platforms. In Parallel Dis-tributed Processing Symposium Workshops (IPDPSW), 2014 IEEE In-ternational, pages 68–76.
[10] Jeroen Famaey, Tim Wauters, Filip De Turck, Bart Dhoedt, and Piet Demeester. Network-aware service placement and selection algorithms on large-scale overlay networks. 34(15):1777–1787.
[11] Martin Fowler and James Lewis. Microservices.
[12] C. Jatoth, G. R. Gangadharan, and R. Buyya. Computational Intelligence based QoS-aware Web Service Composition: A Systematic Literature Review. PP(99):1–1.
[13] Amin M. Khan, Mennan Selimi, and Felix Freitag. Towards Distributed Architecture for Collaborative Cloud Services in Community Networks. In 6th International Conference on Intelligent Networking and Collab-orative Systems (INCoS14). Salerno, Italy: IEEE.
[14] A. Klein, F. Ishikawa, and S. Honiden. SanGA: A Self-Adaptive Network-Aware Approach to Service Composition. 7(3):452–464. [15] Wenfeng Li, Ye Zhong, Xun Wang, and Yulian Cao. Resource
virtual-ization and service selection in cloud logistics. 36(6):1696–1704. [16] Takayuki Nishio, Ryoichi Shinkuma, Tatsuro Takahashi, and Narayan B.
Mandayam. Service-oriented Heterogeneous Resource Sharing for Optimizing Service Latency in Mobile Cloud. In Proceedings of the First International Workshop on Mobile Cloud Computing & Networking, MobileCloud ’13, pages 19–26. ACM.
[17] Mennan Selimi, Davide Vega, Felix Freitag, and Lus Veiga. Towards Network-Aware Service Placement in Community Network Micro-Clouds. In Euro-Par 2016: Parallel Processing, pages 376–388. Springer, Cham.
[18] Moritz Steiner, Bob Gaglianello Gaglianello, Vijay Gurbani, Volker Hilt, W.D. Roome, Michael Scharf, and Thomas Voith. Network-aware Service Placement in a Distributed Cloud Environment. 42(4):73–74. [19] Luis M. Vaquero and Luis Rodero-Merino. Finding your way in the fog:
Towards a comprehensive definition of fog computing. 44(5):27–32. [20] Chen Wang. A QoS-Aware Middleware for Dynamic and Adaptive