HAL Id: hal-01588290
https://hal.archives-ouvertes.fr/hal-01588290
Submitted on 18 Sep 2017
HAL is a multi-disciplinary open access archive for the deposit and dissemination of sci-entific research documents, whether they are pub-lished or not. The documents may come from teaching and research institutions in France or abroad, or from public or private research centers.
L’archive ouverte pluridisciplinaire HAL, est destinée au dépôt et à la diffusion de documents scientifiques de niveau recherche, publiés ou non, émanant des établissements d’enseignement et de recherche français ou étrangers, des laboratoires publics ou privés.
CLASSIFICATION OF VHR REMOTE SENSING
IMAGES USING LOCAL FEATURE-BASED
ATTRIBUTE PROFILES
Minh-Tan Pham, Sébastien Lefèvre, Erchan Aptoula, Bharath Bhushan
Damodaran
To cite this version:
Minh-Tan Pham, Sébastien Lefèvre, Erchan Aptoula, Bharath Bhushan Damodaran. CLASSIFICA-TION OF VHR REMOTE SENSING IMAGES USING LOCAL FEATURE-BASED ATTRIBUTE PROFILES. IGARSS 2017, Jul 2017, Fort Worth, United States. �hal-01588290�
CLASSIFICATION OF VHR REMOTE SENSING IMAGES USING LOCAL FEATURE-BASED ATTRIBUTE PROFILES
Minh-Tan Pham1, S´ebastien Lef`evre1, Erchan Aptoula2, Bharath Bhushan Damodaran1
1IRISA - Universit´e Bretagne-Sud, UMR 6074, 56000 Vannes, France
2 Institute of Information Technologies - Gebze Technical University, 41400, Kocaeli, Turkey
ABSTRACT
The present paper introduces an extension of attribute profiles (APs) by extracting their local features. The so-called local feature-based attribute profiles (LFAPs) are expected to provide a better characterization of each APs’ filtered pixel (i.e. APs’ sample) within its neigh-borhood, hence better deal with local texture informa-tion from the image’s content. In this work, LFAP is constructed by extracting some simple first-order statis-tical features of the local patch around each APs’ sample such as mean, standard deviation, range, etc. Then, the final feature vector characterizing each image pixel is formed by combining all local features extracted from APs of that pixel. In order to evaluate the effectiveness of the proposed technique, supervised classification us-ing Random Forest classifier is performed on the VHR panchromatic Reykjavik image. Experimental results show that LFAPs can considerably improve the classi-fication accuracy of the standard APs and the recently proposed histogram-based APs.
Index Terms— Remote sensing, very high resolu-tion (VHR) images, supervised classificaresolu-tion, attribute profiles (APs), local feature-based attribute profiles (LFAPs)
1. INTRODUCTION
Morphological attribute profiles (APs) [1] have been widely used to incorporate spectral and spatial infor-mation for remote sensing image classification. In the
This work was supported by the French Agence Nationale de la Recherche (ANR) under the reference ANR-13-JS02-0005-01 (As-terix project) and the R´egion Bretagne grant. It was also supported by the BAGEP Award of the Science Academy and by the Tubitak Grant 115E857.
past few years, a great number of studies have been con-tributed to exploit and extend the use of APs, especially for classification of optical images. A recent survey of APs and some of their extensions can be found in [2]. In fact, APs provide a multi-level image representation obtained by the sequential application of different filter rules (i.e. attributes) characterizing the size and shape of objects present in the image [1]. By well preserving important spatial properties of regions such as contours, shape, etc. within images, APs become relevant and effective for classification task, in particular for remote sensing images.
Since the direct exploitation of APs for VHR image classification may be insufficient for a complete charac-terization of textural information, the histogram-based APs (HAPs) have been recently introduced in [3] for an improvement. HAPs are built by concatenating the lo-cal histograms of attribute filter responses of each pixel. They have been proved to be more efficient and better deal with local textures in VHR images [3]. However, two limitations of HAPs can be observed involving their very high dimensionality and their high sensitivity to the number of histogram’s bins. Therefore in this paper, in-stead of constructing local histograms, our motivation is to exploit certain statistical features to characterize the local neighborhood around each pixel’s attributes. Similar to HAPs, the proposed local feature-based APs (LFAPs) can firstly provide a better description of local textures in VHR images than the standard APs. Then, by using some simple first-order local features, LFAPs can overcome the two aforementioned drawbacks of HAPs. Furthermore, the construction of LFAPs is not limited to the use of first-order statistical features, one can take into consideration other kinds of local features to tackle more complex VHR image scenes.
The remainder of this paper is organized as follows. The proposed LFAP technique is described in Section 2. In Section 3, supervised classification results of the Reykjavik image yielded by the proposed method and some reference approaches are evaluated and compared in terms of both classification accuracy and time con-sumption. Section 4 finally concludes the paper and dis-cusses some further work.
2. METHODOLOGY
The generation of LFAPs for an image can be divided by two stages. First, the standard APs are built from the image. Then, for each APs’ filtered pixel, statistical fea-tures of its local neighborhood such as mean, standard deviation, range, etc. are extracted and stacked to form the final LFAP descriptor. We now describe each stage in details.
2.1. Generation of APs
Let X = {xi}Ni=1be a grayscale image consisting of N
pixels. The generation of APs on X is achieved by ap-plying a sequence of attribute thickening {φλ`}L
`=1 and
thinning {γλ`}L
`=1operations as follows:
AP(X) =nXφλL, . . . , Xφλ1, X, Xγλ1, . . . , XγλLo (1) where Xφλ` = nxφ1λ`, xφ2λ`, . . . , xφNλ`o is the filtered image obtained by applying the attribute thickening φλ with regard to the threshold λ`. Similar explanation is
made for Xγλ`. For more details about this AP compu-tation, readers are referred to papers [1, 2].
It should be noted that for each pixel xi ∈ X, i =
1, . . . , N , the following feature vector can be considered as its AP descriptor which has been commonly used for classification task: AP(xi) = n xφiλL, . . . , xφiλ1, xi, xγ λ1 i , . . . , x γλL i o . (2) 2.2. Construction of LFAPs
Due to the increase in spatial resolution, the appearance of geometrical and textural information in VHR remote sensing images becomes more and more significant. Hence, classification task should take more into account textural features when dealing with VHR image data.
It should be noted that textures are generally not de-rived from a single image pixel, but from a local neigh-borhood around it. That is the reason why the direct application of AP feature vector in Eq. (2) for classi-fication may be not sufficient to account for textures in VHR images. To this end, replacing the standard AP’s filtered pixel by the statistical features extracted from its local neighborhood appear to be a good strategy to re-solve this issue.
Local feature extraction has been one of the main approaches for texture analysis for decades [4]. First-order, second-order or higher order statistical features extracted from the local patch can describe the rough-ness, regularity, homogeneity, contrast, etc. of the re-lated texture [4]. An important remark is that AP images mostly consist of homogeneous (flat) regions. Hence, only first-order local features such as mean, range, vari-ance or standard deviation can be sufficient to model tex-ture information. That is why we recommend to exploit only first-order features to construct LFAPs. Particularly in this work, we propose to use the mean and the range thanks to their fast computation and good representation of smooth textures.
We define the LFAP feature vector for each pixel xi ∈ X as follows:
LFAP(xi) = {LFAPµ(xi), LFAPr(xi)} , (3)
in which LFAPµ(xi) = n µ(xφiλL), . . . , µ(xφiλ1), µ(xi), µ(xγiλ1), . . . , µ(xγiλL) o (4) LFAPr(xi) = n r(xφiλL), . . . , r(xφiλ1), r(xi), r(xγiλ1), . . . , r(xγiλL) o (5)
where µ(xi) and r(xi) are the mean and range values
extracted from the local patch P (xi) of size w × w from
the image X: µ(xi) = 1 w2 X xj∈P (xi) xj, r(xi) = max(P (xi)) − min(P (xi)).
We note that similar calculations are done to extract the mean and range values from every other APs’ filtered image (i.e. every Xφλ`, Xγλ`, ` = 1, . . . , L).
It should be remarked that the histogram-based at-tribute profiles (HAPs) proposed in [3] can be consid-ered as a specific case of LFAPs when local histogram
features are extracted to construct the descriptor: HAP(xi) = LFAPh(xi) =nh(xφiλL), . . . , h(xφiλ1), h(xi), h(xγiλ1), . . . , h(xγiλL) o (6)
where h(xi) is the local histogram constructed from the
local patch P (xi) from X.
The extraction of local histogram requires another parameter: the number of bins (namely nb). Hence, unlike the case of mean and range features which are scalar values, each h(xi) is a vector of nb features,
which makes the HAPs become very high dimensional. Moreover, their high sensitivity to nb is another draw-back of this approach. We observe how the proposed LFAPs outperform the standard APs as well as the HAPs during our experimental study in the next section.
3. EXPERIMENTAL STUDY
3.1. Data description and experimental setup Our experiments were conducted on the VHR panchro-matic image of Reykjavik, Iceland, acquired by the IKONOS Earth imaging satellite with a spatial resolu-tion of 1 meter. The image size is 976 × 640 pixels. A thematic ground-truth of six classes is available for clas-sification evaluation. The image and its ground-truth are shown in Figs. 1(a) and (b). It is worth noting that a pansharpened multispectral (MS) image is also avail-able for this scene. However, in this paper, we would like to demonstrate the effectiveness of the proposed ap-proach by only exploiting the panchromatic image. MS bands can be also used as complementary information to improve classification performance in further work.
Supervised classification results of the proposed LFAPs will be evaluated and compared to those yielded by the standard APs and the HAPs. To construct the APs, three common attributes were considered includ-ing the area, the standard deviation and the moment of inertia. The threshold values were set to be similar to previous studies on the same data [5]. For classification stage, the Random Forest was employed by setting the number of trees equal to 200. We randomly selected 1% of each class for training and the rest for testing. Then, another experiment scenario was conducted using 10% of training samples. All experiments were run 10 times to report the mean and standard deviation of
classifica-tion results, in terms of overall accuracy (OA), average accuracy (AA) and Kappa coefficient.
3.2. Results
Fig. 1 and Tab. 1 show the classification performance of the proposed LFAPs compared to the pixel intensity-based approach (PAN), APs and HAPs. For LFAPs and HAPs, the local patch size was set to 7 × 7. HAPs were also tested with different number of bins.
(a) Panchromatic image
(b) Ground truth (c) PAN (OA = 52.62%) (d) AP (OA = 91.68%) (e) HAP (nb=9) (OA = 95.83%) (f) LFAP (OA = 97.18%)
Fig. 1: Classification results of the Reykjavik image obtained by different methods (10% training samples)
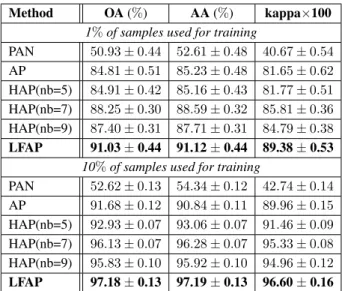
From the figure, classification result yielded by APs (Fig. 1(d)) still contains some noise which is mostly reduced from the results of HAPs and LFAPs (Figs. 1(e) and 1(f)). The use of local patch’s features instead of single APs’ sample helps to provide smoother results. For quantitative evaluation, Tab. 1 shows that the highest OA has been achieved by the proposed LFAP method (i.e. 91.03% and 97.18% in case of using 1% and 10% of training samples, respectively). Our technique has improved more than 6% of OA from the standard APs. Then, compared to HAPs, a superiority of 2.78% and 1.05% in OA is provided by LFAPs. We also remark that the performance of HAPs is quite sensitive to nb (i.e.
OA is low with nb = 5, considerably increased when nb = 7 but then decreased when nb = 9). Readers can also observe this behavior from the experimental study of paper [3] .
Method OA (%) AA (%) kappa×100 1% of samples used for training
PAN 50.93 ± 0.44 52.61 ± 0.48 40.67 ± 0.54 AP 84.81 ± 0.51 85.23 ± 0.48 81.65 ± 0.62 HAP(nb=5) 84.91 ± 0.42 85.16 ± 0.43 81.77 ± 0.51 HAP(nb=7) 88.25 ± 0.30 88.59 ± 0.32 85.81 ± 0.36 HAP(nb=9) 87.40 ± 0.31 87.71 ± 0.31 84.79 ± 0.38 LFAP 91.03 ± 0.44 91.12 ± 0.44 89.38 ± 0.53
10% of samples used for training
PAN 52.62 ± 0.13 54.34 ± 0.12 42.74 ± 0.14 AP 91.68 ± 0.12 90.84 ± 0.11 89.96 ± 0.15 HAP(nb=5) 92.93 ± 0.07 93.06 ± 0.07 91.46 ± 0.09 HAP(nb=7) 96.13 ± 0.07 96.28 ± 0.07 95.33 ± 0.08 HAP(nb=9) 95.83 ± 0.10 95.92 ± 0.10 94.96 ± 0.12 LFAP 97.18 ± 0.13 97.19 ± 0.13 96.60 ± 0.16
Table 1: Classification accuracy of Reykjavik data obtained by different methods
We now observe in Tab. 2 the dimensionality of AP, LFAP and HAP descriptors and the calculation time for their extraction as well as for classification stage (implementation on Matlab using a PC 3.4GHz, 16GB RAM). Since the mean and range features are used to form LFAP descriptor, its extraction time is quite low. Then, its dimension is twice of that of APs. Meanwhile, the length of HAP vector involves a multiplication fac-tor of nb and becomes very huge when a high value of nb is set. This issue leads to a major limitation of HAPs in terms of high storage requirement as well as high computational cost for classification phase.
Method Feature extraction Classification Dimension Time Training Testing AP 63 46.9s 38.7s 3.2s LFAP 126 1m 35.6s 1m 25.3s 3.9s HAP(nb=5) 315 3m 57.5s 3m 38.1s 6.3s HAP(nb=7) 441 4m 01.2s 4m 52.3s 7.0s HAP(nb=9) 567 4m 07.1s 6m 20.4s 7.8s
Table 2: Comparison of feature dimension and calculation time of AP, LFAP and HAP methods (10% training samples)
4. CONCLUSION
The local feature-based attribute profiles (LFAPs) have been proposed to improve the classification performance of VHR remote sensing images. For better dealing with spatial and texture information, statistical features of local patch are extracted to replace each APs’ filtered pixel. In this work, two simple first-order features in-cluding the mean and range have been exploited and proved to be relevant for characterizing smooth textures from AP filtered images. Our experimental study has shown superior performance of LFAPs compared the standard APs and the histogram-based approach.
The construction of LFAPs is not limited to the use of mean and range features. Any other local features can be extracted to tackle more complex VHR image scenes in future work. Also, the concept of LFAPs can be ap-plied to the extended APs [6] for hyperspectral image classification as well as to the recently proposed self-dual APs [5] which has been proved to outperform APs.
5. ACKNOWLEDGEMENT
The authors would like to thank Prof. Jon Atli Benediktsson for providing the Reykjavik image and Dr. Mauro Dalla Mura for providing the Matlab code of APs.
6. REFERENCES
[1] M. Dalla Mura, J. A. Benediktsson, N. Waske, and L. Bruzzone, “Morphological attribute profiles for the analysis of very high resolution images,” IEEE Trans. Geosci. Remote Sens., vol. 48, no. 10, pp. 3747–3762, 2010.
[2] P. Ghamisi, M. Dalla Mura, and J. A. Benediktsson, “A survey on spectral–spatial classification techniques based on attribute profiles,” IEEE Trans. Geosci. Remote Sens., vol. 53, no. 5, pp. 2335–2353, 2015.
[3] B. Demir and L. Bruzzone, “Histogram-based attribute pro-files for classification of very high resolution remote sensing images,” IEEE Trans. Geosci. Remote Sens., vol. 54, no. 4, pp. 2096–2107, 2016.
[4] A. Materka et al., “Texture analysis methods–A review,” Techni-cal university of lodz, institute of electronics, COST B11 report, Brussels, pp. 9–11, 1998.
[5] G. Cavallaro, M. Dalla Mura, J. A.Benediktsson, and A. Plaza, “Remote sensing image classification using attribute filters de-fined over the tree of shapes,” IEEE Trans. Geosci. Remote Sens., vol. 54, no. 7, pp. 3899–3911, 2016.
[6] M. Dalla Mura, J. A. Benediktsson, B. Waske, and L. Bruzzone, “Extended profiles with morphological attribute filters for the analysis of hyperspectral data,” Int. J. Remote Sens., vol. 31, no. 22, pp. 5975–5991, 2010.