The Influence Of β-pbo2 On Pzt Phase Formation
9
0
0
Texte intégral
(2) H. Allal et al.. J. Fundam Appl Sci. 2013, 5(2), 183-191. 184. One of the important aims of the technological development of the piezoelectric PZT-type ceramic is the reduction of the formation temperature in order to reduce the energy supplied and processing time. The reaction sequences for the formation of PZT solid solution through solid state reaction are now well known [4-8]. However, several intermediate phases have been reported and different temperatures of formation. This diversity as a function of processing. temperature. depends. on. several. parameters.. As. an. example,. S.. VANKATARAMANI et al [7] have shown the significant influence of the particle size of zirconium oxide on the formation of PbZrO3 as an intermediate stage. Previous work of Kumar [9] reported the formation of PZT by Sol-Gel method, leading to smaller particle size with lower temperature of formation. By comparison, solid state processing appears easier to implement. However, liquid processing also allows the control of the stoichiometric coefficients, and provides precursors finely divided and more reactive than the starting materials used in solid route. This paper reports the improvement of the solid state synthesis using β-PbO2 as a starting material in place of commercial PbO. It was expected that this oxide could be more reactive.. 2. EXPERIMENTAL The Pb (Zr0.485, Ti0, 515) O3 PZT was synthesized by solid state reaction, near the morphotropic phase boundary (FMP) which separates phases of tetragonal and trigonal symmetry. Reagent grade chemicals (minimum 99%) were used: lead oxide β-PbO2, zirconium oxide ZrO2 and titanium oxide TiO2. Corresponding JCPDS files are 85-1222,. 07-0343 and 04-0477. respectively. Two other compounds, PbZrO3 and PbTiO3, were synthesized in the laboratory using the same starting materials (ZrO2, β-PbO2, TiO2) and the same method. These two compounds are the most likely intermediates in the formation of PZT by the procedures described in the literature, as shown schematically in Figure1..
(3) H. Allal et al.. J. Fundam Appl Sci. 2013, 5(2), 183-191. 185. Fig.1. Flow chart used for PZT powder preparation. A small part of powder mixture (5% of the powder synthesized) was kept for thermal analysis including thermogravimetry (TGA) coupled to differential thermal analysis (DTA). The rest of the powder obtained (95%) was dried and pressed (solid axial 225 MPa) and then calcined at the temperature deduced from thermal analysis. Calcination was implemented for 2 h in a small crucible of alumina, with a heating rate of 5 K/min. Samples obtained at different temperatures were later examined by x-ray diffraction (XRD) and infrared spectroscopy (IR). The phase formation of PZT and intermediate reactions. Phases resulting from the decomposition of the precursors were analyzed by x-ray diffraction (XRD) (D8-Advanced, Bruker-Siemens, Cu Kα radiation). Sample composition was assessed by reference to JCPDS files (β-PbO2, ZrO2, TiO2, PbTiO3, PbZrO3) or deduced from experimental values of diffraction angles 2θ in the case of the different solid solutions. Thermal analysis (DTA/TGA) was conducted with pure Al2O3 as reference material. The data curves for the composition 0.485 PbZrO3-0.515PbTiO3 were obtained from 25 to 1100°C with a heating rate of 5 K/min. The Infrared absorption spectrum was recorded on a FTIR spectrometer (SHIMADZU FTIR 8000) using KBr pellets.. 3. RESULTS AND DISCUSSION PZT formation and intermediate reactions (decomposition, oxidation, transformation) were followed by TG/DTA thermal analysis (Fig. 2.)..
(4) H. Allal et al.. J. Fundam Appl Sci. 2013, 5(2), 183-191. 186. 12. 10,2. 10,4. 11. TG (%). DTA (J). 10,6. 10,8. 11,0 DTA. 11,2. 10. TGA. 11,4. Exo. 5°c/min. 200. 400. 600. 9. 800. Temperature (°C). Fig.2. DTA and TG curves of Pb (Zr0,485-Ti0,515) O3 samples, at room atmosphere (heating rate: 5 K/min). There are six steps: The first step corresponds to a loss of 3% in mass accompanied by an endothermic peak around 59 °C, that is characteristic of the sample dehydration (release of bound water and adsorbed on the surface).. The second step between 80 °C and 400 °C presented by a broad exothermic peak associated with low mass loss is an allotropic transformation (phase change) of lead dioxide by the following reaction: β-PbO2. PbO2 (HP). This was verified by XRD of the β-PbO2 calcined at 350°C, following the same thermal processing used for the powder mixture (Fig. 3.).. PbO2 at 350°C. 600. Int (a.u.). 500 400 300 200 100 0 10. 20. 30. 40. 50. 60. 70. 80. PbO2 at 25°C ; (-PbO2). 1800. Int (a.u.). 1500 1200 900 600 300 0 10. 20. 30. 40. 50. 60. 70. 2 (degrees). Fig.3. XRD patterns of PbO2 at room temperature and after calcination at 350°C.. 80.
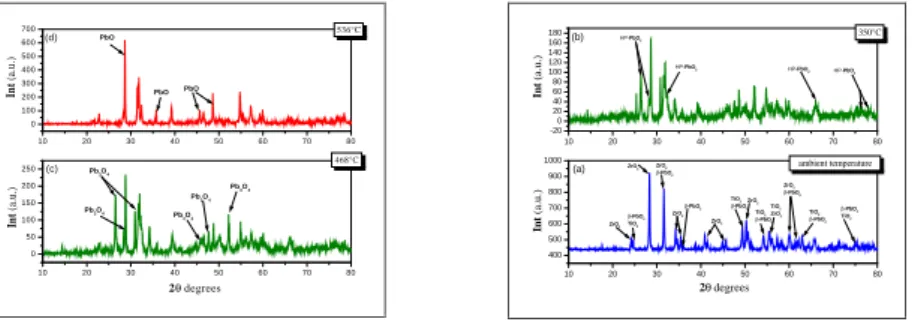
(5) H. Allal et al.. J. Fundam Appl Sci. 2013, 5(2), 183-191. 187. The diffraction patterns of X-ray β-PbO2 at room temperature and calcined at 350°C, justified by their file ICSD (Inorganic Crystal Structure Data Base) n o = 77648 gave the bass find (Crystallographica DLL: Dynamic Link library-version 2.0.1.4 -2004). The third step is evidenced by a very important DTA endotherm at 465 °C, which can be attributed to the first decomposition of PbO2 (HP) to Pb3O4 with heat generation according to the following reaction: 3 PbO2 (HP). Pb3O4 + O2 + Q. The next step corresponds to the second decomposition, Pb3O4 to PbO, which corresponds to an endothermic peak at 541°C [7]. Pb3O4. 3 PbO + ½ O2 + Q. This double decomposition also appears on the thermogravimetric curve, two weight losses 5% and 6% are observed at 465°C and 541°C respectively. To confirm that this double loss is due only to the decomposition of β-PbO2 we have analyzed lead dioxide by TG/ATG (Fig. 4.).. PbO2. Weight loss (%). Powder Mixture. 400. 500. Temperature (°C). 600. 400. 500. 600. Temperature (°C). Fig.4. Thermogravimetric analysis of the as-prepared samples: β-PbO2 (a), Powder mixture (b). Similarly, XRD measurements lead to the following conclusions: Between 25°C and 400 °C, we observed the total disappearance of the characteristic peaks of tetragonal β-PbO2 and the emergence of the cubic HP-PbO2 [8] as shown in Fig. 5. (b)..
(6) H. Allal et al.. J. Fundam Appl Sci. 2013, 5(2), 183-191. 188. Between 400 °C and 536 °C the characteristic lines of Pb3O4 appears in the XRD pattern (Figs. 5 (b and c)). The XRD diagram of the mixture calcined at 536 °C (Fig. 5 (d)) shows the characteristic lines corresponding to the formation of nascent PbO, including the peak centered at 35.74°. JSPDS files allowed us to identify these characteristic peaks. 700. 536°C. (d). PbO. 500. Int (a.u.). Int (a.u.). 600. 400 300. PbO. PbO. 200 100 0 10. 20. 30. 40. 50. 60. 70. 80. HP-PbO2. Pb3O 4 Pb3O 4. 150 Pb3O 4. Pb3O 4. 100. 20. 50. 30. HP-PbO2. 40. 50. -PbO2. 700 ZrO2. ZrO2. -PbO2 TiO2. HP-PbO2. 70. 80. ambient temperature. 800. 600. 60. ZrO2 -PbO2. ZrO2. (a). 900. 200. 350°C. HP-PbO2. 1000. Pb3O 4. Int (a.u.). Int (a.u.). (c). (b). 10. 468°C 250. 180 160 140 120 100 80 60 40 20 0 -20. ZrO2. TiO2 ZrO 2 -PbO2 TiO2 TiO2 ZrO 2 -PbO2. ZrO2 -PbO2 -PbO2 TiO2. TiO2 -PbO2. 500. 0. 400 10. 20. 30. 40. 50. 60. 70. 80. 10. 20. 30. 40. 50. 60. 70. 80. 2 degrees. 2 degrees. Fig. 5. X-ray diffraction patterns of powder mixture at the room temperature (a); and calcined at: 350°C (b), 468°C(c) and 536°C (d).. The fifth stage starts from 562 °C. It is characterized by a broad and intense exothermic peak associated with a decrease in the slope of the TG curve.. The greater reactivities of TiO2 compared to that of ZrO2 and that of lead oxide obtained from the decomposition of Pb3O4 certainly promotes the formation of PbTiO3 (Fig. 6.). 5 7 0 °C P b T iO 3. 2500. 2000. In t (a.u.). PbO. Z rO 2. P b T iO 3. 1500. P b T iO 3. 1000. Z rO 2. PbO PbO. P b T iO 3. Z rO 2. 500. PbO. P b T iO 3 Z rO 2. 0 10. 20. 30. 40. 50. 60. 2 d eg rees. Fig.6. X-ray diffraction patterns of standard reactants calcined at 570 °C.. At higher temperature, solid solutions of lead titanate (PbTiO3)ss are formed, probably resulting from the inter-granular contact between PbTiO3-PbO, and ZrO2-PbTiO3. A small amount of unreacted PbO and zirconia is likely to diffuse in the PbTiO3 perovskite structure. This assumption is justified by the variation of the linear parameters of the tetragonal PbTiO 3 as a function of temperature (Table 1), which are calculated from the interreticular distances (d100, d001) that corresponds respectively to aT and cT..
(7) H. Allal et al.. J. Fundam Appl Sci. 2013, 5(2), 183-191. 189. Table 1. Lattice parameters (X-ray diffraction data) as a function of temperature Settings. 540°C. 570°C. aT (°A). 3.895. 3.892. cT (°A). 4.122. 4.065. cT/ aT (°A). 1.058. 1.044. After heating the powder at 650°C, the diffraction peaks of the PbO2, and ZrO2 (PbTiO3)ss phases decrease while the intensity of the PZT main lines increases (Fig. 7.). 6 5 0 °C 700 PZT. 600. Int (a.u.). 500. 400 PZT. PZT PZT. 300 PZT. 200. 100. 10. 20. 30. 40. 50. 60. 70. 80. 2 d e g re e s. Fig.7. X-ray diffraction patterns of standard reactants calcined at 650 °C. Vibrational spectroscopy based on infrared transmission has been used to characterize samples obtained at different calcination temperatures. Absorption spectra evidence two peaks of vibration. The first one is located between 460 cm-1 and 800 cm-1 and is considered by several authors [9-10] as metal-oxygen (M-O) stretching vibration. This is the case Zaghetti et al who have also studied the formation of the PZT with a ratio of 53/47[9]. The second peak around 1400 cm-1 is characteristic of the solid solution of PbTiO3. Indeed, we can see clearly the gradual disappearance of the peak as a function of temperature, as shown in Fig. 8. As this disappearance involves the formation of PZT, this confirms the conclusion. T ra n sm itta n ce (% ). of the XRD study.. 1800. 1700. 1600. 1500. 1400. 1300. 700°C. 570°C. 530°C. 4000. 3500. 3000. 2500. 2000. 1500. W a v en u m b er (c m. -1. 1000. 500. ). Fig.8. IR bands for PZT powder calcined at 540°C, 570°C and 700°C..
(8) H. Allal et al.. J. Fundam Appl Sci. 2013, 5(2), 183-191. 190. However, the TG-DTA curve of Figure 3 indicates that the PZT cannot be obtained as a pure phase at 700°C. This is probably due to the volatilization of small amounts of lead oxide (PbO liquid phase) at temperatures above 750°C. However, the XRD patterns of powders calcined at 700 ° C, 750 ° C and 850 ° C allow confirming this hypothesis (Fig. 9.). 600 500 400 300 200 100 0. 800°C. 10. 15. 20. 25. 30. 35. 40. 45. 50. 55. 60. 65. 70. 20. 25. 30. 35. 40. 45. 50. 55. 60. 65. 70. 20. 25. 30. 35. 40. 45. 50. 55. 60. 65. 70. Int (a.u.). 500 450 400 350 300. 750°C. 250 10. 250 200 150 100 50 0. 15. 700°C. 10. 15. 2 (degrees). Fig.9. X-ray diffraction patterns of powder mixture calcined at 700 °C, 750 °C and 800°C.. 4. CONCLUSION PZT ceramics have been synthesized using β-PbO2 as a starting material in association to standard TiO2 and ZrO2 powders. From thermal and diffraction measurements, the reaction sequencecanbedescribedasfollows: 1. Phase change from β-PbO2 to PbO2 (highpressure). 2. The transformation of PbO2 (HP) into PbO and Pb3O4. 3. The formation of solid solution of PbTiO3, perovskite structure. 4. The diffusion of Pb2 + and Zr 4 + in PbTiO3 structure. 5. The formation of PZT solid solution. The use of lead dioxide in the batch seems to enhance the diffusion of Pb2 + and Zr4 + in PbTiO3 structure. In addition, it makes the formation of PZT phase possible at low temperature because the PbO originating from the decomposition of β-PbO2 is more reactive than commercial PbO.. 5. REFERENCES. [1] Jaffe B., Cook R., Jaffe H., Piezoelectric Ceramics. New York: Academic Press, 1971, pp. 135. [2] Jaffe B., Piezoelectric ceramics. New York: Academic Press, 1971, pp. 317. [3] S. K. Mishra, A. P. Singh, D. I. Pandey, Structural studies. Philos. Mag. 1997, 76 (2), 213..
(9) H. Allal et al.. J. Fundam Appl Sci. 2013, 5(2), 183-191. 191. [4] Matsuo Y., H. Sasaki H., J. Am. Ceram. Soc. 1965, 48, 289. [5] Venkataraman S., Biggers J. V., Bull. Am. Ceram. Soc. 1980, 59, 462. [6] Mori S., Mitsuda H., K. Date K., Hioki Y., Miyazawa T., Nat. Tech. Rept. 1964, 10, 32. [7] Schandrateya S., Fulrath K. M., Pask J. A., J. Am. Ceram. Soc. 1981, 64 (7), 422. [8] Vassant Kunar C. V. R, Pascual R., Sayer M., J. Appl. Phys. 1992, 71 (2), 864. [9] Syono Y., Akimoto S., Mat. Res. Bull. 2003, 3, 153. [10] Benhamidéche C., Boutarfaia A., Bouaoud S. E., Sil. Ind. 2005, 70 (9-10), 143. [11] Garnweitner G., Hentschel J., Antonietti M., Niederberger M., Chem. Mater. 2005, 17, 4594. [12] Zaghete M., Varele J., Cilense M., Paivra-santas C. P., Las W. C., Longo E., Ceram. Int. 1999, 25, 239.. How to cite this article: Allal H, Benhamidéche C, Bouaoud S. E, Marcel. Poulain M. The influence of β-PBO2 on PZT phase formation. J. Fundam. Appl. Sci., 2013, 5(2), 183-191..
(10)
Figure

Documents relatifs
To investigate such hypotheses, we measured (i) the xylem vulnerability to cavitation for different populations, and (ii) several anatomical and hydraulic parameters
Fin octobre 2016, 754 100 personnes sont inscrites à Pôle emploi sans être tenues de rechercher un emploi, qu'elles soient sans emploi (catégorie D) ou en emploi (catégorie
However, in light of the available evidence, regional extinction of populations exposed to environmental degradation was likely the main mechanism at work in Eurasia dur- ing
L’archive ouverte pluridisciplinaire HAL, est destinée au dépôt et à la diffusion de documents scientifiques de niveau recherche, publiés ou non, émanant des
Version définitive du manuscrit publiée dans / Final version of the manuscript published in : Dyes and Pigments (2017), Vol.. The equilibrium and rate constants of the multistate
PERKEO measures neutron decay g-spectra with a 4TT solid angle over a large volume of a cold neutron beam.. The count rates from polarized neutron decay achieved with this
Enfin, sur la base de ce calcul de bandes d'énergie, il apparaît que des transitions quadripolaires seraient possibles entre la bande de valence et la bande de conduction, ce qui
A teacher at MacKay for a number of years, she was responsible for integrating non-handicapped children into the special classes at MacKay, but she felt that
