THE DISSOCIATIVE IONIZATION OF NITROUS OXIDE.
A COMPARISON BETWEEN ELECTROIONIZATION AND HeI AND
NeI PHOTOIONIZATION
R. LOCHT, G. CAPRACE and J. MOMIGNY
Département de Chimie Générale et de Chimie-Physique, Institut de Chimie, Bâtiment B.6, Université de Liège, Sart-Tilman par B-4000 Liège 1, Belgium
Abstract
The photoelectron spectrum of N2O and the kinetic energy distributions of NO +
, N2 +
, O+ and N+ have been recorded with the HeI and NeI resonance lines. At 21.22 eV, the distributions are similar to those observed by electroionization at comparable energy. The NeI resonance line produces O+ and NO+ ions. Their respective kinetic energy distributions are related to the change induced in the N2O
+
(Ã2Σ+) photoelectron band excited by the NeI resonance lines.
We recently reported [1,2] on the dissociative electroionization of N2O. The four dissociation channels
producing NO+, N2 +
, O+ and N+ were extensively discussed on the basis of the kinetic energy distribution spectra and the ionization efficiency curves of the mass-selected fragment ions.
The main difficulty in interpreting the electroionization results is the superposition of autoionization on the direct ionization phenomena. The electroionization threshold law and the lack of electron energy resolution are additional disadvantages.
To avoid autoionization, the most convenient technique is the use of a monochromatic light source, the wavelength of which is non-resonant with an autoionizing state. In most cases, the HeI resonance line at 58.43 nm (21.22 eV) is non-resonant with autoionization [3]. In principle, the resonance lines of the other gases can also be used. However, several investigations [4] showed these lines to produce direct ionization and autoionization as well. The photoelectron spectra recorded with these lines can differ markedly from those excited by the HeI resonance line.
The aim of this letter is to describe the kinetic energy spectra of the four fragment ions obtained by exciting the N2O molecule by the HeI and NeI resonance lines at 58.43 nm and 73.59-74.37 nm, respectively.
The experimental apparatus used in the present work will be described in detail elsewhere [5]. The main features only are mentioned here. The light, produced by a discharge in the abovementioned rare gases, is led into an ion chamber through a capillary. The photoions are extracted by a 0-300 mV cm-1 draw-out field. After leaving the ion source and before entering a quadrupole mass filter, the ions are energy analyzed by means of a retarding lens. The retarding potential Vr is scanned by applying a voltage ramp to the retarding lens. The first
derivative of the retarding potential curve of the Ar+ ions has a fwhm of about 80 meV.
The photoelectrons, flying in the opposite direction to the photoions, can be energy analyzed in a retarding potential-type analyzer with a differential output [6]. The resolution as measured in the photoelectron spectrum of Ar has been limited to 40-50 meV.
Both the ions and electrons are detected by means of conventional Cu-Be electron multipliers followed by counting electronics. Both signals are collected and stored in a minicomputer for further handling and recording.
The intensity ratios measured in the mass spectrum of N2O, as obtained with the HeI resonance line, are
1.00(N2O +
) : 0.50(NO+) : 0.13(N2 +
) : 0.2(O+) : 0.4(N+). These values have to be compared with 1.00 : 0.54 : 0.12 : 0.2 : 0.2 obtained by Brehm et al. [7] with the same radiation. Figs. 1 and 2 show the ion energy distribution spectra of NO+-N2
+
and O+-N+ observed under the same conditions. Compared to the parent ion, used as an internal standard for the ion energy scale, all the fragment ions exhibit a high-energy tail. No structure is observed. All distributions show an important thermal energy peak. By electroionization [1,2], the same features
have been observed previously for the same ions at comparable electron energies. Fig. 1. First derivative of the retarding potential curves for NO+ and N2
+
ions, observed with the HeI resonance line at 58.4 nm.
Fig. 2. First derivative of the retarding potential curves for O+ and N+ ions, observed the HeI resonance line at 58.4 nm.
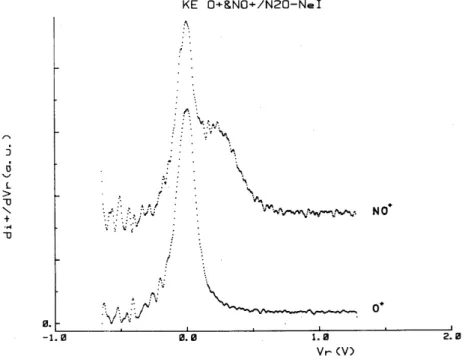
Fig. 3. First derivative of the retarding potential curves for NO+ and O+ ions observed with the NeI resonance line at 73.59-74.37 nm.
As has been shown in both photoionization [7-9] andelectroionization [1,2], the distributions observed at 21.22 eV result from the added contributions of the predissociationof the à 2∑+, B~2∏ and/or C~2∑+ states of N2O+. The predissociationof the higher vibrational levels of the N2 O+(X~2 ∏) state, observed by electron impact
and resonant photoionization, is ruled out in fixed-wavelength photoionization using the HeI resonance line [7]. These vibrational levels are known experimentally to be populated by autoionization only [10].
From these considerations, it follows that the kinetic energy distributions measured by HeI photoionization are expected to lead to a clearer situation than by electron impact. For both O+ and N+, thermal ions were observed and at least partially ascribed to the decomposition of the N2O+ (X~2∏) state [1,2].
First, for the O+ ions produced by electroionization [2], the kinetic-energy versus appearance-energy diagram shows thermal ions to be formed at the expense of the N2O
+
(X~2Π) state. On the other hand, the HeI
kinetic energy spectrum of O+ shows a thermal O+ ion also. In the energy range of this radiation, at least twc dissociation processes are energetically allowed, i.e.
at 19.188/19.470 eV,
at 16.700 eV. Only process (1) could be detected by electroionization [2].
Secondly, as noticed earlier [1], one dissociation process giving rise to NO+ ions, i.e.
However, this reaction is energetically allowed and is produced by photodissociation of N2O+ ion beams [11],
and was proposed by Brehm et al. [7] or the basis of photoion-photoelectron coincidence experiments.
Closer to the threshold of processes (2) and (3), and therefore more selective, is the use of the NeI resonance lines at 16.85-16.67 eV. Only the X~2Π and the Ã2Σ+ states of N2O+ could be excited. These states
have been shown to procedure O+ and NO+ fragments only [7,10].
At these energies, the intensity ratios in the mass spectrum are 1.00(N2O +
): 0.10(NO+): 0.07(O+). Fig. 3 shows the kinetic energy distribution of NO+ and O+ as observed with the NeI resonance lines. For the O+ ion, the shape of the distribution is comparable with the spectrum observed at 21.22 eV, but with a shorter high-energy tail. A thermal high-energy peak is still observed. On the contrary, the NO+ ion energy spectrum looks quite different to the distribution observed with HeI. Two distinct components are found, i.e. a thermal peak and a high-energy distribution with a maximum near 200 meV and extending to about 700 meV. Noteworthy is that the shape of this distribution differs significantly from the NO+ ion energy spectrum recorded with 16.0 and 17.0 eV electrons [1].
By using NeI radiation instead of the HeI resonance line, changes could occur in the photoelectron spectrum which could account for the differences observed in the ion energy distributions. In the particular case of N2O, it has to be noted that the 74.372 nm line, produced in the Ne discharge, is nearly resonant with 74.293
nm autoionization peak observed in the photo-ionization efficiency curves of O+, NO+ and N2O+ with less
intensity [8,12]. As mentioned earlier, autoionization could induce drastic changes in the photoelectron spectra [4].
The HeI and NeI photoelectron spectra of X~2Π and Ã2Σ+ states of N2O +
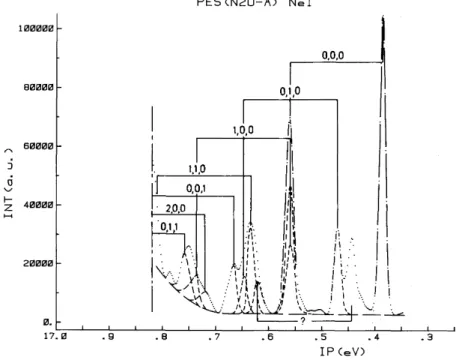
have been recorded. Important changes in relative intensities are observed in both photoelectron bands. The deconvoluted photoelectron spectrum of the N2O+ (Ã 2Σ+) state, as obtained with the NeI resonance lines, is shown in fig. 4. The equivalent
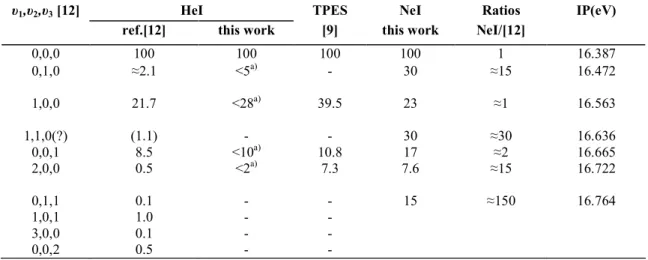
resolution, as measured by the fwhm of the Ã2Σ+ (0,0,0) peak, is 13 meV [13]. Table 1 displays the relative intensities corrected for the electron analyzer transmission, in both the HeI and NeI spectra. For comparison, the values measured previously by Dehmer et al. [12] and Frey et al. [9] are reproduced. The doublet Kr+ (2P3/2
-2
P1/2)
is used for calibration of the electron energy scale. The ionization potentials deduced from these spectra are listed in the last column of table 1.
Table 1 : Comparison of the relative intensities for the N2O +
à 2 ∑+(υ1,υ2,υ3 ) transitions obtained with HeI and
NeI
υ1,υ2,υ3 [12] HeI TPES NeI Ratios IP(eV)
ref.[12] this work [9] this work NeI/[12]
0,0,0 100 100 100 100 1 16.387 0,1,0 ≈2.1 <5a) - 30 ≈15 16.472 1,0,0 21.7 <28a) 39.5 23 ≈1 16.563 1,1,0(?) (1.1) - - 30 ≈30 16.636 0,0,1 8.5 <10a) 10.8 17 ≈2 16.665 2,0,0 0.5 <2a) 7.3 7.6 ≈15 16.722 0,1,1 0.1 - - 15 ≈150 16.764 1,0,1 1.0 - - 3,0,0 0.1 - - 0,0,2 0.5 - -
The assignments proposed by Dehmer et al. [12] have been used to interpret the spectrum shown in fig. 4. Two peaks could not be assigned, i.e. those at 16.444 and 16.787 eV. This last feature was observed in previous spectra of the N2O+ (Ã2Σ+) band [12].
Fig. 4. Deconvoluted photoelectron spectrum of the N2O+(Ã2Σ+) state recorded with the NeI resonance line.
With 16.85-16.67 eV radiation, O+ ions are still produced with thermal or nearly thermal energy. Only process (2) can be invoked. This process has not been observed by electroionization [2], where only N2O+ (Ã2Σ+)
→ N2 (X 1
Σg +
,υ = 2-3)+ O+(4S) + KE ≥ 0.5 eV is compatible with the experimental data. The thermo dynamic threshold for the dissociation path (2) is close to the energy of the (2,0,0) level of the à 2Σ+ state. As shown in table 1, the relative intensity of this transition is enhanced by a factor of 15. This observation could account for the intensity of the thermal energy peak. The high-energy tail of the O+ ion energy distribution, extending up to 400-500 meV, can be ascribed to the partition of the excess energy with respect to 15.291 eV between kinetic energy of the fragments and the vibrational energy of N2 (X
1
Σg +
, υ = 4-2).
With the NeI resonance lines at 16.67-16.85 eV, the NO+ ions can be produced through the predissociation of N2O+ (Ã2Σ+) vibrational levels lying above υ = 0,0,0 [7] and leading to (i) the abovementioned
process (3) and/or (ii) NO+(X1 Σ+, υ) + N(4S) + KE ≥ 0, for which the lowest threshold is at 14.194 eV.
For the first process, the thermodynamic onset is calculated at 16.577 eV. This dissociation path is opened at the à 2Σ+ (l ,1,0) level measured at 16.636 eV, producing NO+ ions carrying 19 meV kinetic energy. Brehm et al. [7] assigned the low-energy NO+ ions, in coincidence with 16.61 eV electrons, to this process and state "this new channel makes a small but detectable contribution". It has to be pointed out that in the NeI photoelectron spectrum the relative intensity of the à 2Σ+(l ,1,0) level is increased by about 30. This observation could a least partially account for the fairly intense low-energy peak in the NO+ ion energy distribution in fig. 3. Another dissociation channel would at least formally be allowed at 16.665 eV, i.e. at the à 2∑+(0,0,l) level, and produce thermal NO+ ions, i.e. NO+(X1 Σ+, υ = 9) + N(4S), which has its calculated threshold at 16.657 eV, using the excess energy of 2.463 eV to populate the υ = 9 vibrational level [19].
The high-energy part of the NO+ ion energy distribution observed with the HeI line has been interpreted by Brehm et al. [7] as the partition of the excess energy with respect to 14.194 eV between the internal energy of NO+(X1 ∑+) and the kinetic energy of the fragments. NO+(X1 ∑+) is vibrationally distributed between υ = 8 and υ = 3. By electroionization in the energy range 16.0-17.0 eV [1], the kinetic-energy versus appearance-energy diagram showed only NO+ (X 1Σ+, υ = 2) + N(4S) fragments with an increasing amount of kinetic energy. This discrepancy has been pointed out earlier [1]. As mentioned above, the NO+ ion energy distribution observed by electroionization and with the HeI radiation on one hand and by photo-ionization with HeI radiation on the other are rather different.
energy carried by both NO+ and N fragments. The NO+ ions being produced by predissociation of the à 2Σ+ state and the intensity enhancement giving rise to the observed ion energy distribution could be accounted for by the increase of relative intensity of a number of transitions as measured in the NeI photoelectron spectrum. The Ã
2
Σ+ (2,0,0) with an enhancement ratio of 15 : 1 with respect to the HeI spectrum would produce NO+(X 1Σ+, υ = 7) carrying 200 meV kinetic energy. At higher ion energies, NO+(X 1Σ+) is produced in lower vibrational levels with increasing kinetic energy. For 700 meV kinetic energy, NO+ ions would be formed in the X 1Σ+, υ = 1 state.
The N2 +
and N+ ions, being produced only in the energy range of N2O +
(B~2Π and/or C~2Σ+) states, are not observed when the NeI resonance lines are used.
Acknowledgements
This work has been performed under the auspices of the Action de Recherche Concertée (ARC) contract with the Belgian Government. We wish to thank the Fonds de la Recherche Fondamentale Collective (FRFC) for financial support.
References
[1] J.L. Olivier, R. Locht and J. Momigny, Chem. Phys. 68 (1982)201. [2] J.L. Olivier, R. Locht and J. Momigny, Chem. Phys. 84 (1984) 295.
[3] J.A.R. Samson, Technique of vacuum UV spectroscopy (Wiley, New York, 1967). [4] P. Natalis, Mém. Cl. Sc. Acad. Roy. Belg. XL1 (1973).
[5] R. Locht and J. Momigny, to be published.
[6] I. Lindau, J.C. Helmer and J. Uebbing, Rev. Sci. Instr. 44 (1973) 265.
[7] B. Brehm, R. Frey, A. Kusrler and J.H.D. Eland, Intern. J. Mass Spectrom. Ion Phys. 13 (1974) 251. [8] J. Berkowitz and J.H.D. Eland, J. Chem. Phys. 67 (1977) 2740.
[9] R. Frey, B. Gotchev, W.B. Peatman, H. Pollak and E.W. Schlag, Chem. Phys. Letters 54 (1978) 411. [10] I. Nenner, P.M. Guyon, T. Baer and T.R. Govers, J. Chem. Phys. 72 (1980) 6587.
[11] R.G. Orth and R.C. Dunbar, J. Chem. Phys. 66 (1977) 1616.
[12] P.M. Dehmer, J.L. Dehmer and W.A. Chupka, J. Chem. Phys. 73 (1980) 126. [13] R. Locht and J. Momigny, to be published.
[14] P. Natalis, J.E. Collin, J. Delwiche, G. Caprace and M.J. Hubin-Franskin, J. Electron Spectry. 17 (1979) 421.