T
HED
IAGNOSTICV
ALUE OFR
ESCALEDR
ENALB
IOMARKERSS
ERUMC
REATININE ANDS
ERUMC
YSTATINC
AND THEIRR
ELATION WITHM
EASUREDG
LOMERULARF
ILTRATIONR
ATEHans Pottel1, Laurence Du Bourg2, Elke Schaeffner3, Bjorn Odvar Eriksen4, Toralf Melsom4, Edmund
J. Lamb5, Andrew D. Rule6, Stephen T. Turner6, Richard J. Glassock7, Vandréa De Souza8, Luciano
Selistre8, 9, Karolien Goffin10, Steven Pauwels11, Christophe Mariât12, Martin Flamant13, Sebastjan
Bevc14, Pierre Delanaye15 * Natalie Ebert3 *
1Department of Public Health and Primary Care, KU Leuven Campus Kulak Kortrijk, Kortrijk, Belgium 2Exploration Fonctionnelle Rénale, Groupement Hospitalier Edouard Herriot, Hospices Civils de Lyon, Lyon, France
3Charité University Hospital, Institute of Public Health, Berlin, Germany
4Metabolic and Renal Research Group, UiTThe Arctic University of Norway, Troms0, Norway
5Clinical Biochemistry, East Kent Hospitals University NHS Foundation Trust, Canterbury, Kent, United Kingdom
6Division of Nephrology and Hypertension, Mayo Clinic, Rochester, Minnesota, USA
7Emeritus Professor of Medicine, Geffen School of Medicine at UCLA, Laguna Niguel, California, USA 8Universidade de Caxias do Sul - Programa de P6s Graduaçâo em Ciências da Saude - Brazil 9Pontificia Universidade Catolica do Rio Grande do Sul - Porto Alegre- Brazil
10Department of Nuclear Medicine & Molecular Imaging, University Hospital Leuven, Leuven, Belgium 11Department of Cardiovascular Sciences, Department of Laboratory Medicine, University Hospital Leuven, Leuven, Belgium.
12Service de Néphrologie, Dialyse et Transplantation Rénale, Hôpital Nord, CHU de Saint-Etienne, France
13Department of Renal Physiology, Hôpital Bichat, AP-HP and Paris Diderot University, Paris, France 14University Medical Centre Maribor, Clinic for Internal Medicine, Department of Nephrology, Maribor, Slovenia
15Nephrology-Dialysis-Transplantation, University of Liège, CHU SartTilman, Liège, Belgium *Pierre Delanaye and Natalie Ebert equally contributed as co-last authors
ABSTRACT
Background: Serum creatinine (Scr) is the major contributing variable in glomerular filtration rate (GFR) estimating equations. Serum cystatin C (ScysC) based GFR estimating (eGFR)-equations have also been developed. The present study investigates the relation between 'rescaled' levels of these renal biomarkers (with reference interval of [0.67-1.33]) and measured GFR (mGFR).
Methods: We evaluated the diagnostic ability to detect impaired kidney function of the rescaled renal biomarkers in 8584 subjects from 12 cohorts with measured GFR, standardized Scr and ScysC. We calculated sensitivity and specificity of the rescaled biomarkers to identify kidney disease, with reference to a fixed (60mL/min/1.73m2) as well as an age-dependent threshold for mGFR.
Results: The upper reference limit of 1.33 for rescaled renal biomarkers is closely related to the age-dependent threshold for defining kidney status by mGFR with sensitivity and specificity for the rescaled biomarkers close to 90% for all ages. If the fixed threshold of 60mL/min/1.73m2for mGFR is used, then lower specificity in children and sensitivity in older adults are observed.
Conclusions: Impaired kidney function can be diagnosed by rescaled renal biomarkers instead of eGFR-equations using the fixed threshold of 1.33 for all ages, consistent with an age-dependent threshold of mGFR.
1.
I
NTRODUCTIONSerum creatinine (Scr) is the most widely used renal biomarker and can be measured using assays that are specific (e.g. enzymatic assays) and calibrated against the reference method of isotope dilution mass spectrometry (IDMS). The test is relatively cheap and commonly ordered as part of a basic investigation panel in clinical biochemistry. However, Scr has some limitations as a renal marker: Scr is influenced by non-GFR determinants, e.g. muscle mass, and part of renal clearance of creatinine is due to tubular secretion [1]. Moreover, Scr remains within the reference interval in a substantial proportion of patients despite a reduced (< 60mL/min/1.73m2) glomerular filtration rate
(GFR) [2-3] leading to doubts about Scr's ability to detect impaired kidney function [4-9]. Also, there are age and gender differences in creatinine generation which complicates the interpretation of Scr (as well as Scr-based eGFR) when assessing kidney function. For Caucasians, the determination of reference intervals has been the subject of detailed studies [10-11]. After birth, Scr rapidly decreases to a value of approximately 22µmol/L (0.25mg/dL) during the first month of life and then starts to increase linearly with age. Scr concentration remains constant, on average, for the healthy subject between 20 and 70 years of age, with a mean of 80µmol/L (0.90mg/dL) and reference interval 55.7-102.5µmol/L (0.63-1.16mg/dL) for men and 62µmol/L (0.70mg/dL) and reference interval 42.4-82.2µmol/L (0.48-0.93mg/dL) for women. Above the age of 70, Scr starts to slowly increase again in both genders [12].
To simplify the interpretation of Scr, Pottel et al [13-19] proposed to 'normalize' Scr. Normalization is a statistical term that means adjusting values measured on different scales to a notionally common scale. Indeed, dividing Scr with the mean Scr-value (called Qcrea) of the age and sex specific healthy
population rescales the reference intervals to a common interval as it makes Scr/Qcrea independent of
age/sex. Consequently the rescaled biomarker Scr/Qcrea may serve as a renal biomarker incorporating
its limitations due to muscle mass variation, related to age and sex differences. Due to the 'rescaling/normalizing' action, the values of Scr/Qcrea become normally distributed around the mean
of '1' (a consequence of the definition of Qcrea) with 2.5th percentile (Pct) =0.67 and 97.5th Pct=1.33,
(corresponding to a standard deviation of 0.1683). This holds equally true for children, adolescents and adults [16].
Serum cystatin C (ScysC) is considered a valid alternative to Scr, especially now that a certified reference material is available [20]. ScysC can be rescaled more easily than Scr, as ScysC is almost independent of age and sex [21-22]. Only in older adults we have seen a gradual but significant increase in ScysC-concentration with age [19], most probably due to a decline in mGFR and additionally influenced by non-GFR related determinants, such as cardiovascular disease risk factors and inflammation [23-25]. Rescaling ScysC with QcysC=0.82mg/L for children and adults up to 70 years
and with QcysC=0.95mg/L beyond that age brings the rescaled ScysC/Qcysc to the same common
scale as Scr/Qcrea [19].
In this study we show that rescaled renal biomarkers contain important diagnostic information about kidney function that can easily be interpreted in terms of 'normal' (healthy) or 'abnormal' (diseased) using the upper limit of 1.33 (=97.5thPct). We also wanted to investigate how mGFR evolved with age
in the subgroup defined by renal biomarkers <1.33. Finally, we wanted to check the consistency between this fixed reference interval [0.67-1.33] to diagnose kidney function in terms of normal/abnormal and the use of a fixed or age-dependent threshold for mGFR.
2.
M
ETHODS ANDP
ARTICIPANTS2.1. Participants
The current retrospective analysis collected data from 12 cohort studies. Among the 12 cohorts five [25-29] prospectively investigated the use of Scr and ScysC-based eGFR-equations for diagnosing chronic kidney disease. Eleven of the 12 cohorts, including n=6132 subjects, have been presented in detail elsewhere [19]. An additional cohort of healthy and kidney diseased subjects from Slovenia (n=134), has been included to increase the sample size for the [20-40] year age-range. The paediatric data from Lyon (n=259 children with 695 measurements) and adult data from the CRIC cohort (n=674 adults with 1534 measurements) were also included in the current analysis. An additional number of adult patients from Paris and from Lyon were included to increase the sample size, especially for the [20-40] year age range. The data were anonymized and centralized for this study, which received IRB approval from Leuven University Hospital, Belgium. In total n=8584 participants, with data for mGFR,
standardized Scr and ScysC, age and gender were included.
2.2. Measurement methods
A summary of the methods used in the different collaborating centres is given in Table 1 and have been previously described (except for Slovenia) in detail [19]. Direct GFR measurement was performed with different reference methods, as described before [18-19]. Scr was measured with assays traceable to IDMS, re-calculated to IDMS (CRIC study), or directly with IDMS [27] in all studies. ScysC was measured with assays that were calibrated against the certified ERM-DA471/IFCC standard or the results were recalculated to the certified reference standard [30]. The rescaling values for ScysC have been introduced in a previous study [19] and are further justified reference [31].
2.3. Statistical analysis
The data are presented as means and standard deviations or with 95% confidence intervals. Sensitivity (S) and specificity (Sp) are defined as:
TP TN S =--- and Sp = ---
TP+FN TN+FP
With TP = True Positive, TN = True Negative, FP = False Positive and FN = False Negative. To define TP, TN, FP and FN, the healthy and diseased groups have to be defined, as well as the positivity and negativity of the test result. For this analysis, we used the total cohort of 8584 subjects, subdivided in age-decades. We here present three different scenarios:
In the first scenario, measured GFR is used to define the kidney status in terms of 'healthy' or 'diseased' based on the currently recommended fixed cutoff (COF) of 60mL/min/1.73m2. In this
scenario, a true positive (TP) test result is obtained when (Scr/Qcrea+ScysC/QcysC)/2>1.33 in the
subgroup with mGFR<COF=60mL/min/1.73m2. A true negative (TN) test result is obtained when
(Scr/Qcrea+ScysC/QcysC)/2<1.33 in the subgroup with mGFR>COF=60mL/min/1.73m2. We here
combine the rescaled biomarkers by taking the mean of both into one criterion. We can do this, as both rescaled biomarkers are evaluated on the same common "normalized" scale. It has been shown recently that using the combination of biomarkers increases the precision of the eGFR-equation significantly [18-19, 26, 32-33]. Therefore, diagnosing kidney disease based on the combined rescaled biomarkers is likely to be more accurate. Additionally, we have repeated this analysis for the single rescaled biomarkers in reference [31].
In the second scenario, measured GFR is used to define the kidney status in terms of 'healthy' or 'diseased' based on an age-dependent threshold or cut-off (COAD), which we here define as:
COAD = 107.3/1.33 [x 0.988(Age-40) when Age > 40 years]
This threshold equals 107.3/1.33=80.7mL/min/l.73 m2 for ages <40 years, and then the threshold
gradually declines with age (e.g. at the age of 65 years, the threshold becomes 59.7≈ 60mL/min/1.73m2; at the age of 80 years, the threshold becomes 49.8≈ 50mL/min/1.73m2). The
decrease in GFR with age has been well described even in healthy subjects [34-36]. The age-dependent threshold, presented here, is based on the FAS-equation with Scr/Qcrea=ScysC/QcysC=1.33,
the upper reference limit for the rescaled renal biomarkers [18-19] and has been introduced as an age-dependent threshold for GFR in a recent publication [37].
TP is here defined as (Scr/Qcrea+ScysC/QcysC)/2>1.33 in the subgroup with mGFR<COAD. TN is
defined as (Scr/Qcrea+ScysC/QcysC)/2<1.33 in the subgroup with mGFR≥COAD.
In the third scenario, we define kidney status in terms of 'healthy' or 'diseased' based on the rescaled renal biomarkers, which is the setting closest to clinical routine, as mGFR is usually not available. The kidney function is considered 'normal', or 'healthy', when the renal biomarkers are within the reference interval, or, when the average of both rescaled renal biomarkers is <1.33. Thus, when (Scr/Qcrea+ScysC/QcysC)/2>1.33, the kidney function is considered 'abnormal' or 'diseased'. To define
TP and TN we now use mGFR (which is here available for the purpose of the study) as the reconfirming test result. As in the first and second scenario, we can use the fixed threshold of 60mL/min/1.73m2 and the age-dependent threshold CO
AD. In other words, in the third scenario we turn
things around by changing the roles of mGFR and the biomarkers in the definitions of TP, TN, FP and FN. Hereby we want to test the hypothesis whether biomarkers and mGFR can be used
interchangeably to diagnose and define kidney status. Therefore, we evaluate S and Sp versus age for the scenarios 1 compared to scenario 3 (with fixed cutoff for mGFR), and for scenario 2 versus scenario 3 (with age-dependent cutoff for mGFR). All analysis were done in SAS 9.4 (SAS Institute Inc., Cary, NC, USA).
3.
R
ESULTS3.1. Patient characteristics
Mean (±SD) for age, mGFR, rescaled Scr and ScysC are summarized for all individuals of the twelve contributing cohorts in Table 2.
3.2. Rescaled renal biomarkers within the reference interval and their relation with mean measured GFR
There were n=4749 subjects exhibiting both rescaled biomarkers within the common reference interval [0.67-1.33]. They had a mean age of 55.0 years (SD=17.8) and mean mGFR of 88.6 (SD=19.6) mL/min/1.73m2. Table 3 presents an overview of the results per age-decade for this subgroup of
patients. We also observe overall mean rescaled biomarker values close to '1.00', in each age-group, corresponding to the mean rescaled biomarker value for healthy people. Interestingly, the mean mGFRs in the different age-decades are very similar to the results described in the meta-analysis in healthy potential kidney donors [38].
In the next part of the results section we test the possibility to interchangeably use the renal biomarkers with fixed threshold of 1.33 and measured GFR with fixed threshold of 60mL/min/1.73m2 or
with the previously defined age-dependent threshold.
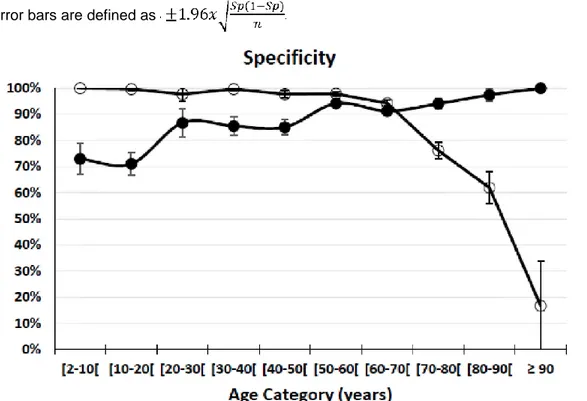
3.3. Disease status defined by fixed mGFR threshold of 60mL/min/1.73mz
We here combine the first scenario (=fixed threshold for mGFR) with the third scenario (=fixed threshold for rescaled renal biomarkers). We present the frequency of observations with renal biomarkers below and above 1.33 in the subgroups defined by mGFR< and >60mL/min/1.73m2 (Table
4 and Figure 1).
For children and older adults, sensitivity and specificity deviate largely depending on the definition of kidney status (either based on the rescaled renal biomarkers or on the fixed threshold of mGFR). For example, for children aged between 2 and 10 years, all patients with mGFR<60 have biomarker values >1.33 (S=28/28=100%), but only about 159 out of 218 (Sp = 73%) children with mGFR ≥60 have biomarker values <1.33. Conversely, in older adults, aged 80-90, we observe that 182/(94+182) (S=66%) of the patients with mGFR<60 have biomarker values >1.33 and 153/(153+4) (Sp=97.5%) with mGFR≥60 having biomarker values ≤1.33. This analysis shows the lack of consistency or agreement in defining or diagnosing kidney disease based on the rescaled renal biomarker reference intervals and measured GFR combined with the fixed threshold of 60mL/min/1.73m2.
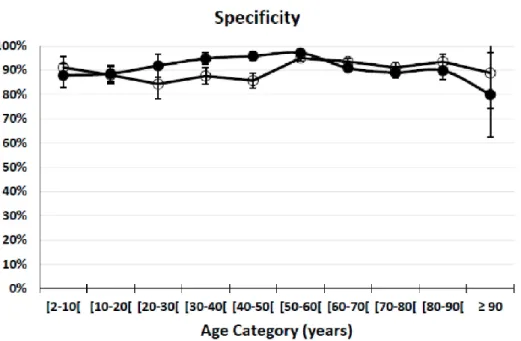
3.4. Disease status defined by an age-dependent threshold of mGFR
Here, we combine the second scenario (=age-dependent threshold for mGFR) with the third scenario (=fixed threshold for the normalized renal biomarkers). We present the frequency of observations with normal and abnormal renal biomarkers in the subgroups defined by mGFR< and ≥COAD (Table 4).
Sensitivity and specificity are nearly equal for all age-categories and close to 90% (Figure 2). This observation shows that when an age-dependent mGFR threshold is used to define the renal status as healthy or diseased, rescaled renal biomarkers and measured GFR give consistent results.
4.
D
ISCUSSIONIn this study we have evaluated the diagnostic value of Scr and ScysC as single renal biomarkers (see also the reference [31]) and by combining them. We used reference intervals of both renalbiomarkers to diagnose kidney function as 'healthy' or 'diseased'. This was done by rescaling the biomarkers with appropriate rescaling factors: Qcrea for Scr and QcysC for ScysC. Rescaling renal biomarkers reveals
several interesting and important properties, which are valid for both Scr/Qcrea and ScysC/QcysC. The
rescaled biomarkers are independent of age and sex, and can thus be used for children, adolescents, adults and older adults. The rescaled biomarker is normally distributed with a mean of '1'. Therefore, the rescaled biomarker can, on average, be interpreted as follows: the further the value deviates from '1' the more the patient's kidney function deviates from the kidney function of the average healthy
subject. Outside the reference interval [0.67-1.33] the rescaled biomarker values are abnormal. Our analysis shows that in the subgroup of patients with rescaled biomarkers within the range of [0.67-1.33], the mean measured GFR remains constant until the age of 40 years and then starts to decline with age. The identical phenomenon, that measured GFR remains constant until 40 years of age, and then starts to decline, was also observed in several studies with mGFR in healthy living kidney donors [39-43] and summarized in a recent meta-analysis on mGFR of living kidney donors, without information on renal biomarkers [38]. The fact that these 'healthy' mGFR-age profiles, are identical in the current study and in the previous meta-analysis, shows that 'healthy' kidney function can be diagnosed by rescaled biomarkers within the reference range. Interestingly, the rescaled biomarkers in the 'healthy' subgroup of the current analysis do not show an age-dependency, but remain approximately constant and, on average, equal to '1' during the complete lifetime. The present data therefore reconfirm the hypothesis that rescaled biomarkers are independent of age and gender (see also reference [31] for more detailed information on rescaled renal biomarkers and their relation with measured GFR).
Measured GFR is the reference method to define kidney function. However, there is controversy about the thresholds to define 'healthy' or 'diseased' status of the kidney [34-36]. A necessary requirement of the current recommendation for CKD Stage 3 is that mGFR is < 60mL/min/1.73m2. In clinical practice,
measured GFR is mostly unknown, as measuring GFR is not routinely performed. On the other hand, biomarkers are more easily obtained as this requires only one blood sample of the patient. As reference intervals of these rescaled biomarkers are available ([0.67-1.33]) it could be expected that these would correlate well with reference intervals for measured GFR. In the present study, we have confirmed that this is indeed the case, on condition that reference intervals for measured GFR are age-dependent. The present analysis shows that individuals above the age of 40 years, with biomarkers within the reference range of [0.67 - 1.33], have measured GFR that declines with age. Using biomarkers instead of mGFR to detect impaired kidney function would imply that sensitivity (S) and specificity (Sp), based on disease status as defined by the renal biomarkers, or as defined by measured GFR, are similar on average, when both definitions are used interchangeably. Ideally, S and Sp should be 100% and it should not make a difference which criterion (biomarkers or mGFR) is used to define kidney function (healthy or diseased) and which criterion is used to define the test result (positive or negative, based on a threshold). We have here demonstrated in a population of 8584 individuals aged 1 to 95 that this interchangeability is true, with S and Sp close to 90% for all age-groups, when an age-dependent threshold formGFR is used. We also evaluated the correspondence between the renal biomarker threshold of 1.33 and the measured GFR threshold of 60mL/min/1.73m2.
We observed large deviations between S (or Sp) for children and for older adults. This confirms that the use of renal biomarkers and mGFR do not correspond well when a fixed mGFR threshold for the definition of kidney disease is used, in agreement with earlier suggestions for an age-calibrated definition of mGFR-categories [34,44]. When the here defined age-dependent threshold for mGFR is used, the S and Sp remain close to 90% for all ages, including children and older adults. The fact that S and Sp do not equal 100% is most likely due to variability in the measured GFR results (different methods), variability in the biomarker assay results (different tests, intra-test variability) and non-GFR determinants.
The major strengths of our study are the large sample size and wide age-range, allowing statistical analysis per age-decade, the wide variety of measured GFR methods, and the use of calibrated assaysfor both biomarkers. Several limitations deserve attention. First, the participating study cohorts included only white participants. Second, we were not able to detect the influence of non-GFR determinants on the rescaled biomarkers' performance to diagnose renal impairment on an individual basis. Third, in contrast to measured GFR, rescaled/normalized biomarkers are not able to detect renal hyperfiltration. Fourth, in special populations like patients with abnormal muscle mass, chronic inflammation, under long-term steroid therapy, with oncologic diseases that go along with high cell turn-over, rescaled biomarkers have the same downside like traditional (non-rescaled) biomarkers or estimating equations and mGFR should be considered.
This multi-cohort study allows to determine general trends but physicians should always consider the individual patient's characteristics when making a final decision about his/her renal function [45]. We would also like to emphasize that our current work is focusing on 'detection' of impaired renal function, not on estimating GFR.
5.
C
ONCLUSIONThere is a consistent correspondence between rescaled biomarkers within the reference interval and the course of mean mGFR with age in healthy subjects, highlighting the fact that from the age of 40
years onwards mean mGFR in healthy subjects declines with age. The rescaled renal biomarkers show excellent diagnostic performance to detect impaired kidney function, across all ages, corresponding with an age-dependent threshold for mGFR .
A
CKNOWLEDGEMENTSThe Chronic Renal Insufficiency Cohort Study (CRIC) was conducted by the CRIC Investigators and supported by the National Institute of Diabetes and Digestive and Kidney Diseases (NIDDK). The data from the CRIC Study reported here were supplied by the NIDDK Central Repositories. This manuscript was not prepared in collaboration with Investigators of the CRIC study and does not necessarily reflect the opinions or views of the CRIC study, the NIDDK Central Repositories, or the NIDDK.
C
ONFLICT OF INTEREST STATEMENT The authors declare no competing interests.F
UNDINGNo specific funding was obtained for this study. Stephen T. Turner (1 R01 DK073537) was supported by research grants from the National Institutes of Health, US Public Health Service. Steven Pauwels was supported by the Fund for Clinical Research from the University Hospitals Leuven.
R
EFERENCES1. Bauer, JH, Brooks, CS, Burch R. Clinical appraisal of creatinine clearance as a measurement of glomerular filtration rate. Am J Kidney Dis. 1982; 2:337-46.
2. Pierre-Edouard Sottas GFK, Leroux J-M. Adaptive Bayesian Analysis of Serum Creatinine as a Marker for Drug-Induced Renal Impairment in an Early-Phase Clinical Trial. Clin Chem. 2012; 58:1592-6.
3. Sottas PE, Kapke GF, Leroux JM. Adaptive bayesian approach to clinical trial renal impairment biomarker signal from urea and creatinine. Int J Biol Sci. 2013; 9:156-63.
4. Perrone RD, Madias NE, Levey AS. Serum creatinine as index of renal function: new insights into old concepts. ClinChem. 1992; 38:1933-53.
5. Swedko PJ, Clark HD, Paramsothy K, Akbari A. Serum creatinine is an inadequate screening test for renal failure in elderly patients. Arch Intern Med. 2003; 163:356-60.
6. Delanaye P, Cavalier E, Radermecker RP, Paquot N, Depas G, Chapelle JP, et al. Cystatin C or creatinine for detection of stage 3 chronic kidney disease in anorexia nervosa. Nephron - Clin Pract. 2008; 110x158-63.
7. Braat E, Hoste L, De Waele L, Gheysens O, Vermeersch P, Goffin K, et al. Renal function in children and adolescents with Duchenne muscular dystrophy. Neuromuscul Disord. 2015; 25:381-7.
8. Spanaus KS, Kollerits B, Ritz E, Hersberger M, Kronenberg F, Von Eckardstein A. Serum creatinine, cystatin C, and β-trace protein in diagnostic staging and predicting progression of primary nondiabetic chronic kidney disease. Clin Chem. 2010; 56:740-9.
9. Dalton RN. Serum creatinine and glomerular filtration rate: Perception and reality. Clin Chem. 2010; 56:687-9.
10. Pottel H, Vrydags N, Mahieu B, Vandewynckele E, Croes K, Martens F. Establishing age/sex related serum creatinine reference intervals from hospital laboratory data based on different statistical methods. Clin Chim Acta. 2008; 396:49-55.
11. Ceriotti F, Boyd JC, Klein G, Henny J, Queraltó J, Kairisto V, et al. Reference intervals for serum creatinine concentrations: Assessment of available data for global application. Clin Chem. 2008; 54:559-66. 12. Ebert N, Jakob O, Gaedeke J, van der Giet M, Kuhlmann MK, Martus P, et al. Prevalence of reduced kidney function and albuminuria in older adults: the Berlin Initiative Study. Nephrol Dial Transpl. 2016; gfw079. 13. Pottel H, Hoste L, Delanaye P, Cavalier E, Martens F. Demystifying ethnic/sex differences in kidney function: Is the difference in (estimating) glomerular filtration rate or in serum creatinine concentration? Clin Chim Acta. 2012; 413:1612-7.
14. Pottel H, Hoste L, Martens F. New insights in glomerular filtration rate formulas and chronic kidney disease classification. Clin Chim Acta. 2010; 411:1341-7.
15. Pottel H, Hoste L, Martens F. A simple height-independent equation for estimating glomerular filtration rate in children. Pediatr Nephrol. 2012; 27:973-9.
16. Hoste L, Dubourg L, Selistre L, De Souza VC, Ranchin B, Hadj-Aïssa A, et al. A new equation to estimate the glomerular filtration rate in children, adolescents and young adults. Nephrol Dial Transplant. 2013; 29:944-7. 17. Pottel H, Hoste L, Martens F. Chronic Kidney Disease Chronic Kidney Disease Classification - A Simple Proposal. Eur Nephrol. 2011; 10-4.
18. Pottel H, Hoste L, Dubourg L, Ebert N, Schaeffner E, Eriksen BO et al. An estimating glomerular filtration rate equation for the full age spectrum. Nephrol dial Transpl. 2016; 31:798-806.
19. Pottel H, Delanaye P, Schaeffner E, Dubourg L, Eriksen BO, Melsom et al. Estimating Glomerular Filtration Rate for the Full Age Spectrum from Serum creatinine and cystatin C. Nephrol dial Transpl. 2017; doi: 10.1093/ndt/gfw425.
20. Grubb A, Blirup-Jensen S, Lindstrom V, Schmidt C, Althaus H, Zegers I. First certified reference material for cystatin C in human serum ERM-DA471/IFCC. Clin Chem Lab Med. 2010; 48:1619-21.
21. Bokenkamp A, Domanetzki M, Zinck R, Schumann G, Byrd D, Brodehl J. Cystatin C-a new marker of glomerular filtration rate in children independent of age and height. Pediatrics. 1998; 101:875-81.
22. Schwartz GJ, Schneider MF, Maier PS, Moxey-Mims M, Dharnidharka VR, Warady B a, et al. Improved equations estimating GFR in children with chronic kidney disease using an immunonephelometric determination of cystatin C. Kidney Int. 2012; 82:445-53.
23. Schei J, Stefansson VTN, Mathisen UD, Eriksen BO, Solbu MD, Jenssen TG, et al. Residual associations of inflammatory markers with eGFR after accounting for measured GFR in a community-based cohort without CKD. Clin J Am Soc Nephrol. 2016; 11:280-6.
24. Melsom T, Fuskevag OM, Mathisen UD, Strand H, Schei J, Jenssen T, et al. Estimated GFR is biased by non-traditional cardiovascular risk factors. Am J Nephrol. 2015; 41:7-15.
25. Rule AD, Bailey KR, Lieske JC, Peyser PA, Turner ST. Estimating the glomerular filtration rate from serum creatinine is better than from cystatin C for evaluating risk factors associated with
chronic kidney disease. Kidney Int. 2013; 83:1169-76.
26. Schaeffner ES, Ebert N, Delanaye P, Frei U, Gaedeke J, Jakob O, et al. Two novel equations to estimate kidney function in persons aged 70 years or older. Ann Intern Med. 2012; 157:471-81.
27. Kilbride HS, Stevens PE, Eaglestone G, Knight S, Carter JL, Delaney MP, et al. Accuracy of the
MDRD (Modification of Diet in Renal Disease) study and CKD-EPI (CKD Epidemiology Collaboration) equations for estimation of GFR in the elderly. Am J Kidney Dis. 2013; 61:57-66.
28. Eriksen BO, Lochen M-L, Arntzen KA, Bertelsen G, Winther Eilertsen B-A, von Hanno T, et al. Estimated and Measured GFR Associate Differently with Retinal Vasculopathy in the General Population. Nephron. 2015; 131:175-84.
29. Gagneux-Brunon A, Delanaye P, Maillard N, Fresard A, Basset T, Alamartine E, et al. Performance of creatinine and cystatin C-based glomerular filtration rate estimating equations in a European HIV-positive cohort. AIDS. 2013; 27:1573-81.
30. Ebert N, Delanaye P, Shlipak M, Jakob O, Martus P, Banel J, et al. Cystatin C standardization decreases assay variation and improves assessment of glomerular filtration rate. Clin Chim Acta. 2016;456:115-21
31. Pottel H, Dubourg L, Schaeffner E, Eriksen BO, Melsom T, Lamb EJ, Rule AD, Turner ST, Glassock RJ, De Souza V, Selistre L, Goffin K, Pauwels S, Mariat Ch, Flamant M, Bevc S, Delanaye P, Ebert N. Rationale for normalizing or rescaling single renal biomarkers and their relation with directly measured glomerular filtration rate. Data in Brief, submitted.
32. Inker LA, Schmid CH, Tighiouart H, Eckfeldt JH, Feldman HI, Greene T, et al. Estimating glomerular filtration rate from serum creatinine and cystatin C. N Engl J Med. 2012; 367:20-9.
33. Grubb A, Nyman U, Björk J. Improved estimation of glomerular filtration rate (GFR) by comparison of eGFRcystatin C and eGFRcreatinine. Scand J Clin Lab Invest. 2012; 72:73-7.
34. Delanaye P, Glassock RJ, Pottel H, Rule AD. An Age-Calibrated Definition of Chronic Kidney Disease: Rationale and Benefits. Clin Biochem Rev. 2016; 37:17-26.
35. Denic A, Lieske JC, Chakkera HA, Poggio ED, Alexander MP, Singh P, et al. The Substantial Loss of Nephrons in Healthy Human Kidneys with Aging. J Am Soc Nephrol. 2016; 28:1-8.
36. Glassock RJ, Denic A, Rule AD. The conundrums of chronic kidney disease and aging. J Nephrol. 2016; DOI: 10.1007/s40620-016-0362-x
37. Pottel H, Delanaye P, Weekers L, Selistre L, Goffin K, Gheysens O, Dubourg L. Age-dependent reference intervals for estimated and measured glomerular filtration rate. Clinical Kidney Journal. 2017; doi: 10.1093/ckj/sfx026
38. Pottel, H; Hoste, L; Yayo, E; Delanaye P. Glomerular filtration rate in healthy living potential kidney donors: a meta-analysis supporting the construction of the full age spectrum equation. Nephron 2017; 135:105-119
39. Grewal GS, Blake GM. Reference data for 51Cr-EDTA measurements of the glomerular filtration rate derived from live kidney donors. Nucl Med Commun. 2005; 26:61-5.
40. Hamilton D, Riley P, Miola U, Mousa D, Popovich W, al Khader A. Total plasma clearance of 51Q--EDTA: variation with age and sex in normal adults. Nucl Med Commun. 2000; 21:187-92.
41. Blake GM, Sibley-Allen C, Hilton R, Burnapp L, Moghul MR, Goldsmith D. Glomerular filtration rate in prospective living kidney donors. Int Urol Nephrol. 2013; 45:1445-52.
42. Soares AA, Prates AB, Weinert LS, Veronese F V, de Azevedo MJ, Silveiro SP. Reference values for glomerular filtration rate in healthy Brazilian adults. BMC Nephrol. 2013; 14:54.
43. Peters AM, Perry L, Hooker CA, Howard B, Neilly MDJ, Seshadri N, et al. Extracellular fluid volume and glomerular filtration rate in 1878 healthy potential renal transplant donors: Effects of age, gender, obesity and scaling. Nephrol Dial Transplant. 2012; 27:1429-37.
44. Pottel H, Hoste L, Delanaye P. Abnormal glomerular filtration rate in children, adolescents and young adults starts below 75 mL/min/1.73 m2. Pediatr Nephrol. 2015; 30:821-8.
45. Delanaye P, Mariat C. The applicability of eGFR equations to different populations. Nat Rev Nephrol. 2013; 9:513-22.
T
ABLES AND FIGURESTable 1: Overview of the methods for mGFR, Scr and ScysC in the 12 cohorts included for analysis
Origin mGFR Scr SCysC
Leuven, Belgium 51Cr-EDTA (4 points) Creatinine Plus, Roche enzym. Roche PETIA (Tina quant
® Gen2)
Lyon, France Inulin* Creatinine Plus, Roche enzym. Siemens PENIA (2 cohorts) iohexol (3 points)
Maribor, 51Cr-EDTA (4 points) Creatinine Plus, Roche enzym. Siemens PENIA
Slovenia
Saint-Etienne, Iohexol (2 points) Enzymatic, Orthoclinical Diagn. Siemens PENIA [29] France
Paris, France 51Cr-EDTA* Enzymatic, Siemens Siemens PENIA
CRIC, USA 125l-iothalamate* Calculated back to Creatinine Calculated back to
Siemens Plus, Roche enzym. PENIA
Troms0, Norway Iohexol (1 point) Creatinine Plus, Roche enzym Gentian PETIA [28] Rochester, USA lothalamate* Creatinine Plus, Roche enzym. Siemens PENIA [25] (2 cohorts)
Berlin, Germany Iohexol (8 points) Creatinine Plus, Roche enzym. Siemens N-Latex® PENIA [26]
Kent, UK Iohexol (3 points) IDMS Siemens PENIA [27]
For mGFR, * = urinary and plasma clearance, all other methods are plasma clearance only. mGFR = measured glomerular filtration rate; Scr = serum creatinine; ScysC = serum cystatin C
Table 2: summary of patient characteristics of the 12 cohorts (MeaniSD) ordered by mean age
Data Origin N Age (years) mGFR
(mL/min/1.73m2)
SCr/Qcrea ScysC/QcysC
Leuven (Belgium) 114 8.8 ±5.5 89.2 ±21.5 1.17 ±0.57 1.22 ±0.42 Lyon (France) 695 12.7 ±3.8 84.7 ±32.7 1.37 ±0.60 1.52 ±0.62 Maribor (Slovenia) 134 30.5 ±6.9 75.8 ±46.5 2.40 ±2.13 1.91 ±4.41 Saint-Etienne (France) 203 48.7 ± 10.3 94.7 ± 24.4 1.01 ±0.22 1.09 ±0.28 Paris (France) 1371 51.9 ± 14.4 65.5 ±27.4 1.62 ±0.90 1.65 ±0.90 Lyon (France) 852 51.8 ±14.4 77.5 ±29.3 1.29 ±0.61 1.37 ±0.64 CRIC (USA) 1534 58.6 ± 12.3 49.9 ±22.2 2.02 ±0.76 1.71 ±0.67 Troms0 (Norway) 1627 58.1 ±3.8 91.7 ±14.4 0.95 ±0.14 0.90 ±0.14 Rochester CKD (USA) 687 64.8 ± 8.8 80.4 ±21.3 1.08 ±0.26 1.01 ±0.26 Rochester KFC (USA) 406 65.9 ±9.2 79.5 ±20.7 1.05 ±0.19 0.97 ±0.20 Berlin (Germany) 567 78.5 ±6.2 60.3 ±16.4 1.22 ±0.43 1.21 ±1.11 Kent (UK) 394 80.4 ±4.6 51.5 ±18.8 1.62 ±0.75 1.52 ±0.64 Total 8584
N = total number of participants; mGFR = measured glomerular filtration rate; Scr = serum creatinine; (Qcrea = normalization factor for Scr; ScysC = serum cystatin C; QcysC = normalization factor for ScysC Table 3: overview of the mean mGFR, mean rescaled Scr and mean rescaled ScysC (with 95% CI) for
the subjects with both biomarker values within the reference interval. n Total n "normal" Age (years) Mean Age (years)
Scr/Qcrea ScysC/Qcysc mGFR
(mL/min/1.73m2)
Meta-analysis [38] mGFR(mL/min/1.73 m2)
246 135 [2-10[ 6.5 0.99 [0.96-1.02] 1.07 [1.05-1.10] 107.0 [103.2-110.9] 599 245 [10-20[ 14.7 0.99 [0.97-1.01] 1.07 [1.05-1.09] 104.6 [101.7-107.5] 227 113 [20-30[ 25.6 1.00 [0.97-1.04] 1.00 [0.97-1.03] 100.3 [96.4-104.2] 106.7 [104.6-108.9] 539 277 [30-40[ 35.0 1.01 [0.99-1.02] 0.95 [0.94-0.97] 102.4 [100.2-104.6] 104.9 [102.8-107.0] 801 407 [40-50[ 44.9 1.01 [0.99-1.03] 0.97 [0.96-0.99] 95.6 [93.9-97.3] 99.0 [96.5-101.6] 2131 1474 [50-60[ 55.3 0.97 [0.96-0.98] 0.92 [0.91-0.93] 91.8 [91.0-92.6] 91.1 [88.2-94.1] 2271 1255 [60-70[ 63.4 0.99 [0.98-1.00] 0.97 [0.96-0.97] 85.8 [84.9-86.7] 84.0 [79.5-88.5] 1285 618 [70-80[ 74.6 1.04 [1.03-1.05] 0.97 [0.96-0.98] 72.1 [71.0-73.1] 69.4 [66.1-72.7] 433 211 [80-90[ 83.1 1.05 [1.03-1.07] 1.05 [1.03-1.07] 65.6 [63.9-67.2] 52 14 >90 91.9 1.07 [0.98-1.16] 1.18 [1.12-1.23] 52.7 [47.6-57.7] 8584 4749
n "normal" = number of subjects with both rescaled biomarkers within the common reference interval of [0.67 - 1.33]. mGFR = measured glomerular filtration rate; Scr = serum creatinine; (Qcrea = normalization factor for Scr; ScysC = serum cystatin C; QcysC = normalization factor for ScysC;
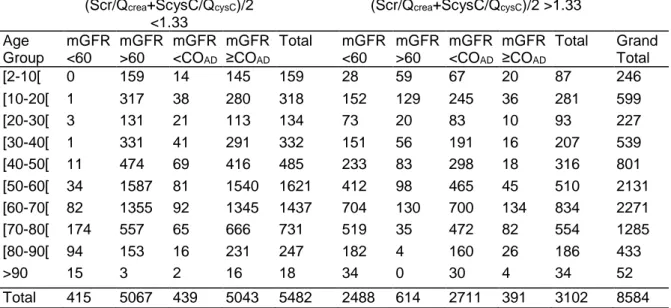
Table 4: Frequency of patients with rescaled biomarkers below and above 1.33 in the subgroups
defined by mGFR (fixed and age-dependent threshold COAD) (Scr/Qcrea+ScysC/QcysC)/2
<1.33
(Scr/Qcrea+ScysC/QcysC)/2 >1.33
Age Group mGFR <60 mGFR >60 mGFR <COAD mGFR ≥COAD Total mGFR <60 mGFR >60 mGFR <COAD mGFR ≥COAD Total Grand Total [2-10[ 0 159 14 145 159 28 59 67 20 87 246 [10-20[ 1 317 38 280 318 152 129 245 36 281 599 [20-30[ 3 131 21 113 134 73 20 83 10 93 227 [30-40[ 1 331 41 291 332 151 56 191 16 207 539 [40-50[ 11 474 69 416 485 233 83 298 18 316 801 [50-60[ 34 1587 81 1540 1621 412 98 465 45 510 2131 [60-70[ 82 1355 92 1345 1437 704 130 700 134 834 2271 [70-80[ 174 557 65 666 731 519 35 472 82 554 1285 [80-90[ 94 153 16 231 247 182 4 160 26 186 433 >90 15 3 2 16 18 34 0 30 4 34 52 Total 415 5067 439 5043 5482 2488 614 2711 391 3102 8584 mGFR = measured glomerular filtration rate; Scr = serum creatinine; Qcrea = normalization factor for
Scr; ScysC = serum cystatin C; QcysC = normalization factor for ScysC; COAD = age-dependent cutoff
for mGFR
Figure 1a: Sensitivity is presented by age-category (Table 4). Solid circles represent the first scenario in which a true positive test result is defined as (Scr/Qcrea+ScysC/QcysC)/2>1.33 in the subgroup with
mGFR<60mL/min/1.73m2. The open circles represent the third scenario in which a true positive test
result is defined as mGFR<60mL/min/1.73m2 in the subgroup with (Scr/Qcrea+ScysC/Qcysc)/2>1.33.
Figure 1b: Specificity is presented by age-category (Table 4). Solid circles represent the first scenario in which a true negative test result is defined as (Scr/Qcrea+ScysC/QcysC)/2 ≤1.33 in the subgroup with
mGFR≥60mL/min/1.73m2. The open circles represent the third scenario in which a true negative test
result is defined as mGFR≥60mL/min/1.73m2 in the subgroup with (Scr/Qcrea+ScysC/Qcysc)/2≤1.33.
Error bars are defined as
Figure 2a: Sensitivity is presented by age-category (Table 4). Solid circles represent the second scenario in which a true positive test result is defined as (Scr/Qcrea+ScysC/QcysC)/2>1.33 in the
subgroup with mGFR<GFRCO∙ The open circles represent the third scenario in which a true positive
test result is definedas mGFR<GFRco in the subgroup with (Scr/Qcrea+ScysC/Qcysc)/2>1.33. Error bars
Figure 2b: Specificity is presented by age-catgory (Table 4). Solid circles represent the second scenario in which a true negative test result is defined as (Scr/Qcrea+ScysC/QcysC)/2 ≤1.33 in the
subgroup with mGFR≥GFRCO∙ The open circles represent the third scenario in which a true negative
test result is defined as mGFR ≥GFRco in the subgroup with (Scr/Qcrea+ScysC/Qcysc)/2<1.33. Error