The shift toward protectionism became more pronounced in 2018 and 2019. Two trends in particular may have wide- ranging repercussions: (1) the considerable increase in trade tensions in 2018 among the major world economies, combined with a marked increase in the number of disputes submitted to the dispute settlement mechanism of the World Trade
Global environment
The global trade picture changed
dramatically in late 2016 and early 2017. Protectionism resurfaced, fostered by a challenging Doha Round and following on the heels of the British referendum supporting Brexit from the European Union and the new United States administration.
and the Caribbean
David Laborde and Valeria Piñeiro
To better understand the likely impacts for Latin America and the Caribbean
of developments in global trade, we modeled a set of four scenarios to see
how escalating trade tensions would affect the region’s economies and the
potential for a regional response to mitigate possible negative impacts. This
article reviews the results of that modeling exercise.
Organization; and (2) the measures taken by the United States to increase import tariffs, particularly on China, which have triggered reprisals and counter-reprisals.
In Latin America and the Caribbean (LAC), these trends are expected to affect exporters of food products in two ways. First, the ripple effect from the reduction of US food exports to China (the United States is the world’s largest food exporter) could open up new opportunities; and second, an economic slowdown in China and/or the United
States could reduce the global demand for commodities.
Latin American countries should be monitoring the US–China trade relationship, given the important role these economies play through trade in the LAC region. Figure 1 shows that China accounts for 13 percent of total agricultural exports from LAC, and the United States accounts for 21 percent. On the import side, the United States accounts for 44 percent of LAC’s agricultural imports while agricultural imports from China are insignificant. Figure 1: LAC agricultural trade: China and the US as key partners
(average 2014–2016)
Short term versus long
term
The current tit-for-tat game between the United States and its trading partners is expected to generate a mix of opportunities and threats for LAC countries, both in the short and long term, as indicated by Bouët and Laborde (2018) in an initial assessment of these trade tensions.
The escalation of tariffs and reprisals between the United States and China could create short-term gains for Mexico and other Latin American countries. An increase in the prices of some imports for Chinese or American consumers could allow LAC countries to replace either US or Chinese exports on their reciprocal markets. However, opportunities will depend on the specific product, the distribution channels, the ability to supply the necessary quantity, and the extent to which the cost
increase for Chinese and US products is transferred to the final consumer.
In the longer term, these short-terms gains could easily be reversed by dynamic effects. Exporters punished by the tariffs may dump their exports on third markets or lobby for subsidies from their national governments, responses that would increase global market distortions. Also, the “fake” comparative advantages created by punitive tariffs would disappear when the trade wars end, leaving unfruitful investments. Resulting uncertainties in the global
economy would reduce demand for many products and trigger more protectionist policies.
Heterogeneity within the
region
While we understand the importance of these two partners for LAC countries, we should not forget the high level of heterogeneity within the region. LAC countries are engaged with these partners to varying degrees and specialize in different export products. Their exposure to changes in tariffs in various markets and products therefore varies. Indeed, when tariffs are increased in trade wars, an opportunity may be created for an uninvolved country to export to a country involved in the trade war.
Figure 2 shows a clustering of countries by major export commodity basket (by value). The Mercosur countries are major exporters of soy, cereals, and animal protein. Chile, Ecuador, French Guiana, and Peru primarily export fruits and fishery products. Coffee, sugar, and fruits are important exports for Colombia, and fruits and cereals are key for Bolivia, Costa Rica, Guyana, Honduras, Mexico, and Venezuela. The major food exports of El Salvador and Guatemala are coffee and cereals. Nicaragua is the only country primarily exporting coffee and animal protein. This clustering provides important information for analyzing the heterogeneous effects of trade tensions in LAC countries.
We also consider the export structure of LAC countries to see which are competitive in the same goods as either the United States or China, and hence could replace the imports of the country involved in the trade tension.
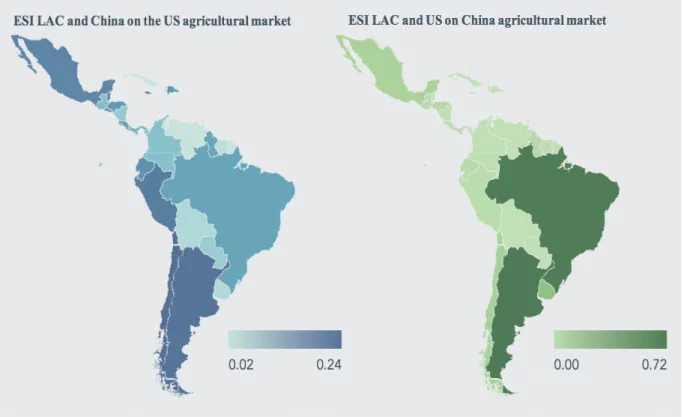
One tool for analyzing how competitiveness affects the impact of trade tensions in countries not directly involved in the conflict is the Export Similarity Index (ESI) (Finger
and Kreinin 1979), which measures the similarity between exports of any two countries to a third market.1 Figure 3 illustrates the ESI for LAC country agricultural exports to the US market as compared to China’s exports, and LAC agricultural exports to China’s market as compared to US exports. An index value close to one suggests that the two countries analyzed are perfect competitors (very similar) in the third market. An index Figure 2: Major export commodity basket
by country (by value)
Source: World Integrated Trade Solution (https://wits.world- bank.org/).
1 The index is based on the share of each product in each country’s total exports and is calculated as the sum of the minimum value for each product:
where ESI(ab,c) refers to the export similarity index of countries a and b in the common market (c), Xj(a,c)
refers the exports of product j from country a to country c and similarly Xj(b,c) refers tothe exports of product j from country b to country c, ΣX(a,c) and ΣX(b,c) are total exports of country a and b to country c, respectively.
value close to zero suggests that there is no competition at all between the two countries in this market.
Argentina and Brazil are similar to the United States in the Chinese agricultural market (as exporters of soy), according to the ESI, meaning they are very competitive with the United States. Looking at the Index for LAC and China on the US agricultural market, the numbers are both more homogeneous and smaller, meaning LAC is less competitive with China in the US agricultural market. Although Chile,
Argentina, Jamaica, and Peru, like China, all sell aquaculture products (fish) and vegetables and fruits to the United States, the values are small.
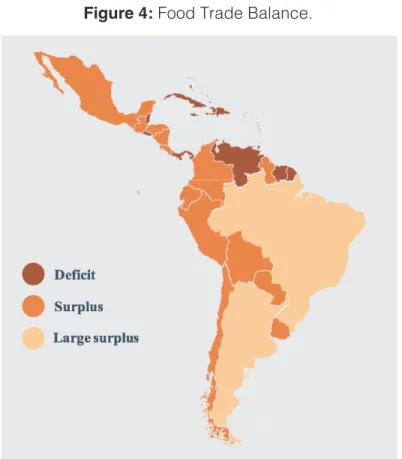
In addition, the food trade balances of the LAC countries will also influence the impact of the trade tensions in their respective economies (Figure 4). For example, Argentina and Brazil, which have a large food trade surplus, will experience different impacts than the Caribbean, Belize, El Salvador, French Guiana, Panama, Suriname and Venezuela, which all have a food trade deficit.
Figure 3: Export Similarity Index
Implications of trade
tensions
The uncertain global trade situation makes it difficult to predict how things will develop in the coming months. We can envisage several possible scenarios, all with very different consequences for the global economy and political relations between countries. For our analysis, we selected the following four scenarios to represent the broad range of possible situations. 1. US vs. China—Status quo. Focuses
on the economic consequences of the current trade tensions between the United States and China. This scenario
is based on the state of trade disputes, including tariffs proposed and/or implemented by the US and Chinese governments up to December 2018 and considers both agricultural and non-agricultural products.
2. Extended US trade tensions. Includes the measures listed in the first scenario, plus all other retaliation announced by the United States and China in the first half of 2019. It also includes the steel and aluminum tariff increases initiated by the United States and the retaliation measures taken by Canada, the European Union, India, Mexico, and Turkey.
Figure 4: Food Trade Balance.
3. Escalating trade wars. Explores the possibility of an escalation of trade wars between the United States, China, and other countries. This scenario mimics noncooperative behavior as seen during the global collapse episodes of the 1870s and 1930s, and reflects a contagion scenario using the game theory approach developed in Bouët and Laborde (2018).
4. Intra-LAC integration. Considers the current trade tensions between the United States and China plus a mitigation strategy implemented by LAC countries that reduces transportation costs and increases intraregional integration.
While our analysis focuses on the
agriculture and agribusiness sectors, it is important to capture both the agricultural and non-agricultural elements of the trade tensions. Tensions generated in non-agricultural sectors (e.g., steel tariffs) could lead to retaliation in agriculture to hurt a partner’s main exports. Moreover, some macroeconomic constraints—both domestic (investments, labor mobility) and external (global growth, exchange rate)—are not specific to agriculture but
directly affect the agricultural system (see a discussion of these issues in Díaz-Bonilla, 2015).
Using the MIRAGRODEP2 model, we assess the impacts of these scenarios from 2018 to 2030 for various LAC countries in terms of a large number of economic variables including exports, imports, production, GDP, household consumption, and adjustment costs through changes in labor markets. Figure 5 shows that the first round of rising protectionism (the “status quo” scenario) will benefit the LAC region’s exports, particularly agricultural exports (up 2.1 percent versus a 1.2 percent increase for non-agricultural goods). While agricultural exports benefit most at the regional level, impacts within the region are heterogenous. The Andean region will maintain a balanced profile, and the Mercosur countries will strengthen their agricultural exports and reduce industrial exports to benefit from more attractive commodity markets in China. But Central America, Mexico, and the Caribbean will increase their specialization in non-agricultural products to occupy the space created by the trade restrictions on Chinese products in the US market.
2 MIRAGRODEP is a Computable General Equilibrium (CGE) model based on the MIRAGE (Modelling International Relationships under Applied General Equilibrium) model. In its standard version, MIRAGRODEP is a recursive, dynamic, multi-region, multisector model. In MIRAGRODEP, the government is explicitly modeled as different from private agents. Government income consists of taxes collected on production, on factors of production, on exports, on imports, on consumption, and on households’ income.
For this study, the main source of data is the GTAP 10 version with 28 sectors and 33 regions (23 individual countries or subregions in LAC).
It is interesting to note that the agricultural exports of the Mercosur countries will increase by 3.6 percent, driven largely by an 11 percent increase in total soybean exports from LAC
countries. However, exports of processed food products, including soybean oils and meals, will decline slightly due to the specific appetite of the Chinese market for beans. This will challenge the soybean processing strategy of some countries in the region, such as Argentina.
The continuation of the current trade conflict, captured by the “extended US trade tensions” scenario, will begin to neutralize these positive impacts. Overall agricultural exports will increase by less than 1 percent under this
scenario as distortions in global markets increase. LAC products avoid direct tariff increases, and market opportunities expand for LAC products as they replace US products on additional third markets. However, LAC exports are also Figure 5: LAC export value variations driven by trade war scenarios
Source: Authors, MIRAGRODEP CGE simulations.
Agro-food Other industries
Ch an ges in exp or ts (%), s cen ar io vs b as elin e in 2030
negatively affected by a contraction of global demand. For example, although the Mexican economy still benefits from preferential access to US markets, Mexican non-agricultural exports expand at a slower pace.
The “escalating trade wars” scenario, with large tariff increases, shows world trade in goods shrinking by 27 percent. LAC countries are slightly better off than the world average, with LAC non-agricultural exports decreasing by 24 percent and agricultural exports decreasing by only 17 percent. The resilience of agricultural exports to such shocks has been observed during the Great Trade Collapse of 2008, when world trade fell by about 30 percent. This resilience can be explained by the relative inelasticity of food demand and the fact that some importing countries cannot cut themselves off from food markets. Looking at LAC countries, it is evident that they cannot use high tariffs to strengthen their situation in a tit-for-tat game due to their limited market size, and will not disconnect themselves from world markets on the import side either. All subregions of LAC will suffer negative impacts but with slight variations. Two interesting findings should be highlighted: Mexico will suffer the largest impact (a 26 percent decrease in agro-food exports and a 36 percent decrease for other industries), reflecting a tariff increase Mexico implements to retaliate against the United States and limit the terms of trade costs imposed by US policies. In the Mercosur region, agricultural exports will fall more than non-agricultural exports due to the bloc’s specialization
in commodities that are relatively more sensitive to price variations.
The “intra-LAC integration” scenario shows the potential gains for LAC countries if they implement a mitigation strategy to address the current US–China trade tensions based on increasing regional integration—namely, by decreasing transportation costs and eliminating intraregional import tariffs. Under this scenario, LAC will see an increase of 5 percent in agro-food exports and another 4 percent increase in other industries. As with the other scenarios, impacts vary by country, but the mitigation scenario will afford gains in all LAC
countries. Central America, Mexico, and the Caribbean see a larger gain in other industries exports compared with agro-food exports; other LAC countries will see larger gains in agro-food exports. Of note in this scenario, Mercosur countries will benefit the least from intraregional integration given that they will not increase soybean exports to other LAC countries. However, greater integration will help them become less specialized and sensitive to their outward orientation. Figure 6 shows the impact of the four scenarios on real GDP. This variable highlights the potential gains for some countries under the first two scenarios, and the economic contraction both of the region as a whole and within the region under the “escalating trade wars” scenario.” Under the mitigation scenario, there is a positive impact in LAC countries, with increases in real GDP ranging from 0.1 to 0.8 percent over the baseline in 2030.
Final comments
How will producers and agricultural value-chain stakeholders across the globe adjust their operations in anticipation of a potential US–China agreement or continuing disputes? What is the impact on LAC countries of trade tensions and what are their options for response? Knowing the answers to these questions can ensure
countries can react to escalating trade tensions in an effective and timely manner.
Short-term effects...
LAC countries enjoy an advantage in the short term as the escalation of tariffs and reprisals between the United States and China will allow them to replace either US or Chinese exports on their reciprocal markets as the prices of some imports Figure 6: LAC real GDP variations driven
by trade war scenarios
increase for Chinese and/or American consumers. The soy market provides a clear example. The price difference between US (New Orleans) and Brazilian (Paranagua) soybeans reached a historic high in September 2018. As trade
tensions led China to replace US soybean imports with imports from other countries (Brazil and Argentina), Brazilian soybean prices rose and the price gap widened. If this situation continues, the US could end up with a soybean surplus that would drive down domestic prices and/or lead to dumping on other markets.
... with long-term repercussions
A prolonged period of moderate trade growth would affect medium-termproductivity growth and, therefore, longer-term growth prospects through investment decisions that could increase global distortions.
There is a risk of increased competition (and potential dumping) as US exporters increase exports to LAC and displace producers within LAC as demand contracts and quantities exported from LAC to China fall and commodity prices drop.
Taking the soy market as an example again, two possible long-term outcomes merit attention. First, as the Mercosur countries expand their export and storage capabilities, they can increasingly store agricultural products into the US harvest
period, reducing the pressure to sell immediately. Second, the US soybean industry could expand its production capabilities.
What should be the region’s
strategy to manage this situation?
The impact in Latin America of the US– China trade dispute and the resulting reordering of the world economy forces us to think of new strategies. While the level of intra-LAC heterogeneity could be a major challenge to defining a collective action agenda, it could also be a great asset. As our modeling exercise shows, an effective LAC mitigation strategy could help the region avoid the negative impacts of current trade tensions. Components of the mitigation strategy could include intraregional preferential trade agreements and investments to reduce transportation costs. Additionally, harmonization of phytosanitaryregulations and food quality standards could contribute to increased intraregional trade and thus improve resilience to external trade shocks.
While pushing to strengthen the multilateral systems with like-minded countries, LAC countries should embark on a proactive strategy for greater integration within the region as a tool to mitigate the negative effects of trade tensions as well as a development strategy.
References
Bouët, A., and D. Laborde. 2018. “US Trade Wars in the Twenty-First Century with Emerging Countries: Make America and Its Partners Lose Again.” World Economy 41: 2276–2319.
Díaz-Bonilla, E. 2015. Macroeconomics, Agriculture, and Food Security: A Guide to Policy Analysis in
Developing Countries. Washington, DC: International Food Policy Research Institute.
Finger, J. M., and M. E. Kreinin. 1979. “Measure of Export Similarity and Its Possible Uses.” Economic
Journal 89: 905–912.
Inter-American Institute for Cooperation on Agriculture Headquarters. P.O. Box 55-2200.
San José, Vázquez de Coronado, San Isidro 11101 - Costa Rica Telephone: (+506) 2216 0222 • Fax: (+506) 2216 0233
E-mail: iicahq@iica.int • Web Site: www.iica.int
This work was undertaken as part of the CGIAR Research Program on Policies, Institutions, and Markets (PIM) led by the International Food Policy Research Institute (IFPRI). Funding support for this study was provided by the Inter-American Institute for Cooperation on Agriculture (IICA) and PIM. This publication has not been peer reviewed and the opinions expressed here are those of the authors and are not necessarily representative of or endorsed by IICA, PIM, IFPRI, or CGIAR.