THÈSE
En vue de l'obtention du
DOCTORAT DE L’UNIVERSITÉ DE TOULOUSE
Délivré par l’Université Toulouse 3 – Paul Sabatier Discipline ou spécialité : Informatique
JURY
Maria de Fátima Queiroz Vieira (rapporteur) Francisco Javier Sáez Nieto (rapporteur)
Jean-Claude Tarby (examinateur) Yamin Ait Ameur (examinateur) Philippe Palanque (directeur de thèse)
Célia Martinie (co-encadrant) Alberto Pasquini (co-encadrant)
Ecole doctorale: Mathématiques Informatique et Télécommunications de Toulouse (MITT) Unité de recherche: IRIT – UMR 5505
Directeur(s) de Thèse: Philippe Palanque et Célia Martinie
Rapporteurs: Maria de Fátima Queiroz Vieira et Francisco Javier Sáez Nieto Présentée et soutenue par Martina Ragosta
Le 7 mai 2015
Titre : A multi-modelS based approach for the modelling and the analysis of usable and
Acknowledgements
Broadly speaking and, like as a good PhD student looking at the other theses trying to make a state of the art for this section, there seems to be an order for listing the persons who is needed to acknowledge: supervisors (main and second), academic and technical staff in the department, colleagues, institutions and organization, companies, and finally family and friends. Even if I tried with all my might and main, I cannot be sure that the suggested sequence has been properly followed for two main reasons. The former is that most of the persons have played more than one role making difficult the distinction between professional and personal life. The latter is that each person has been so important that list them, all of them (giving a priority), it is quite hard. So, I would like to start saying “Merci beaucoup”, “Muy obrigada”, “Grazie mille”, “Muchas gracias”, “Vielen Danke”,
“Tusen takk” to ALL!
I would like to express my gratitude to Philippe as supervisor. He would have never accepted anything less than my best efforts, and for that, I thank him. As well as inspiring me on an academic level, I have learnt so many other things from Philippe! I really feel lucky to have had a supervisor that I can also call a friend, someone who I was able to laugh with even when the thesis and everything else around me was driving me crazy. Thanks to him, each day that I spent in Toulouse and in the ICS team has been a beautiful day (“che bella giornata!”).
I would like to express my deepest appreciation to my co-supervisor, Célia, for her excellent guidance, caring, patience, and providing me with an excellent atmosphere for doing research. We have shared so many things… I don’t know if my high regard for Célia is more for her as a precious friend or for her as an inestimable co-supervisor. I would just to say “Merci de tout coeur” to Célia for being simply Célia with me.
Both, Philippe and Célia, have shown the attitude and the substance of a genius: they continually and persuasively conveyed a spirit of adventure in regard to research and an excitement in regard to teaching. Without their supervision and constant help this dissertation would not have been possible. I would like to express my gratitude to everyone who supported me throughout the course of this PhD thesis. I am thankful for their aspiring guidance, invaluably constructive criticism and friendly advice during these years. I am sincerely grateful to them for sharing their truthful and illuminating views on a number of issues related (or not) to this research activity.
The ICS team: Eric Barboni, David Navarre, Racim, Arnaud Hamon, Caio, José, Cédric Bach, Adrienne Tankeu-Choitat, Christelle Farenc. In particular, Marco and Camille who are very good friends. They were always willing to help and give their best suggestions. All of you are really ICS women and men, my super heroes!
The Ruido team: Regina Bernhaupt, Thomas Mirlacher and the “BB” guys. In particular, Michael Pirker, my Geppi.
The Hala! Network: Paco for each beer drunk together, for each smile and hug, for putting his trust in me. I always felt his support and friendship. Eduardo for his availability, his presence, and his courage. For all the moments (and places) in which our lives have crossed and for his positive attitude in looking at the daily difficulties. The other PhD students…in particular, my German and “E”Spanish friends. We have shared working and personal worries and, thanks to this reciprocal support, we have
grown up. I will forever remember in my heart the stories and the moments that all of you have shared with me during these years.
The All Deep Blue colleagues: Simone and Luca who saw something in me I didn't see in myself, my darling Paola, Sara who has been a disciple of Mr. Miyagi and we know what this means, Alberto who, before being my boss, is one of my favourite traveling and adventure companions. To All DBluers, I would like to express my warm thanks to and for their support and understanding.
I would also like to thank my parents. They were always suppor ting me and encouraging me with their best wishes. I always knew that you believed in me and wanted the best for me.
Finally, I would like to thank my friends that were always there cheering me up and stood by me through the good and bad times. Thank you for teaching me that my job in life was to learn, to be happy, and to know and understand myself; only then could I know and understand others. It is impossible to list all of you, but you are the bright part of my soul.
This PhD has been one of the most difficult challenges, but also, one of the best and unforgettable experiences in my life only thanks to all of you!
Table of content
Table of content ... 5
List of figures ... 8
List of tables ... 11
Introduction ... 15
PART I – State Of the Art ... 21
Chapter 1 – Addressing human activities through task modelling techniques and associated
methods ... 22
1 Task analysis and modelling to support analysis and assessment of usability and resilience of partly autonomous interactive systems ... 22
2 State of the art on task modelling techniques and associated methods ... 24
2.1 An overview of task modelling techniques and associated methods ... 25
2.2 Focus on the Human-centered Assessment and Modelling to Support Task Engineering for Resilient Systems version 1.0 (HAMSTERS 1.0) ... 27
3 Identify requirements for existing task modelling techniques and associated methods: what is still missing ... 29
4 Comparison of task modelling techniques and associated methods according to the identified requirements ... 33
5 Conclusion, lessons learnt and way forward ... 35
Chapter 2 – Addressing partly autonomous interactive systems and user interactions
through modelling techniques and associated methods ... 37
1 System analysis and modelling to support analysis and assessment of usability and resilience of partly autonomous interactive systems... 37
2 State of the art on system modelling techniques and associated methods ... 41
2.1 An overview of exiting system modelling techniques and associated methods ... 41
2.2 Focus on the Interactive Cooperative Objects (ICOs) and its associated CASE tool PetShop ... 43
3 Identify requirements for existing system modelling techniques and associated methods: what is still missing ... 45
4 Comparison of system modelling techniques and associated methods according to the identified requirements ... 47
5 Conclusion, lessons learnt and way forward ... 49
Chapter 3 – Addressing organizational aspects through modelling techniques and
associated methods ... 51
1 Resilience analysis and modelling to support analysis and assessment of usability and
resilience of partly autonomous interactive systems... 51
2 State of the art on modelling techniques and associated methods for resilience analysis .. 54
2.1 An overview of modelling techniques and associated methods for resilience analysis ... 55
2.2 Focus on the Functional Resonance Analysis Method (FRAM) ... 59
3 Identify requirements for existing resilience modelling techniques and associated methods: what is still missing ... 61
4 Comparison of modelling techniques and associated methods for resilience analysis according to the identified requirements ... 63
5 Conclusion, lessons learnt and way forward ... 65
PART II – Contributions ... 67
Chapter 4 – The HAMSTERS extensions ... 68
1 Representation of Knowledge and Information inside HAMSTERS 2.0 task models ... 68
2 Representation of Knowledge, Information and Objects linked to HAMSTERS 2.0 task models ... 69
3 An illustrative example: The Game of 15 ... 71
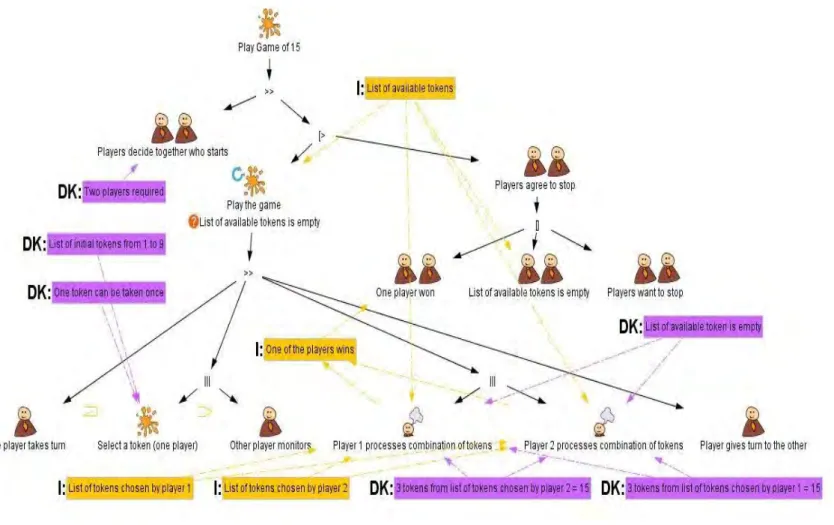
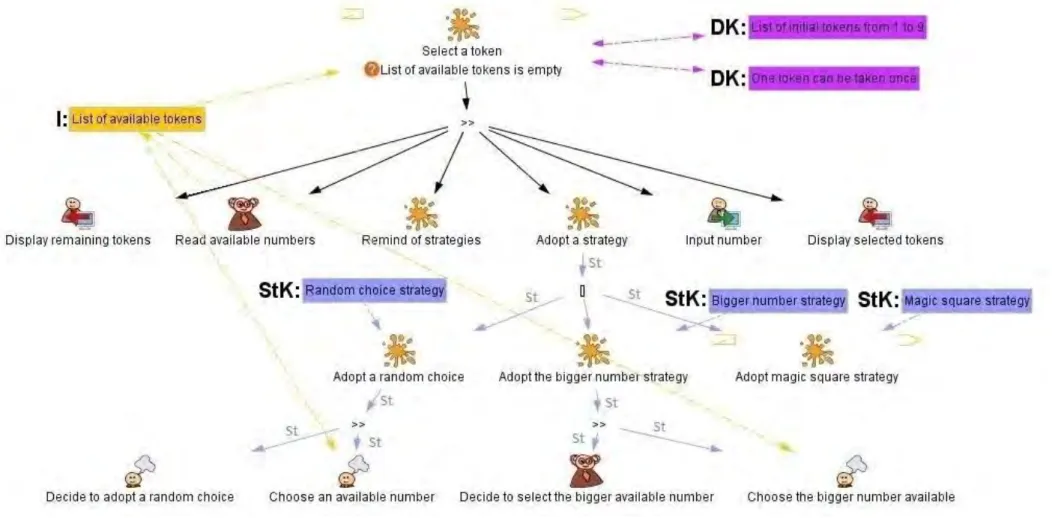
3.1 Task models of Game of 15 ... 71
3.2 Concept map of Game of 15 ... 75
4 Conclusion ... 76
Chapter 5 – The multi-models based approach for modelling and analysing a partly
autonomous interactive system within Socio-Technical Systems ... 80
1 The multi-modelS based approach ... 80
1.1 The Definition phase ... 84
1.2 The Modelling phase ... 86
1.2.1 The Identification/Description/Modelling sub-phase ... 86
1.2.2 The Integration of the Models sub-phase ... 88
1.2.2.1 The correspondences assessment between models at tool level ... 90
1.2.2.2 The correspondences assessment between models at model level ... 91
1.3 The Evaluation phase ... 92
1.3.1 The Variability assessment sub-phase ... 93
1.3.2 The Coverage of the performance objectives sub-phase ... 95
1.4 The Analysis phase ... 96
1.4.1 The Identification of re-design opportunities sub-phase ... 97
1.4.2 The Identification of further investigations opportunities sub-phase ... 98
2 An illustrative example: The Game of 15 ... 100
2.1 The Definition phase applied to the Game of 15 ... 100
2.2 The Modelling phase applied to the Game of 15 ... 101
2.2.1 The Identification/Description/Modelling sub-phase applied to the Game of 15 ... 101
2.2.1 The Integration of the Models sub-phase applied to the Game of 15... 117 2.2.1.1 The correspondences assessment between models at tool level applied to the Game of 15
2.2.1.1 The correspondences assessment between models at model level applied to the Game of
15 118
2.3 The Evaluation phase applied to the Game of 15 ... 119
2.3.1 The Variability assessment sub-phase applied to the Game of 15 ... 120
2.3.2 The Coverage of the performance objectives sub-phase applied to the Game of 15 ... 125
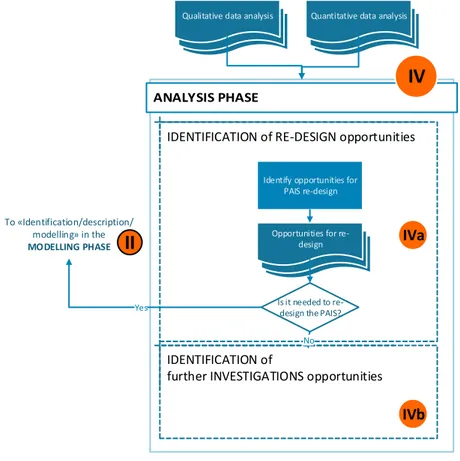
2.4 The Analysis phase applied to the Game of 15 ... 126
2.4.1 The Identification of re-design opportunities sub-phase applied to the Game of 15 ... 126
2.4.2 The Identification of further investigations opportunities sub-phase applied to the Game of 15 128 3 Conclusion ... 128
Chapter 6 – A partly autonomous interactive system: the weather radar (WXR) case study
... 130
1 The Definition phase applied to the WXR case study ... 130
2 The Modelling phase applied to the WXR case study ... 134
2.1.1 The Identification/Description/Modelling sub-phase applied to the WXR case study ... 134
2.1.2 The Integration of the Models sub-phase applied to the WXR case study ... 184
2.1.2.1 The correspondences assessment between models at tool level applied to the WXR case study 184 2.1.2.2 The correspondences assessment between models at model level applied to the WXR case study 185 3 The Evaluation phase applied to the WXR case study ... 186
3.1.1 The Variability assessment sub-phase applied to the WXR case study ... 186
3.1.2 The Coverage of the performance objectives sub-phase applied to the WXR case study ... 195
4 The Analysis phase applied to the WXR case study ... 196
4.1.1 The Identification of re-design opportunities sub-phase applied to the WXR case study ... 196
4.1.2 The Identification of further investigations opportunities sub-phase applied to the WXR case study 200 5 Conclusion ... 200
Conclusions ... 202
Perspectives ... 205
Personal publications ... 207
References ... 209
Abstract ... 233
Résumé ... 235
Annex ... 236
The Definition phase applied to the WXR scenario ... 236
The Modelling phase applied to the WXR scenario ... 236
List of figures
FIGURE 1:THE ENHANCEMENT OF INTEGRATED AUTOMATION SUPPORT IN ATCS AND COCKPITS OVER TIME ... 16
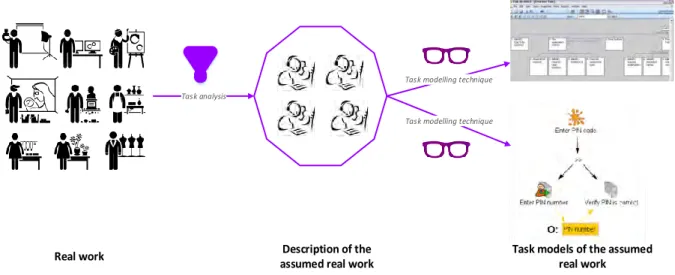
FIGURE 2:TASK ANALYSIS AND MODELLING TO REPRESENT THE REAL WORK ... 23
FIGURE 3:HIGH-LEVEL TASK TYPES IN HAMSTERS1.0 ... 27
FIGURE 4:RELATIONSHIPS BETWEEN TASKS AND OBJECTS IN HAMSTERS1.0 ... 28
FIGURE 5:RELATIONSHIP WITH OBJECTS IN HAMSTERS1.0 ... 29
FIGURE 6:DISTRIBUTION CURVE OF NUMBER OF FUNCTIONS RELATED TO LEVELS OF AUTOMATION... 39
FIGURE 7:DISTRIBUTION CURVE OF TEST AND AUTO TEST OF WEATHER RADAR APPLICATION ... 39
FIGURE 8:GENERAL ARCHITECTURE OF AN INTERACTIVE SYSTEM (ADAPTED AND TAKEN FROM (MARTINIE,2011)) ... 40
FIGURE 9:SYSTEM ANALYSIS AND MODELLING TO REPRESENT REAL SYSTEMS ... 40
FIGURE 10:THE ITERATIVE MODEL-BASED DESIGN LIFE CYCLE USING BOTH TASKS AND SYSTEM MODELS (TAKEN FROM (MARTINIE, ET AL.,2011)) ... 50
FIGURE 11:RESILIENCE FOUR MAIN ABILITIES (TAKEN FROM (HOLLNAGEL,2011)) ... 52
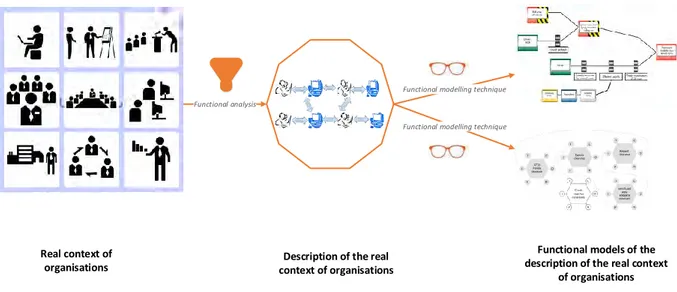
FIGURE 12:FUNCTIONAL METHODS AND MODELLING TECHNIQUES TO REPRESENT THE REAL CONTEXT OF ORGANISATIONS ... 54
FIGURE 13:AFRAM FUNCTION WITH ITS 6 ASPECTS (TAKEN AND ADAPTED FROM (HOLLNAGEL,2004)) ... 60
FIGURE 14:REPRESENTATION OF DECLARATIVE KNOWLEDGE A) WHICH CAN BE FURTHER REFINED INTO STRATEGIC B) AND SITUATIONAL C) ... 69
FIGURE 15:REPRESENTATION OF A CONCEPT OF INFORMATION TYPE ... 69
FIGURE 16:REPRESENTATION OF PROCEDURAL KNOWLEDGE REFINED INTO STRATEGIC A) AND SITUATIONAL B) ... 69
FIGURE 17:EXAMPLE OF A USER INTERFACE FOR PLAYING GAME OF 15 ... 71
FIGURE 18:HAMSTERS2.0 MODEL OF GAME OF 15– MAIN TASK TO PLAY THE GAME ... 73
FIGURE 19:HAMSTERS2.0 MODEL OF GAME OF 15- SUBROUTINE CORRESPONDING TO THE TASK SELECT TOKEN IN FIGURE 18 ... 74
FIGURE 20:CONCEPT MAP OF GAME OF 15 ... 75
FIGURE 21:KEY OF THE PROCESS DIAGRAM ... 81
FIGURE 22:THE PROCESS TO MODEL AND ANALYSE A PARTLY AUTONOMOUS INTERACTIVE SYSTEM WITHIN A SOCIO-TECHNICAL SYSTEM ... 82
FIGURE 23:THE DEFINITION PHASE ... 85
FIGURE 24:MODELLING PHASE –IDENTIFICATION/DESCRIPTION/MODELLING SUB-PHASE IIA ... 87
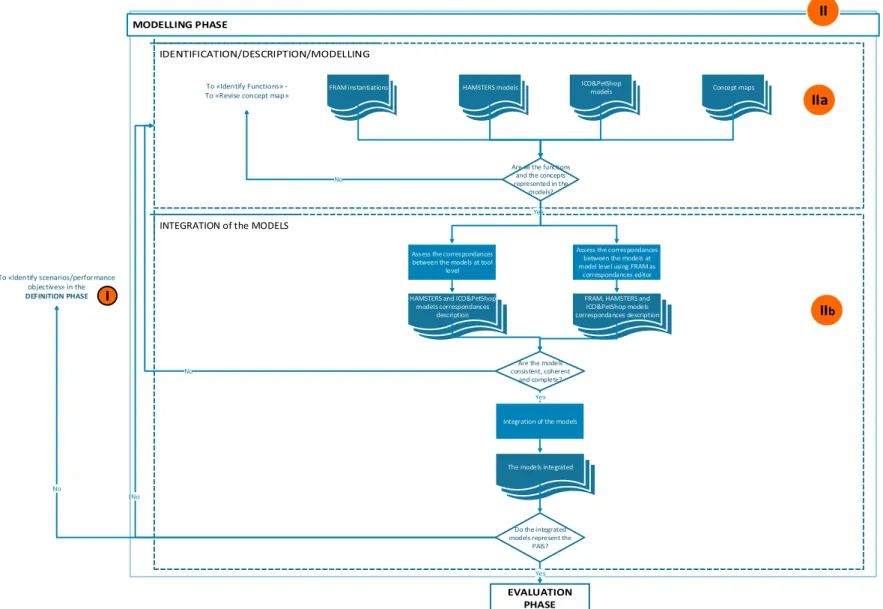
FIGURE 25:MODELLING PHASE –INTEGRATION OF THE MODELS SUB-PHASE IIB ... 89
FIGURE 26:THE ROLE OF FRAM AS CORRESPONDENCE EDITOR ... 91
FIGURE 27:ILLUSTRATIVE EXAMPLE OF THE ROLE OF FRAM AS CORRESPONDENCE EDITOR ... 92
FIGURE 28:THE EVALUATION PHASE ... 93
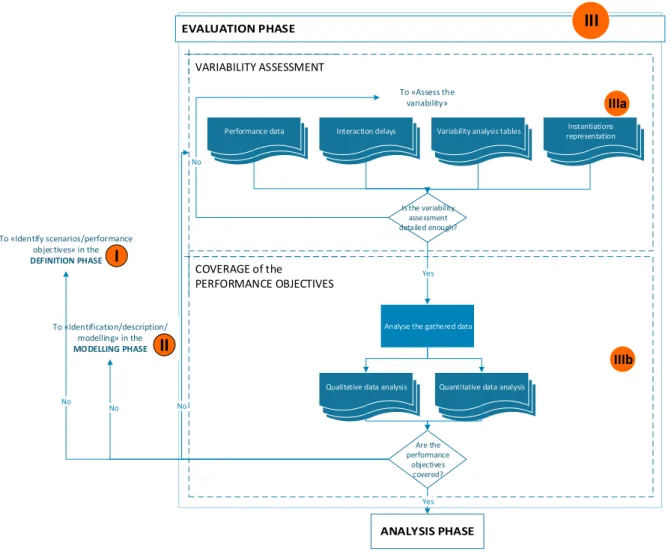
FIGURE 29:EVALUATION PHASE –VARIABILITY ASSESSMENT SUB-PHASE IIIA ... 94
FIGURE 30:EVALUATION PHASE –COVERAGE OF THE PERFORMANCE OBJECTIVES SUB-PHASE IIIB ... 96
FIGURE 31:THE ANALYSIS PHASE ... 97
FIGURE 32:ANALYSIS PHASE –IDENTIFICATION OF RE-DESIGN OPPORTUNITIES SUB-PHASE IVA ... 98
FIGURE 33:ANALYSIS PHASE –IDENTIFICATION OF FURTHER INVESTIGATIONS OPPORTUNITIES SUB-PHASE IVB ... 99
FIGURE 34:GAME OF 15 TIMELINE ... 102
FIGURE 35:"START TO PLAY GAME OF 15" FUNCTION AS FRAM UNIT ... 103
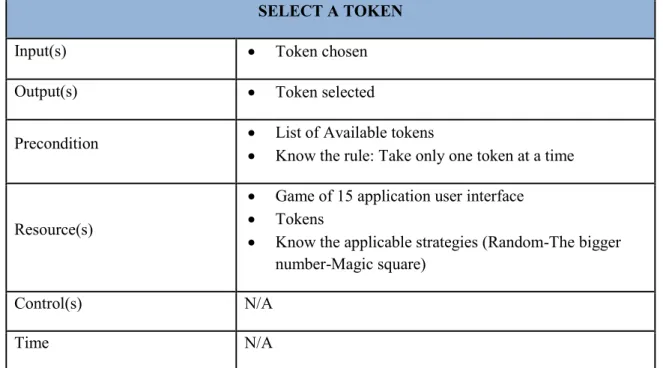
FIGURE 36:"SELECT A TOKEN" FUNCTION AS FRAM UNIT ... 105
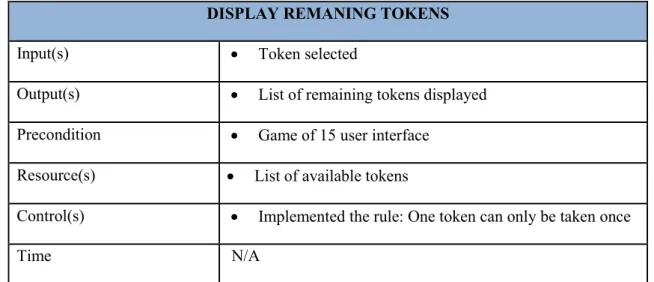
FIGURE 37:"DISPLAY REMAINING TOKENS" FUNCTION AS FRAM UNIT ... 107
FIGURE 38:"GIVE TURN TO THE OTHER PLAYER" FUNCTION AS FRAM UNIT ... 108
FIGURE 39:FRAM INSTANTIATION OF THE GAME OF 15 ... 111
FIGURE 40:HAMSTERS2.0 MODEL OF GAME OF 15– MAIN TASK TO PLAY THE GAME (TAKEN FROM CHAPTER 4–SECTION “3.1 TASK MODELS OF GAME OF 15”)... 113
FIGURE 41:HAMSTERS2.0 MODEL OF GAME OF 15- SUBROUTINE CORRESPONDING TO THE TASK SELECT TOKEN IN FIGURE 40
(TAKEN FROM CHAPTER 4–SECTION “3.1TASK MODELS OF GAME OF 15”) ... 114
FIGURE 42:ICO&PETSHOP MODEL OF PLAYER 1(LEADER) ... 115
FIGURE 43:ICO&PETSHOP MODEL OF PLAYER 2(CHALLENGER) ... 115
FIGURE 44:CONCEPT MAP OF GAME OF 15(TAKEN FROM CHAPTER 4–SECTION 3.2) ... 116
FIGURE 45:FRAM AS CORRESPONDENCE EDITOR IN THE GAME OF 15 ... 119
FIGURE 46:MEDIUM IMPACT OF “SELECT TOKEN” FUNCTION COUPLING FACTORS –FRAM INSTANTIATION OF THE GAME OF 15 . 123 FIGURE 47:HIGH IMPACT OF “SELECT TOKEN” FUNCTION COUPLING FACTORS –FRAM INSTANTIATION OF THE GAME OF 15 ... 124
FIGURE 48:POP UP FOR THE GAME OF 15 ... 126
FIGURE 49:REVISED ICO&PETSHOP MODEL OF PLAYER 1(LEADER) ... 127
FIGURE 50:REVISED ICO&PETSHOP MODEL OF PLAYER 2(CHALLENGER) ... 127
FIGURE 51:WXR SYSTEM IMPLEMENTED IN THE FCU OF A380 COCKPIT ... 131
FIGURE 52:IMAGE OF A) THE WEATHER RADAR CONTROL PANEL B) OF THE RADAR DISPLAY MANIPULATION ... 131
FIGURE 53:SCREENSHOT OF WEATHER RADAR DISPLAYS ... 132
FIGURE 54:THE WXR CASE STUDY TIMELINE ... 136
FIGURE 55:“AIRCRAFT FLIES” FUNCTION AS FRAM UNIT ... 137
FIGURE 56:“SCAN AIRSPACE” FUNCTION AS FRAM UNIT ... 140
FIGURE 57:“RENDERING OF RADAR INFORMATION” FUNCTION AS FRAM UNIT ... 142
FIGURE 58:“MANAGE MODES” FUNCTION AS FRAM UNIT ... 144
FIGURE 59:“EDIT ANGLE” FUNCTION AS FRAM UNIT ... 147
FIGURE 60:“DISPLAY UPDATED VALUE” FUNCTION AS FRAM UNIT ... 149
FIGURE 61:“CHANGE TILT ANGLE” FUNCTION AS FRAM UNIT ... 151
FIGURE 62:“ANALYSE CURRENT WEATHER MAP” FUNCTION AS FRAM UNIT ... 154
FIGURE 63:“SELECT DIFFERENT RANGE MAP” FUNCTION AS FRAM UNIT ... 156
FIGURE 64:“DETECT WEATHER TARGET” FUNCTION AS FRAM UNIT ... 159
FIGURE 65:“RECOGNISE WEATHER TARGET” FUNCTION AS FRAM UNIT ... 161
FIGURE 66:“IDENTIFY THE ADEQUATE PROCEDURE” FUNCTION AS FRAM UNIT ... 163
FIGURE 67:“REQUEST A CLEARANCE” FUNCTION AS FRAM UNIT ... 165
FIGURE 68:“COORDINATE WITH EXC” FUNCTION AS FRAM UNIT ... 167
FIGURE 69:“EXECUTE THE CLEARANCE” FUNCTION AS FRAM UNIT ... 170
FIGURE 70:FRAM INSTANTIATION OF THE WXR CASE STUDY ... 173
FIGURE 71:FRAM INSTANTIATION OF THE "CHECK WEATHER CONDITIONS" MACRO FUNCTION ... 173
FIGURE 72:FRAM INSTANTIATION OF THE "MANAGE TILT ANGLE" LOWER-FUNCTION OF “MANAGE WEATHER RADAR STATUS” ... 174
FIGURE 73:HAMSTERS2.0 TASK MODEL OF THE “CHECK WEATHER CONDITIONS” MAIN GOAL ... 176
FIGURE 74:HAMSTERS2.0 TASK MODEL OF THE SUBROUTINE “MANAGE WEATHER RADAR” TASK ... 177
FIGURE 75:HAMSTERS2.0 TASK MODEL OF THE “EXECUTE THE CLEARANCE (CHANGE HEADING)” TASK ... 178
FIGURE 76:ICO&PETSHOP –BEHAVIOUR OF THE WRX MODE SELECTION AND TILT ANGLE SETTING ... 179
FIGURE 77:ICO&PETSHOP –BEHAVIOUR OF THE RANGE SELECTION ... 180
FIGURE 78:CONCEPT MAP OF WXR USAGE ... 182
FIGURE 79:CONCEPT MAP OF WXR USAGE AND CONCEPTS CORRESPONDING REPRESENTATION IN ONE OR SEVERAL MODELS ... 183
FIGURE 80:FRAM AS CORRESPONDENCE EDITOR IN THE WXR CASE STUDY ... 186
FIGURE 81:MEDIUM IMPACT OF “CHECK WEATHER CONDITIONS” MACRO FUNCTION COUPLING FACTORS –FRAM INSTANTIATION OF THE WXR CASE STUDY ... 190
FIGURE 82:HIGH IMPACT OF “CHECK WEATHER CONDITIONS” MACRO FUNCTION COUPLING FACTORS –FRAM INSTANTIATION OF THE WXR CASE STUDY ... 190
FIGURE 83:MEDIUM IMPACT OF “COORDINATE WITH EXC” FUNCTION COUPLING FACTORS –FRAM INSTANTIATION OF THE WXR CASE STUDY ... 194
FIGURE 84:HIGH IMPACT OF “COORDINATE WITH EXC” FUNCTION COUPLING FACTORS –FRAM INSTANTIATION OF THE WXR CASE STUDY ... 194
FIGURE 86:REVISED CONCEPT MAP OF WXR USAGE ... 199
FIGURE 87:SCENARIO 1– THE WXR CASE STUDY TIMELINE ... 238
FIGURE 88:“AIRCRAFT FLIES” FUNCTION AS FRAM UNIT ... 239
FIGURE 89:“SCAN AIRSPACE” FUNCTION AS FRAM UNIT ... 242
FIGURE 90:“RENDERING OF RADAR INFORMATION” FUNCTION AS FRAM UNIT ... 244
FIGURE 91:“MANAGE MODES” FUNCTION AS FRAM UNIT ... 246
FIGURE 92:“EDIT ANGLE” FUNCTION AS FRAM UNIT ... 249
FIGURE 93:“DISPLAY UPDATED VALUE” FUNCTION AS FRAM UNIT ... 251
FIGURE 94:“CHANGE TILT ANGLE” FUNCTION AS FRAM UNIT ... 253
FIGURE 95:“ANALYSE CURRENT WEATHER MAP” FUNCTION AS FRAM UNIT ... 256
FIGURE 96:“SELECT DIFFERENT RANGE MAP” FUNCTION AS FRAM UNIT ... 258
FIGURE 97:“DETECT WEATHER TARGET” FUNCTION AS FRAM UNIT ... 261
FIGURE 98:“RECOGNISE WEATHER TARGET” FUNCTION AS FRAM UNIT ... 263
FIGURE 99:“IDENTIFY THE ADEQUATE PROCEDURE” FUNCTION AS FRAM UNIT ... 265
FIGURE 100:“REQUEST A CLEARANCE” FUNCTION AS FRAM UNIT ... 267
FIGURE 101:“COORDINATE WITH EXC” FUNCTION AS FRAM UNIT ... 269
FIGURE 102:“EXECUTE THE CLEARANCE” FUNCTION AS FRAM UNIT ... 272
FIGURE 103:SCENARIO –FRAM INSTANTIATION OF THE WXR CASE STUDY ... 276
FIGURE 104:SCENARIO –FRAM INSTANTIATION OF THE "CHECK WEATHER CONDITIONS" MACRO FUNCTION ... 276
FIGURE 105:SCENARIO –FRAM INSTANTIATION OF THE "MANAGE TILT ANGLE" LOWER-FUNCTION OF “MANAGE WEATHER RADAR STATUS” ... 277
FIGURE 106:HAMSTERS2.0 TASK MODEL OF THE “CHECK WEATHER CONDITIONS” MAIN GOAL ... 279
FIGURE 107:HAMSTERS2.0 TASK MODEL OF THE SUBROUTINE “MANAGE WEATHER RADAR” TASK ... 280
FIGURE 108:HAMSTERS2.0 TASK MODEL OF THE “EXECUTE THE CLEARANCE (CHANGE HEADING)” TASK ... 281
FIGURE 109:ICO&PETSHOP –BEHAVIOUR OF THE WRX MODE SELECTION AND TILT ANGLE SETTING ... 282
FIGURE 110:ICO&PETSHOP –BEHAVIOUR OF THE RANGE SELECTION ... 283
FIGURE 111:CONCEPT MAP OF WXR USAGE ... 285
FIGURE 112:FRAM AS CORRESPONDENCE EDITOR IN THE WXR CASE STUDY ... 288
FIGURE 113:SCENARIO -MEDIUM IMPACT OF “CHECK WEATHER CONDITIONS” MACRO FUNCTION COUPLING FACTORS –FRAM INSTANTIATION OF THE WXR CASE STUDY ... 292
FIGURE 114:SCENARIO -HIGH IMPACT OF “CHECK WEATHER CONDITIONS” MACRO FUNCTION COUPLING FACTORS –FRAM INSTANTIATION OF THE WXR CASE STUDY ... 292
List of tables
TABLE 1:TEMPORAL ORDERING OPERATORS IN HAMSTERS1.0 ... 28
TABLE 2:COMPARISON OF TASK MODELLING NOTATIONS AND ASSOCIATED METHODS ACCORDING TO SUGGESTED REQUIREMENTS (TAKEN AND ADAPTED FROM (MARTINIE,PALANQUE,&RAGOSTA,2013)) ... 34
TABLE 3:LOA IN MAN-COMPUTER DECISION-MAKING (TAKEN FROM (SHERIDAN &VERPLANK,HUMAN AND COMPUTER CONTROL OF UNDERSEA TELEOPERATORS,1978)) ... 38
TABLE 4:COMPARISON OF SYSTEM MODELLING TECHNIQUES AND ASSOCIATED METHODS ACCORDING TO SUGGESTED REQUIREMENTS FOR UIDL EXPRESSIVENESS (TAKEN AND ADAPTED FROM (HAMON,PALANQUE,SILVA,DELERIS,&BARBONI,2013)) ... 48
TABLE 5: COMPARISON OF MODELLING TECHNIQUES AND ASSOCIATED METHODS FOR RESILIENCE ANALYSIS ACCORDING TO SUGGESTED REQUIREMENTS ... 64
TABLE 6:COMPARISON OF TASK MODELLING NOTATIONS AND HAMSTERS2.0 ... 78
TABLE 7:FUNCTIONS TYPE DESCRIPTION –GAME OF 15 ... 102
TABLE 8:“START TO PLAY GAME OF 15” FUNCTION FRAM TABLE ... 103
TABLE 9:ENDOGENOUS FACTORS OF VARIABILITY RELATED TO “START TO PLAY GAME OF 15” FUNCTION ... 104
TABLE 10:OUTPUT VARIABILITY OF “START TO PLAY GAME OF 15" FUNCTION ... 104
TABLE 11:“SELECT A TOKEN” FUNCTION FRAM TABLE ... 105
TABLE 12:ENDOGENOUS FACTORS OF VARIABILITY RELATED TO”SELECT A TOKEN” FUNCTION ... 106
TABLE 13:OUTPUT VARIABILITY OF "SELECT A TOKEN" FUNCTION ... 106
TABLE 14:“DISPLAY REMAINING TOKENS” FUNCTION FRAM TABLE ... 107
TABLE 15:ENDOGENOUS FACTORS OF VARIABILITY RELATED TO “DISPLAY REMAINING TOKENS” FUNCTION... 107
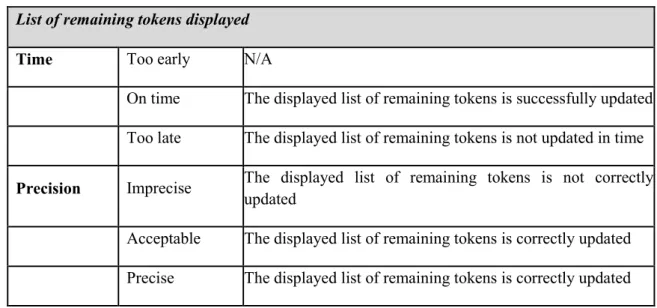
TABLE 16:OUTPUT VARIABILITY OF "DISPLAY REMAINING TOKENS" FUNCTION ... 108
TABLE 17:“GIVE TURN TO THE OTHER PLAYER” FUNCTION FRAM TABLE ... 109
TABLE 18:ENDOGENOUS FACTORS OF VARIABILITY RELATED TO “GIVE TURN TO THE OTHER PLAYER” FUNCTION ... 109
TABLE 19:OUTPUT VARIABILITY OF “GIVE TURN TO THE OTHER PLAYER" FUNCTION ... 110
TABLE 20:GAME OF 15–HAMSTERS2.0AND ICO&PETSHOP MODELS CORRESPONDENCES (LEADER) ... 117
TABLE 21:GAME OF 15–HAMSTERS2.0AND ICO&PETSHOP MODELS CORRESPONDENCES (CHALLENGER) ... 118
TABLE 22:MIN WIDTH OF THE WIDGETS OF THE GAME OF 15 USER INTERFACE ... 120
TABLE 23: A)DISTANCE BETWEEN A WIDGET AND THE CONTROL PANEL CENTER IN THE GAME OF 15 USER INTERFACE– B)TEMPORAL VALUES (IN MS) FOR USER INTERACTION USING FITTS’S... 120
TABLE 24:INTERACTION DELAYS INTRODUCED BY THE GAME OF 15 APPLICATION ... 121
TABLE 25:GAME OF 15–TIME AND PRECISION COUPLING FACTORS OF “SELECT A TOKEN” FUNCTION ... 122
TABLE 26:FUNCTIONS TYPE DESCRIPTION –WXR CASE STUDY ... 135
TABLE 27:“AIRCRAFT FLIES” FUNCTION FRAM TABLE ... 138
TABLE 28:ENDOGENOUS FACTORS OF VARIABILITY RELATED TO “AIRCRAFT FLIES” FUNCTION... 139
TABLE 29:EXOGENOUS FACTORS OF VARIABILITY RELATED TO “AIRCRAFT FLIES” FUNCTION ... 139
TABLE 30:OUTPUT VARIABILITY OF “AIRCRAFT FLIES" FUNCTION... 140
TABLE 31:“SCAN AIRSPACE” FUNCTION FRAM TABLE ... 141
TABLE 32:ENDOGENOUS FACTORS OF VARIABILITY RELATED TO “SCAN AIRSPACE” FUNCTION ... 141
TABLE 33:EXOGENOUS FACTORS OF VARIABILITY RELATED TO “SCAN AIRSPACE” FUNCTION ... 141
TABLE 34:OUTPUT VARIABILITY OF “SCAN AIRSPACE" FUNCTION ... 142
TABLE 35:“RENDERING OF RADAR INFORMATION” FUNCTION FRAM TABLE ... 143
TABLE 36:ENDOGENOUS FACTORS OF VARIABILITY RELATED TO “RENDERING OF RADAR INFORMATION” FUNCTION ... 143
TABLE 37:EXOGENOUS FACTORS OF VARIABILITY RELATED TO “RENDERING OF RADAR INFORMATION” FUNCTION... 143
TABLE 38:OUTPUT VARIABILITY OF "RENDERING OF RADAR INFORMATION" FUNCTION ... 144
TABLE 39:“MANAGE MODES” FUNCTION FRAM TABLE ... 145
TABLE 41:EXOGENOUS FACTORS OF VARIABILITY RELATED TO “MANAGE MODES” FUNCTION ... 146
TABLE 42:OUTPUT VARIABILITY OF "MANAGE MODES" FUNCTION ... 147
TABLE 43:“EDIT ANGLE” FUNCTION FRAM TABLE ... 148
TABLE 44:ENDOGENOUS FACTORS OF VARIABILITY RELATED TO “EDIT ANGLE” FUNCTION ... 148
TABLE 45:EXOGENOUS FACTORS OF VARIABILITY RELATED TO “EDIT ANGLE” FUNCTION... 149
TABLE 46:OUTPUT VARIABILITY OF "EDIT ANGLE" FUNCTION ... 149
TABLE 47:“DISPLAY UPDATED VALUE” FUNCTION FRAM TABLE ... 150
TABLE 48:ENDOGENOUS FACTORS OF VARIABILITY RELATED TO “DISPLAY UPDATED VALUE” FUNCTION ... 150
TABLE 49:EXOGENOUS FACTORS OF VARIABILITY RELATED TO “DISPLAY UPDATED VALUE” FUNCTION ... 150
TABLE 50:OUTPUT VARIABILITY OF "DISPLAY UPDATED VALUE" FUNCTION ... 151
TABLE 51:“CHANGE TILT ANGLE” FUNCTION FRAM TABLE ... 152
TABLE 52:ENDOGENOUS FACTORS OF VARIABILITY RELATED TO “CHANGE TILT ANGLE” FUNCTION ... 153
TABLE 53:EXOGENOUS FACTORS OF VARIABILITY RELATED TO “CHANGE TILT ANGLE” FUNCTION ... 153
TABLE 54:OUTPUT VARIABILITY OF "CHANGE TILT ANGLE" FUNCTION ... 154
TABLE 55:“ANALYSE CURRENT WEATHER MAP” FUNCTION FRAM TABLE ... 155
TABLE 56:ENDOGENOUS FACTORS OF VARIABILITY RELATED TO “ANALYSE CURRENT WEATHER MAP” FUNCTION ... 155
TABLE 57:EXOGENOUS FACTORS OF VARIABILITY RELATED TO “ANALYSE CURRENT WEATHER MAP” FUNCTION ... 156
TABLE 58:OUTPUT VARIABILITY OF "ANALYSE CURRENT WEATHER MAP" FUNCTION ... 156
TABLE 59:“SELECT DIFFERENT RANGE MAP” FUNCTION FRAM TABLE ... 157
TABLE 60:ENDOGENOUS FACTORS OF VARIABILITY RELATED TO “SELECT DIFFERENT RANGE MAP” FUNCTION ... 158
TABLE 61:EXOGENOUS FACTORS OF VARIABILITY RELATED TO “SELECT DIFFERENT RANGE MAP” FUNCTION ... 158
TABLE 62:OUTPUT VARIABILITY OF "SELECT DIFFERENT RANGE MAP" FUNCTION ... 159
TABLE 63:“DETECT WEATHER TARGET” FUNCTION FRAM TABLE ... 160
TABLE 64:ENDOGENOUS FACTORS OF VARIABILITY RELATED TO “DETECT WEATHER TARGET” FUNCTION ... 160
TABLE 65:EXOGENOUS FACTORS OF VARIABILITY RELATED TO “DETECT WEATHER TARGET” FUNCTION ... 160
TABLE 66:OUTPUT VARIABILITY OF "DETECT WEATHER TARGET" FUNCTION ... 161
TABLE 67:“RECOGNISE WEATHER TARGET” FUNCTION FRAM TABLE ... 162
TABLE 68:ENDOGENOUS FACTORS OF VARIABILITY RELATED TO “RECOGNISE WEATHER TARGET” FUNCTION ... 162
TABLE 69:EXOGENOUS FACTORS OF VARIABILITY RELATED TO “RECOGNISE WEATHER TARGET” FUNCTION ... 163
TABLE 70:OUTPUT VARIABILITY OF "RECOGNISE WEATHER TARGET" FUNCTION ... 163
TABLE 71:“IDENTIFY THE ADEQUATE PROCEDURE” FUNCTION FRAM TABLE ... 164
TABLE 72:ENDOGENOUS FACTORS OF VARIABILITY RELATED TO “IDENTIFY THE ADEQUATE PROCEDURE” FUNCTION ... 164
TABLE 73:EXOGENOUS FACTORS OF VARIABILITY RELATED TO “APPLY THE ADEQUATE PROCEDURE” FUNCTION ... 165
TABLE 74:OUTPUT VARIABILITY OF "IDENTIFY THE ADEQUATE PROCEDURE" FUNCTION ... 165
TABLE 75:“REQUEST A CLEARANCE” FUNCTION FRAM TABLE ... 166
TABLE 76:ENDOGENOUS FACTORS OF VARIABILITY RELATED TO “REQUEST A CLEARANCE” FUNCTION ... 166
TABLE 77:EXOGENOUS FACTORS OF VARIABILITY RELATED TO “REQUEST A CLEARANCE” FUNCTION ... 167
TABLE 78:OUTPUT VARIABILITY OF "REQUEST A CLEARANCE" FUNCTION ... 167
TABLE 79:“COORDINATE WITH EXC” FUNCTION FRAM TABLE ... 168
TABLE 80:ENDOGENOUS FACTORS OF VARIABILITY RELATED TO “COORDINATE WITH EXC” FUNCTION ... 168
TABLE 81:EXOGENOUS FACTORS OF VARIABILITY RELATED TO “COORDINATE WITH EXC” FUNCTION ... 169
TABLE 82:OUTPUT VARIABILITY OF "REQUEST A CLEARANCE" FUNCTION ... 169
TABLE 83:“EXECUTE THE CLEARANCE” FUNCTION FRAM TABLE ... 170
TABLE 84:ENDOGENOUS FACTORS OF VARIABILITY RELATED TO “EXECUTE THE CLEARANCE” FUNCTION ... 171
TABLE 85:EXOGENOUS FACTORS OF VARIABILITY RELATED TO “EXECUTE THE CLEARANCE” FUNCTION... 171
TABLE 86:OUTPUT VARIABILITY OF "EXECUTE THE CLEARANCE" FUNCTION ... 172
TABLE 87:WXR CASE STUDY –HAMSTERS2.0AND ICO&PETSHOP MODELS CORRESPONDENCES ... 185
TABLE 88:MIN WIDTH OF THE WIDGETS OF THE WXR USER INTERFACE ... 187
TABLE 89: A)DISTANCE BETWEEN A WIDGET AND THE CONTROL PANEL CENTER IN THE WXR USER INTERFACE– B)TEMPORAL VALUES (IN MS) FOR USER INTERACTION USING FITTS’S ... 187
TABLE 90:INTERACTION DELAYS INTRODUCED BY THE WXR APPLICATION ... 188
TABLE 91:WXR CASE STUDY –TIME AND PRECISION COUPLING FACTORS OF “CHECK WEATHER CONDITIONS” MACRO FUNCTION . 189 TABLE 92:WXR CASE STUDY –TIME AND PRECISION COUPLING FACTORS OF “COORDINATE WITH EXC” FUNCTION ... 192
TABLE 93:SCENARIO 1–FUNCTIONS TYPE DESCRIPTION –WXR CASE STUDY ... 237
TABLE 94:“AIRCRAFT FLIES” FUNCTION FRAM TABLE ... 240
TABLE 95:ENDOGENOUS FACTORS OF VARIABILITY RELATED TO “AIRCRAFT FLIES” FUNCTION... 241
TABLE 96:EXOGENOUS FACTORS OF VARIABILITY RELATED TO “AIRCRAFT FLIES” FUNCTION ... 241
TABLE 97:OUTPUT VARIABILITY OF “AIRCRAFT FLIES" FUNCTION... 242
TABLE 98:“SCAN AIRSPACE” FUNCTION FRAM TABLE ... 243
TABLE 99:ENDOGENOUS FACTORS OF VARIABILITY RELATED TO “SCAN AIRSPACE” FUNCTION ... 243
TABLE 100:EXOGENOUS FACTORS OF VARIABILITY RELATED TO “SCAN AIRSPACE” FUNCTION ... 243
TABLE 101:OUTPUT VARIABILITY OF “SCAN AIRSPACE" FUNCTION ... 244
TABLE 102:“RENDERING OF RADAR INFORMATION” FUNCTION FRAM TABLE ... 245
TABLE 103:ENDOGENOUS FACTORS OF VARIABILITY RELATED TO “RENDERING OF RADAR INFORMATION” FUNCTION ... 245
TABLE 104:EXOGENOUS FACTORS OF VARIABILITY RELATED TO “RENDERING OF RADAR INFORMATION” FUNCTION ... 245
TABLE 105:OUTPUT VARIABILITY OF "RENDERING OF RADAR INFORMATION" FUNCTION ... 246
TABLE 106:“MANAGE MODES” FUNCTION FRAM TABLE ... 247
TABLE 107:ENDOGENOUS FACTORS OF VARIABILITY RELATED TO “MANAGE MODES” FUNCTION ... 248
TABLE 108:EXOGENOUS FACTORS OF VARIABILITY RELATED TO “MANAGE MODES” FUNCTION ... 248
TABLE 109:OUTPUT VARIABILITY OF "MANAGE MODES" FUNCTION ... 249
TABLE 110:“EDIT ANGLE” FUNCTION FRAM TABLE ... 250
TABLE 111:ENDOGENOUS FACTORS OF VARIABILITY RELATED TO “EDIT ANGLE” FUNCTION ... 250
TABLE 112:EXOGENOUS FACTORS OF VARIABILITY RELATED TO “EDIT ANGLE” FUNCTION... 251
TABLE 113:OUTPUT VARIABILITY OF "EDIT ANGLE" FUNCTION ... 251
TABLE 114:“DISPLAY UPDATED VALUE” FUNCTION FRAM TABLE ... 252
TABLE 115:ENDOGENOUS FACTORS OF VARIABILITY RELATED TO “DISPLAY UPDATED VALUE” FUNCTION ... 252
TABLE 116:EXOGENOUS FACTORS OF VARIABILITY RELATED TO “DISPLAY UPDATED VALUE” FUNCTION ... 252
TABLE 117:OUTPUT VARIABILITY OF "DISPLAY UPDATED VALUE" FUNCTION ... 253
TABLE 118:“CHANGE TILT ANGLE” FUNCTION FRAM TABLE ... 254
TABLE 119:ENDOGENOUS FACTORS OF VARIABILITY RELATED TO “CHANGE TILT ANGLE” FUNCTION ... 255
TABLE 120:EXOGENOUS FACTORS OF VARIABILITY RELATED TO “CHANGE TILT ANGLE” FUNCTION ... 255
TABLE 121:OUTPUT VARIABILITY OF "CHANGE TILT ANGLE" FUNCTION ... 256
TABLE 122:“ANALYSE CURRENT WEATHER MAP” FUNCTION FRAM TABLE ... 257
TABLE 123:ENDOGENOUS FACTORS OF VARIABILITY RELATED TO “ANALYSE CURRENT WEATHER MAP” FUNCTION ... 257
TABLE 124:EXOGENOUS FACTORS OF VARIABILITY RELATED TO “ANALYSE CURRENT WEATHER MAP” FUNCTION... 258
TABLE 125:OUTPUT VARIABILITY OF "ANALYSE CURRENT WEATHER MAP" FUNCTION ... 258
TABLE 126:“SELECT DIFFERENT RANGE MAP” FUNCTION FRAM TABLE ... 259
TABLE 127:ENDOGENOUS FACTORS OF VARIABILITY RELATED TO “SELECT DIFFERENT RANGE MAP” FUNCTION ... 260
TABLE 128:EXOGENOUS FACTORS OF VARIABILITY RELATED TO “SELECT DIFFERENT RANGE MAP” FUNCTION ... 260
TABLE 129:OUTPUT VARIABILITY OF "SELECT DIFFERENT RANGE MAP" FUNCTION ... 261
TABLE 130:“DETECT WEATHER TARGET” FUNCTION FRAM TABLE ... 262
TABLE 131:ENDOGENOUS FACTORS OF VARIABILITY RELATED TO “DETECT WEATHER TARGET” FUNCTION ... 262
TABLE 132:EXOGENOUS FACTORS OF VARIABILITY RELATED TO “DETECT WEATHER TARGET” FUNCTION ... 262
TABLE 133:OUTPUT VARIABILITY OF "DETECT WEATHER TARGET" FUNCTION ... 263
TABLE 134:“RECOGNISE WEATHER TARGET” FUNCTION FRAM TABLE ... 264
TABLE 135:ENDOGENOUS FACTORS OF VARIABILITY RELATED TO “RECOGNISE WEATHER TARGET” FUNCTION ... 264
TABLE 136:EXOGENOUS FACTORS OF VARIABILITY RELATED TO “RECOGNISE WEATHER TARGET” FUNCTION ... 265
TABLE 137:OUTPUT VARIABILITY OF "RECOGNISE WEATHER TARGET" FUNCTION ... 265
TABLE 138:“IDENTIFY THE ADEQUATE PROCEDURE” FUNCTION FRAM TABLE ... 266
TABLE 140:EXOGENOUS FACTORS OF VARIABILITY RELATED TO “APPLY THE ADEQUATE PROCEDURE” FUNCTION ... 267
TABLE 141:OUTPUT VARIABILITY OF "IDENTIFY THE ADEQUATE PROCEDURE" FUNCTION ... 267
TABLE 142:“REQUEST A CLEARANCE” FUNCTION FRAM TABLE ... 268
TABLE 143:ENDOGENOUS FACTORS OF VARIABILITY RELATED TO “REQUEST A CLEARANCE” FUNCTION ... 268
TABLE 144:EXOGENOUS FACTORS OF VARIABILITY RELATED TO “REQUEST A CLEARANCE” FUNCTION ... 269
TABLE 145:OUTPUT VARIABILITY OF "REQUEST A CLEARANCE" FUNCTION ... 269
TABLE 146:“COORDINATE WITH EXC” FUNCTION FRAM TABLE ... 270
TABLE 147:ENDOGENOUS FACTORS OF VARIABILITY RELATED TO “COORDINATE WITH EXC” FUNCTION ... 270
TABLE 148:EXOGENOUS FACTORS OF VARIABILITY RELATED TO “COORDINATE WITH EXC” FUNCTION ... 271
TABLE 149:OUTPUT VARIABILITY OF "REQUEST A CLEARANCE" FUNCTION ... 271
TABLE 150:“EXECUTE THE CLEARANCE” FUNCTION FRAM TABLE ... 273
TABLE 151:ENDOGENOUS FACTORS OF VARIABILITY RELATED TO “EXECUTE THE CLEARANCE” FUNCTION ... 274
TABLE 152:EXOGENOUS FACTORS OF VARIABILITY RELATED TO “EXECUTE THE CLEARANCE” FUNCTION... 274
TABLE 153:OUTPUT VARIABILITY OF "EXECUTE THE CLEARANCE" FUNCTION ... 275
TABLE 154:WXR CASE STUDY –HAMSTERS2.0AND ICO&PETSHOP MODELS CORRESPONDENCES ... 287
TABLE 155:MIN WIDTH OF THE WIDGETS OF THE WXR USER INTERFACE ... 289
TABLE 156: A)DISTANCE BETWEEN A WIDGET AND THE CONTROL PANEL CENTER IN THE WXR USER INTERFACE– B)TEMPORAL VALUES (IN MS) FOR USER INTERACTION USING FITTS’S ... 289
TABLE 157:INTERACTION DELAYS INTRODUCED BY THE WXR APPLICATION ... 290 TABLE 158:WXR CASE STUDY –TIME AND PRECISION COUPLING FACTORS OF “CHECK WEATHER CONDITIONS” MACRO FUNCTION 290
Introduction
Socio-Technical Systems (STS) (Emery & Trist, 1960) are complex systems encompassing three main components: the system (usually a computer-based one) the human (usually a trained operator with validated qualification for operating the system) and the organisation (usually a large entity composed of several organizational layers ranging from the local organisation where the operator is located to higher level ones such a regulatory entities provided high-level rules for the Socio-Technical System).
Dealing with such large scale systems require multi-disciplinary approaches such as electronics and computer science (for the system part), psychology and human factors (for the human part) and organization sciences (for the organisation part of the STS). Of course as the operator is interacting with the computing system, Human-Computer Interaction (HCI) issues arise and have to be addressed adequately. Beyond that, these STS are most of the time large scale distributed systems where groups of operators interact altogether to achieve the required functions of the STS. This adds all the disciplines related to collaborative aspects of Computer Supported Cooperative Work (CSCW) including distributed systems and Human-Computer Interaction (at coordination, production and communication levels). Due to the deep interleaving of the three parts of the STS, their evolution can sometimes be (e.g. under adverse conditions) non-linear making its overall performance hardly predictable.
Usually researchers take a very limited view at the development of STS focussing on some specific aspects and hiding away other ones. This allows providing local solutions to the development issues but their integration is usually claimed to be beyond the scope of the research. This thesis proposes an integrated approach addressing all these aspects in a common framework that is described later on. In order to reduce the field of investigation, the thesis focusses on Air Traffic Management (ATM) Socio-Technical System systems that are considered complex as they encompass interactions involving multiple kinds of operators, various dedicated computing systems, multiple regulatory authorities and their performance is deeply influenced by environmental aspects (i.e. weather, organizational variability (e.g. strikes) or system failures).
Above all, the current European ATM System needs to be improved for coping with the growth in air traffic forecasted for next years. Traffic is also likely to become more heterogeneous integrating Remotely Piloted Aircraft Systems (RPAS) and possibly civil aircraft with reduced flying crew (also known as single pilot operations). These two aspects require evolutions to increase ATM capacity and to guarantee that safety level is not reduced. One way towards these objectives is to increase automation in the computing part of the ATM Socio-Technical System. In that case, automation has to be considered as an enabler to improve capacity (and possibly safety) of the ATM System, considering this improvement not from any partial view point, but from an overall System performance perspective. As automation should provide support to increase capacity by empowering the operators and then improving the overall performance, the partly autonomous interactive systems require to be
usable. As higher levels of automation should not reduce safety level, the partly autonomous
interactive systems within their associated STS have to be resilient.
Automation then is not seen to replace operators but to empower them and to improve the overall performance of ATM as clearly defined by the research network on Higher Automation Levels in
Aviation (HALA!) (HALA! SESAR Research Network, 2012). This approach is similar to the one followed in the early 80’s when flying crew for large civil aircraft was reduced from three to two by adding sophisticated Flight Management Systems (Wise, Hopkin, & Garland, 2009). However, it is important to design this automation very carefully taking into account the three parts of the STS. As clearly pointed out by Lisanne Bainbridge (Bainbridge, 1983) automation malfunctions end up most of the time in the hands of operators that were precisely supported with automation as their tasks were too complex or too resource consuming. Moreover, introducing higher level of automation requires (beyond design issues) an evaluation of the impact which the new technology may have on each STS part (operator, computing system and organisation) such as tasks migration and/or functions allocation (Jordan, 1963). Such function allocation (as illustrated in Figure 1), concerns the ground side of the ATM System i.e. the Air Traffic Control Centres (ATCs). On the top left-right side of Figure 1, Air Traffic Controllers communicate with pilots via data link or transfer aircraft interacting on the electronic labels of the aircraft on the radar screen instead of using paper strips and communicating by voice using VHF medium. Similarly, on the airborne side (lower part of Figure 1), glass cockpits (Sweet, 1995) provide a means for integrating information to support pilots activities while this information was previously distributed amongst multiple displays throughout the cockpit. In both cases, task migration and/or functions allocation require that humans improve their knowledge, learn how to interact and collaborate with the new technology for accomplishing tasks.
Figure 1: The enhancement of integrated automation support in ATCs and cockpits over time
In automated systems, function allocation (Older, Waterson, & Clegg, 1997) between human and machine has always been a point of controversy. In the context of automation, “functions allocation” means that the actor (either human or machine) that is best suited (based on some continuum of
parameters) should perform the function. The basis for selection and grading of such parameters is at the heart of the issue of function allocation and has been subject to much investigation over the years, from Fitts with his MABA-MABA list (Fitts, 1954), through Sheridan et al. (Sheridan & Verplank, 1978) who have constructed stepwise function allocation models of automation using two main dimensions – proper task and proper level –, until Parasuraman’s et al. (Parasuraman, Sheridan, & Wickens, 2000) information processing model.
Tasks usually performed by human operators, may be partially or fully automated. Most of the time automation is only partial keeping the operators in the loop so that they can forecast what will happen next and interfere with automation in case of adverse events or automation malfunction. The design of this cooperation requires understanding how to balance automation and interactivity and specify how a task can be performed by assigning the generic functions to the operator and the system in terms of function allocation. “Function allocation cannot be based on a consideration of the tasks only, but must consider the total equilibrium of a work situation—corresponding to a notion of balanced work. The concept of equilibrium emphasises the fact that a change in function allocation disturbs the established equilibrium. This will have consequences for the system as a whole, and one result may be that a new equilibrium is established which differs significantly from the previous one.” (Bye, Hollnagel, & Brendeford, 1999, p. 292)
Previous work on automation can be divided according to three different perspectives: 1) the design perspective which focuses on how to engineer the computing systems (offering automation) and more precisely its user interface (Bindewald, Miller, & Peterson, 2014), 2) the evaluation perspective which focuses on how to assess the operational aspects of automation including performance impact of automation on operations (Parasuraman & Riley, 1997) (Kaber & Endsley, 2004), and 3) the human perspective which focuses on how to understand the role of the operators who deal with a new technology or a different level of automation (Parasuraman, Sheridan, & Wickens, 2000) (Save & Feuerberg, 2012). While this research work has been mostly conducted in separate fields, as the increase of automation might come along with an increase of performance variability of the whole ATM System especially in case of automation degradation, there is a need to provide an integrated view on these disjoint research activities.
Contribution
To address all the issues introduced above, this thesis proposes a multi-models based approach for the modelling and the analysis of partly-autonomous interactive systems within a STS for assessing their resilience and usability.
The design driver of the contribution was twofold:
- Address all the aspects of the STS in a single integrated framework
- Address the entire development process of STS from design to evaluation with a special emphasis on automation dependability as this is key in Lisanne Bainbridge (Bainbridge, 1983) view on ironies of automation.
Addressing all the aspects of the STS would be clearly unachievable without tackling it at the right level of abstraction. Indeed, it would be very easy to get lost too early in low-level details or to miss important aspects by focussing too much on a specific part. For this reason one of the main hypotheses of this thesis is that using an adequate model will allow us to describe the STS at the adequate level both for design and analysis purposes. The other hypothesis is that due to the very different nature of
the three parts of the STSs one model will not fit all but different models have to be used and, of course, that these various models will have to be integrated to describe the entire relevant elements of the STS. While the thesis focuses on ATM systems we will separate the definition of the models and the process for using them from the ATM case studies. This will demonstrate that the approach is not dedicated to ATM but is also suitable to other large scale STSs (even though some adjustments might be required to manage their idiosyncrasies).
Thus, the contribution of this thesis is first based on the identification of a set of requirements needed being able to model and analyse each of the STS elements. Some of these requirements were met by existing modelling techniques, others were reachable by extending and refining existing ones. This thesis proposes an approach which integrates three modelling techniques: FRAM (focused on organisational functions), HAMSTERS (centred on operator goals and activities) and ICO (dedicated to the modelling of interactive systems and supporting the development of dependable computing systems). The integration of models has been done at a detailed level through a dedicated process defining in a stepwise manner how to go from one model to another one but also how information represented in one model is reused and possibly refined in another one.
The principle of the multi-models approach is illustrated on an example for carefully showing the extensions proposed to the selected modelling techniques and how they integrate together. A more complex case study from the ATM World is then presented to demonstrate the scalability of the approach. This case study, dealing with aircraft route change due to bad weather conditions, highlights the ability of the integration of models to cope with performance variability of the various parts of the STS.
Structure
Chapter 1, Chapter 2 and Chapter 3 form Part 1 of this thesis which presents an overview of the state of the art relating to the various domains relevant to this research, including tasks, systems and organisationals modelling techniques and associated methods for respectively addressing human activities, systems and related user interactions, and organisational aspects focusing on usability and resilience analysis of a partly interactive autonomous system within a STS.
Chapter 4 begins Part 2 of the thesis, the Contributions one, which introduces the first contribution regarding one of the introduced modelling techniques called HAMSTERS. The subsequent sections present the extensions that have been added to the notation in order to allow the representation of elements of declarative knowledge and in order to enable their integration within the procedural knowledge description of HAMSTERS 2.0 (please refer to Section 1). The main changes with regard to HAMSTERS 1.0 correspond to the explicit handling of declarative and procedural knowledge elements within a concept map and to the explicit representation of these elements in the task model (please refer to Section 2).
Chapter 5 presents the second contribution of this thesis, the multi-models based approach which is the process for integrating the three selected modelling techniques in order to model and to analyse a partly autonomous interactive system within a Socio-Technical System and to assess its resilience and usability properties. Furthermore, this approach provides support for examining the system under analysis at different levels of granularity.
Chapter 6 concludes Part 2. This chapter proposes a more complex case study taken from the ATM World to demonstrate the scalability of the approach. This case study, dealing with aircraft route change due to bad weather conditions, highlights the ability of the integration of models to cope with performance variability of the various parts of the STS.
Finally, the last Chapters present the “Conclusions” and offer “Perspectives” regarding the application of the developed approach and a list of selected “Personal publications”.
Chapter 1 – Addressing human activities through task modelling techniques and associated methods
Chapter 1 – Addressing human activities through
task modelling techniques and associated methods
This chapter describes the current state of the art of task modelling techniques and methods used to address the description of human activities which are needed to interact with a partly autonomous interactive system. The scope of this chapter is to:- Explain why task analysis and modelling are needed to analyse and assess usability and resilience of partly autonomous interactive systems
- Describe and compare the existing task modelling techniques and methods
- Examine what is still missing in existing task modelling techniques and methods to provide support for the modelling and the analysis of usable and resilient partly autonomous interactive systems with regard to human activities which are needed to interact with this kind of systems. Moreover, it proposes a set of requirements for improving these task modelling techniques and methods in order to integrate knowledge representation in task models
- Make a comparison of task modelling techniques and methods according to the identified requirements.
The first section illustrates how task analysis is at the core of most work in human-computer interaction because it is concerned with the performance of work (Diaper, 2004).
The second section offers a state of the art on task modelling techniques and methods. It aims at describing and comparing the existing techniques and it also includes a deeper description of the HAMSTERS task modelling technique which has been developed by the ICS team and which is currently being used in research projects related to the ATM domain to investigate the human behaviour. HAMSTERS stands for Human-centered Assessment and Modelling to Support Task Engineering for Resilient Systems and is tagged version 1.0 (HAMSTERS 1.0) in part 1 of this manuscript. HAMSTERS version 2.0 integrates the contribution proposed by this thesis and is presented in part 2 of this manuscript.
The third section highlights what is still missing in existing task modelling techniques and methods and identifies requirements for addressing human activities, which are needed to interact with a partly autonomous interactive system, through task modelling techniques and methods for the modelling and the analysis of usable and resilient partly autonomous interactive systems.
The fourth section offers a comparison of task modelling techniques and methods according to the identified requirements.
1 Task analysis and modelling to support analysis and
assessment of usability and resilience of partly
autonomous interactive systems
As stated by Annett (Annett, 2004) “Analysis is not just a matter of listing the actions or the physical and cognitive processes involved in carrying out a task, although it is likely to refer to either or both. Analysis, as opposed to description, is a procedure aimed at identifying performance problems and
proposing solutions.” Task analysis produces one or more models of the world and these models describe the world and how work is performed in it (Diaper, 2004) .
Task models provide abstract and refined descriptions of human activities. They contain:
1. a description of the work that has to be performed by an operator and the goals s/he has to accomplish,
2. a refinement of these goals into human actions.
There are many reasons for developing task models. Task model of human activities required to operate an existing system can be created in order to better understand the underlying design, to analyse its potential limitations and how to overcome them (Paternò, 2004). Task models can also be recorded and used in a complementary way with other data collection methods (Law, et al., 2009) such as interviews and scenario based approaches (Rosson & Carroll, 2001). Task analysis and modelling techniques provide a unique way of understanding and analysing in systematic way users’ roles and activities. They can be useful for supporting analysis and assessment of usability (Greenberg, 2004) (Law, et al., 2009) and resilience (Hollnagel, 2006) of partly autonomous interactive systems. As illustrated in Figure 2, the complexity of the real work can be analysed through task analysis. The complexity of the real work is filtered out through a purple filter that represents a task analysis. This “task analysis” filter allows focusing on specific pieces of information about the real work by using task analysis notation elements to describe real work activities. The aim of this filtering out operation is to obtain a description of the assumed real work. The description of the real work relies on the chosen notation, i.e. on aspects that are relevant to the analyst. The analyst may then choose between several task modelling techniques to record this description in task models. Each task modelling technique can provide a different way to represent the task. This point is illustrated in Figure 2 where there are 2 purple glasses for representing different task modelling techniques and their specific notations such as Task Architect (Stuart & Penn, 2004) in the upper part, or HAMSTERS 1.0 (Martinie, Palanque, & Winckler, 2011) in the lower part (Section 2.1 presents a state of the art on existing notations). Depending on the choice of notation, the task modelling operation will result in a different model of the activities since each type of model highlights particular aspects of the assumed real work. For this reason, it is important to choose the most suitable task modelling technique. Thanks to the selected task modelling technique, the analyst can highlight the aspects that are relevant to the goals of his/her analysis.
Real work
Task analysis
Description of the assumed real work
Task modelling technique
Task models of the assumed real work
Task modelling technique
Chapter 1 – Addressing human activities through task modelling techniques and associated methods
On one hand, the process of filtering out activities allows to take into consideration the aspects of the real work that are important for the analysis, and, on the other hand, it allows to define the boundaries of analysis. For example, in the presented work we concentrate on human tasks related to the use of the partly autonomous interactive system. Therefore, our task modelling approach focuses on the activities carried out by human interacting with this type of systems in order to understand what are his/her tasks when the system properly works and what are his/her tasks in case of a system automation degradation. Our goal is to understand, through task analysis and modelling, how tasks can be distributed between the human and the system in order to find a good balance for ensuring and improving the usability and the resilience of the system.
2 State of the art on task modelling techniques and
associated methods
Task modelling techniques provide support to structure and store information gathered from task analysis through their own characteristics elements of representation such as hierarchical trees, flow charts, etc. The resulting models are able to capture and represent some particular aspects of the description of the assumed real work which are relevant for the analyst who selects the most suitable task modelling technique for her/his needs.
To accomplish tasks, users may need to manipulate objects or information about current situation of the system and its environment, and knowledge about which actions to perform and how to perform them. When designing partly autonomous interactive systems, the phase of tasks analysis usually focuses on: identifying goals which should be reached, grouping activities that have to be accomplished, understanding execution order of these activities and identifying objects required to perform the tasks. Existing analysis techniques and notations do not provide full support for explicitly and distinctively describing concepts related to the notions of object, knowledge and its different types (declarative, situational, procedural and strategic) and information. Although some of them provide support for describing manipulated objects, most of these notations are focused on representation of procedures and methods for reaching a goal rather than the knowledge, information and objects involved.
This section proposes:
- a detailed analysis of a number of established task modelling techniques and associated methods including the description of their main elements of notation and the description of their supporting tools,
- a focus on Human-centered Assessment and Modelling to Support Task Engineering for Resilient Systems version 1.0 (HAMSTERS 1.0) because, thanks to a structured process, it provides support for modelling complex human activities and for representing information and objects. Furthermore, it is inspired from Concur Task Trees (CTT) (Paternò, 2004) and has thus been intended to remain compatible with it (at the user level). In addition, HAMSTERS 1.0 involves notation elements such as conditions associated to task executions, data flow across task models etc. extending its expression power beyond the one of CTT. HAMSTERS is publicly available, featuring a task simulator and providing a dedicated API for observing editing and simulation events1.
2.1
An overview of task modelling techniques and associated
methods
Task analysis has foundations going back to the end of the last century. One of the reasons of its longevity is that task modelling techniques and methods have been adapted to the evolution of socio-technical systems they are meant to describe. This has given rise to over one hundred methods and techniques that are called task analysis as claimed in the introduction of the “Handbook on task analysis” (Diaper & Stanton, 2004). The scientific community has actively developed and improved the expressive power of task analysis and modelling techniques as put forward in (Caffiau, Scapin, Girard, Baron, & Jambon, 2010). This expressive power increases enables for instance to better represent and analyse human activities while interacting with new technologies as in (Jourde, Laurillau, & Nigay, 2010) or to explicitly represent information used for performing tasks as in (Villaren, Coppin, & Leal, 2012). We provide here after an overview of representative task modelling techniques and their related methods when available. They are presented in chronological order. Hierarchical Task Analysis (HTA) (Meyer, Annett, & Duncan, 1967) (Anett, 2004) models can be represented textually or graphically with structured numbering corresponding to the various goals and decomposed actions. Plans can then be drawn up indicating the order in which tasks are to be performed. The numbering of goals and sub-goals allows adding sequence information. It is able to describe only procedural knowledge. The modelling activity is supported by Task Architect (Stuart & Penn, 2004).
The Goals, Operators, Methods and Selection rules (GOMS) (Card, Newell, & Moran, 1983) model was developed as a model for predicting human performance while interacting with a system. GOMS reduces a user's interaction with a computer to its elementary actions that can be physical, cognitive or perceptual. Using these elementary actions as a framework, an interface can be studied. There are several support tools, but the most recent one is CAT-HCI (Williams K. , 2005).
Task Knowledge Structure (TKS) (Johnson & Johnson, Knowledge Analysis of Task; Tast Analysis and Specification for Human-Computer Systems, 1989) is based on the assumption that people possess knowledge structures in their memory that relate to tasks. The approach represents declarative and procedural knowledge to describe the roles, goals, plans and procedures composed of actions and objects. Even though knowledge is part of the acronym, it is not explicitly represented in models which can be edited using the ADEPT tool (Johnson, Wilson, Markopoulos, & Pycock, 1993).
Méthode Analytique de Description de tâches (MAD) (Scapin & Pierret-Golbreich, 1989) combines structured interviewing and modelling techniques focusing explicitly on the hierarchical relation of tasks. The main concepts of MAD include tasks, actions and structures. In last versions, it can also describe objects explicitly (and even in a formal way) and conditions related to tasks. The environment K-MADe supports this method (Scapin D. L., 2007).
User Action Notation (UAN) (Hix & Harston, 1993) was designed to formalize the communication between the User Interface (UI) designers and the development team when specifying and analysing details of technology. The central concept is the abstraction of task, including hierarchical structure, and sequencing. User actions, interface feedback and state changes are used to build up the task description, which may subsequently be used as an action at higher levels of abstraction. This rating primarily provides support to the formal modelling of interactive tasks. Even though very popular in the 90’s the close connection between tasks and user interfaces made it very difficult to cope with large systems.
Chapter 1 – Addressing human activities through task modelling techniques and associated methods
Groupware Task Analysis (GTA) (Van Der Veer, Lenting, & Bergevoet, 1996) was developed for the modelling of complex tasks in a co-operative environment. The foundations of the GTA approach are a combination of both ethnography and activity theory adopting a clear distinction between tasks and actions. Thus, it introduces the concept of role to the person in charge of a task. It describes only procedural knowledge. Euterpe is the support tool for modelling activity (van Welie, van der Veer, & Eliëns, 1998).
Diane+ (Tarby & Barthet, 1996) models a task with three concepts: operation, sequencing and decomposition. DIANE+ like MAD employs a rich graphical notation to represent the decomposition of tasks as well as temporal and logical relationships between the tasks. It is supported by several tools, such as TAMOT (Paris, Tarby, & Vander Linden, A Flexible Environment for Building Task Models, 2001) and Isolde (Paris, Vander Linden, & Lu, 1992) but there is no user’s knowledge representation.
Visual Task Modelling Language (VTML) (Brown & Leveson, 1998) is a graphical notation designed in order to analyse formally the actions of a human operator in relation to safety issues. It proposes to record the actions of the operators in the form of flow charts. There is no indication on knowledge representation. VTML is supported by SpecTRM (Lee, Howard, & Anderson, 2002).
Cognitive Work Analysis (CWA) (Vicente, 1999) is a work-centered conceptual framework to guide the design of technology for use in the work place. It consists of 5 phases with a dedicated approach for each one: 1) Work Domain Analysis (WDA) with Abstraction and Decomposition table, 2) Control Task Analysis (CTA) supported by decision ladder, 3) strategies analysis with information flow maps, 4) social organization and cooperation analysis in which you can use all the above approaches, 5) worker competencies analysis based on Skill, Rules, Knowledge taxonomy (Rasmussen, 1983) (Rasmussen, 1985). CWA is not supported by a tool.
Task Analysis for Knowledge Descriptions (TAKD) (Diaper, 2001) is a method which is first used to generate descriptions of tasks, and then to re-express the descriptions in terms of knowledge. The resulting knowledge descriptions consist of action/object pairs that when combined represent the knowledge content of tasks. This method is related to TKS. It is a summary representation of the different types of knowledge that are recruited and used in task behaviour (Johnson, Johnson, Waddington, & Shouls, 1989), and it is supported by LUTAKD (Diaper, 2001).
Concurrent Task Tree (CTT) (Paternò, 2004) a graphical notation with a dedicated support tool, CTT Environment (CTTe) (Paternò, Mancini, & Meniconi, 1997) have enabled the distinction of abstract, user, interaction and application tasks as well as the possibility to model temporal aspects of activities when specifying a model. A set of operators, mainly taken from the LOTOS formalism (ISO, 1989) is used to indicate the temporal relationships among tasks such as iteration, sequentially, concurrency, disabling, and recursion. It was one of the first notation embedding in procedural knowledge concurrency and interruptions that are however clear characteristics of human procedural knowledge. It provides support for the description of cooperative tasks and user role. Scheduling temporal operators apply only between tasks and how to decompose tasks can lead to ambiguities in the model interpretation.
AMBOSS (Giese, Mistrzik, Pfau, Szwillus, & von Detten, 2008) task modelling environment takes into account the special needs for safety-critical socio-technical systems. The authors do not provide an accurate description of the underlying notation; however it seems to use the same concepts of hierarchical structure and temporal MAD. AMBOSS can also combine information related to human
error and safety in task models (barriers, risk factor, and criticality of the task). Furthermore, it takes into account the concept of role. However, concepts of declarative knowledge are not handled.
Situation Awareness Modelling & ANalysis for Transition Amelioration (SAMANTA) (Villaren, Coppin, & Leal, 2012) is a methodology for design of Human-Computer Interfaces in dynamic systems taking into consideration the situation elements constituting operators’ activity. It consists of 4 phases: 1) task modelling based on CTT notation (Paternò, 1999) and situation modelling phase based on DSA (Stanton, et al., 2006), 2) Task/Situation elements Association in which each task of the task model is associated with a set of Situational Awareness (SA) elements from the situation model, 3) Transition Analysis, tasks are compared two by two in order to categorize the transitions that link them, 4) Impact on HCI for interface validation integrated with design experts recommendations. It is the only notation in which there is a tentative to propose the production of a specific model of knowledge by means of a model called context. It thus identifies clearly knowledge required for performing the tasks but does not separate it into several categories.
2.2
Focus on the Human-centered Assessment and Modelling
to Support Task Engineering for Resilient Systems version
1.0 (HAMSTERS 1.0)
Human-centered Assessment and Modelling to Support Task Engineering for Resilient Systems version 0.1 (HAMSTERS 1.0) (Martinie, Palanque, & Winckler, 2011) is a notation to describe the decomposition of human goals into activities. It is inspired from Concur Task Trees (CTT) (Paternò, 2004) and has thus been intended to remain compatible (at the users level) with it. Indeed both can be considered as hierarchical and graphical models representation relationship between tasks by means of operators. However, HAMSTERS 1.0 involves extensions such as conditions associated to task executions, data flow across task models etc. extending its expression power beyond the one of CTT. Additionally, it is publicly available, featuring a task simulator and providing a dedicated API for observing editing and simulation events2.
It is a tool-supported graphical task modelling notation aiming at representing human activities in a hierarchical and ordered way. Goals can be decomposed into sub-goals, which can in turn be decomposed into activities, and output of this decomposition is a graphical tree of nodes. Nodes can be tasks or temporal operators.
Figure 3: High-level task types in HAMSTERS 1.0