O
pen
A
rchive
T
OULOUSE
A
rchive
O
uverte (
OATAO
)
OATAO is an open access repository that collects the work of Toulouse researchers and
makes it freely available over the web where possible.
This is an author-deposited version published in :
http://oatao.univ-toulouse.fr/
Eprints ID : 16927
The contribution was presented at ATACCS 2015 :
https://www.irit.fr/recherches/ICS/events/conferences/ataccs/ataccs2015/
To cite this version :
Ragosta, Martina and Martinie De Almeida, Celia
and Palanque, Philippe and Navarre, David and Sujan, Mark-Alexander
Concept Maps as a Glue for Integrating Modeling Techniques for the
Analysis and Re-Design of Partly-Autonomous Interactive Systems.
(2015) In: International Conference on Application and Theory of
Automation in Command and Control Systems (ATACCS 2015), 30
September 2015 - 2 October 2015 (Toulouse, France).
Any correspondence concerning this service should be sent to the repository
administrator:
[email protected]
Concept Maps for Integrating Modeling Techniques for the
Analysis and Re-Design of Partly-Autonomous Interactive
Systems
Martina Ragosta
Deep Blue
Piazza Buenos Aires 20,
00198 Rome, Italy
[email protected]
Célia Martinie, Philippe
Palanque, David Navarre
IRIT, University of Toulouse
118, route de Narbonne
31042 Toulouse, France
{lastname}@irit.fr
Mark Alexander Sujan
Warwick Medical School,
University of Warwick,
Coventry CV4 7AL, UK
[email protected]
ABSTRACT
Socio-Technical Systems (STS) such as Air Traffic Management Systems (ATM) are considered as complex as they encompass interactions involving humans and machines deeply influenced by environmental aspects (e.g. weather conditions) and by the overall organizational structure in which they are deployed in. Within such STS, interactive systems are omnipresent allowing operators to interact with the underlying system. Such interactive systems must be both usable (i.e. enabling users to perform their tasks efficiently and effectively while ensuring a certain level of operator satisfaction) and resilient to adverse events including software malfunctions (e.g. automation degradation) as well as interaction related problems (e.g. human errors or interactive system failures). Current techniques, methods and tools do not allow to model STSs as a whole and thus to analyze both usability and resilience properties. This paper proposes a multi-models based approach for the modelling and the analysis of partly-autonomous interactive systems for assessing their resilience and usability. The approach integrates 3 modelling techniques: Functional Resonance Analysis Method (FRAM) (focused on organizational functions), Human-centered Assessment and Modelling to Support Task Engineering for Resilient Systems (HAMSTERS) (centered on human goals and activities) and Interactive Cooperative Objects (ICO) (dedicated to the modelling of interactive systems). The principles of the multi-models approach is illustrated on an example for carefully showing the extensions proposed to the selected modelling techniques and how they integrate together. A case study dealing with
aircraft route change due to bad weather conditions demonstrates the scalability and benefits of the approach. Author Keywords
Multi-models approach, ATM, usability, resilience, automation, interactive systems.
INTRODUCTION
The current European Air Traffic Management (ATM) System needs to be improved for coping with the forecasted growth in air traffic. It has been broadly recognized that future ATM capacity and safety objectives can only be achieved by an intense enhancement of integrated automation support [5]. However, increase of automation might come along with an increase of performance variability of the whole ATM System especially in case of automation degradation. ATM systems are considered complex as they encompass interactions involving humans and machines deeply influenced by environmental aspects (i.e. weather or organizational structure) making them belong to the class of Socio-Technical Systems (STS) [3]. Due to this complexity, the interactions between the STS elements (human, system and organization) make its performance evolution complex and hardly predictable. Within such STS, interactive systems have to be usable i.e. enabling users to perform their tasks efficiently and effectively while ensuring a certain level of operator satisfaction. Besides, the STS has to be resilient to adverse events (including potential automation degradation) but also interaction problems between their interactive systems and the operators. These issues may affect several STS aspects such as resources, time in tasks performance, ability to adjust to environment, etc. In order to be able to analyze the impact of these perturbations and to assess the potential performance variability of a STS, dedicated techniques and methods are required. These techniques and methods have to provide support for describing (modelling) and structuring a large amount of information and to be able to address the variability of each of STS elements as well as the variability
related to their interrelations. They have to provide support for analyzing these descriptions in a systematic way in order to assess usability and resilience of such interactive systems that are exhibiting partly autonomous behaviors.
Current techniques, methods and processes do not enable to model a STS as a whole and to analyze both usability and resilience properties. Also, they do not embed all the elements that are required to describe and analyze each part of the STS (such as knowledge of different types which is needed by a user for accomplishing tasks or for interacting with dedicated technologies). Lastly, they do not provide means for analyzing task migrations when automation is introduced or for analyzing performance variability in case of degradation of the newly introduced automation.
This paper proposes a multi-models based approach for the modelling and the analysis of Partly-Autonomous Interactive Systems (PAIS) for assessing their resilience and usability. The approach integrates 3 modelling techniques: FRAM (focused on organizational aspects), HAMSTERS (centered on human goals and activities) and ICO (dedicated to the modelling of the interactive system). Next section presents an overview of the main concepts that are related to the main elements of a STS and their interrelationships. Third section describes the proposed process to analyze and re-design a PAIS within its associated STS. Fourth section presents the application of the proposed process to the case study of an aircraft route change. Last two sections provide lessons learnt, conclude the paper and highlight perspectives to this work
AN INTEGRATED VIEW OF ORGANIZATION, SYSTEMS AND OPERATORS
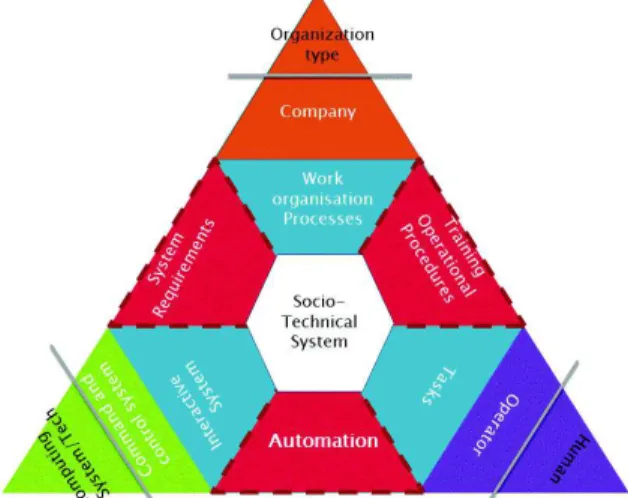
By definition, a STS is complex system encompassing three main components [3]: the organization, the human, the system. Humans are usually trained operators with validated qualification for operating the system. They can accomplish tasks with the support of automated systems and following procedures. Systems are usually computer-based ones which present a certain level of automation and are supposed to address some requirements. The organization is usually a large entity composed of several organizational layers. Furthermore, this organization has to deal with the context and the environment. Such a three-fold perspective was introduced by Meshkati in the late 80’s [21], claiming that the resilience of socio-technical systems require addressing in the same single framework Human Organization and Technology.
The 3 elements (organization, system, and operator) are deeply interleaving and may affect each other. For this reason, the boundaries between them are dotted in Figure 1. It is important to note that, in this paper, automation is not aimed at replacing operators but, on the opposite, to empower them and to improve the overall performance of the STS by increased automation. If this was the case, the automation part of the diagram would overlap with the human/operator triangle.
The three ends of the triangle represent the three main components of the STS. These elements are connected to the other ones by dedicated trapeziums (Automation, System Requirements and Training and Operational Procedures). These trapeziums represent explicitly how each element influences the other ones. At the basis of the triangles there are other trapeziums (in blue) that consist in refined description of the content of the triangles. This way, Work organization and Processes are refinement of the organization, Tasks are refinement of the operator and Interactive Systems are the relevant part of the Technology component.
Figure 1: Integrated view on the main concepts related to Socio-Technical Systems
Describing organization and management has been in the past mainly addressed in the area of information systems where computing science was perceived as a mean for improving productivity by redesign of the organizational structure of the companies. Development methods such as SSADM [4], Jackson Software Development [11] or MERISE [30], [31] (in French speaking countries) have been very successful in proposing means for describing organizations and for analyzing those descriptions in order to identify opportunities for improvements. Since then research activity has been more focusses on business processes and their improvement (using approaches such as BPMN [34], YAWL [33] or BPEL [24]. This aspect will be carefully addressed in the proposed approach as incidents and accidents are more and more attributed to organization malfunction or management issues [29].
In an early book on resilience engineering, Hollnagel stated that resilience is the ability of a system or an organisation to react to and recover from disturbances at an early stage, with minimal effect on the dynamic stability [8] p.16. This highlights the leading role of organizational aspects as fault tolerant mechanism while we consider as in [14] that organization can be a root cause of failures.
DETERMINING/REFINEMENT of:
- Objectives and boundaries of the PAIS under analysis
· Scenarios
· Performance Objectives
IDENTIFICATION/DESCRIPTION/MODELLING of: - Types of functions identification
- Concepts identification · Models (HAMSTERS, ICO, FRAM)
· Concept maps
INTEGRATION of the MODELS: - Models correspondances assessment Integrated models
VARIABILITY ASSESSMENT: - Assessment of quantitative resu lts - Assessment of qualitative results · Performance data – Interaction delays
· Variability analysis table – Instantiations
IDENTIFICATION of RE-DESIGN opportunities: - Opportunities for PAIS re-design evaluation · Opportunities of re-design
Are all the functions and the con cepts represented in the mo dels? I II III IV END IIb IIa
COVERAGE of the PERFORMANCE OBJECTIVES: - Analysis of the results
· Qualitative – Quantitative data analysis
IDENTIFICATION of further INVESTIGATIONS opportunities:
- Opportunities for changing scenarios/for creating new scenarios/for modifying objectives evaluation · Opportunities for changing scenarios/for creating
new scenarios/for modifying objectives Is it need ed to re-design the PAIS? No Yes Do we n eed more investigatio ns? No Yes Yes Yes No Do the in tegrated mo dels rep resen t the
PAIS? Yes No Is the variability assessment d etailed enou gh?
Are the perfo rmance objectives covered? Yes Yes No IIIb IIIa IVa IVb No Yes No Are the perfo rmance
objectives coh eren t with the scen arios? No
No
No
A FEDERATION OF MODELS, A CONCEPT MAP AND THEIR ASSOCIATED DEVELOPMENT PROCESS This section presents the proposed approach to analyze a PAIS. It is centered on the production of a concept map and is supported by complementary modelling techniques presented in the first subsection and by a stepwise process presented in the second subsection.
The selected modelling techniques
Three notations have been selected according to a set of requirements presented in [28]. Some of these requirements were met by existing modelling techniques, others were reachable by extending and refining existing notations. HAMSTERS [17] notation and tool provide support for addressing human activities and human interactions with systems. Compared to other existing tool supported notations such as Concur Task Trees (CTT) [22], it provides structuring mechanisms for dealing with large scale descriptions of tasks. Moreover, HAMSTERS has been extended [19] in order to describe all the information and objects needed to accomplish a task (including different types of knowledge). All these concepts are becoming major elements of the concept maps.
Systems and their behavior are addressed, modelled and analyzed thanks to ICO notation and its associated tool PetShop [23] which provide support to model user interactions and the underlying system. Its specificity is to provide support for modelling concurrent input and output events as well as for modelling objects, which is not possible with other notations such as ATN [34] and Automata [26]. The method for resilience analysis FRAM [6] has been selected for organizational aspects descriptions as it provides support for:
· Representing each element of the Socio-Technical System under analysis;
· Monitoring the Socio-Technical System under analysis in terms of Socio-Technical System’s own performance and possible expected and unexpected changes;
· Identifying areas where an action is needed for improving resilience (human, system and both);
· Representing non-linear dynamic dependencies in a proactive approach;
· Analyzing performance variability (only qualitatively at not quantitatively though).
Most of the existing safety and/or resilience and/or human reliability analysis methods do not provide support for the above mentioned needs. Safety analysis methods such as Failure Mode, Effects and Criticality Analysis (FMECA) [31] and HAZard and OPerability (HAZOP) [9] provide support for analyzing the potential failures and errors that may happen in a systematic way but the results of the application of these methods are tightly coupled to the experience and skills of the analyst. Human reliability
analysis methods such as Cognitive Reliability and Error Assessment Method (CREAM) [7] and Human Error in European Air Traffic Management (HERA) [10] focus precisely on human tasks but do not integrate a precise view on the system. At last, System-theoretic model of accidents (STAMP) [14] is of great help to describe the various elements of the STS but does not provide support for representing nonlinear dynamic dependencies.
Other work [27] tried to integrate HAZOP and operators descriptions but this remained centered on the tasks descriptions and system behavior was left outside the scope of the approach. This is a similar issues with work in [25] where tasks models are modified to describe operator’s errors but again system’s behavior is not accounted for. In all these research work, the organizational aspect are not addressed leaving outside of the analysis a significant number of root causes for failures.
The process and its phases
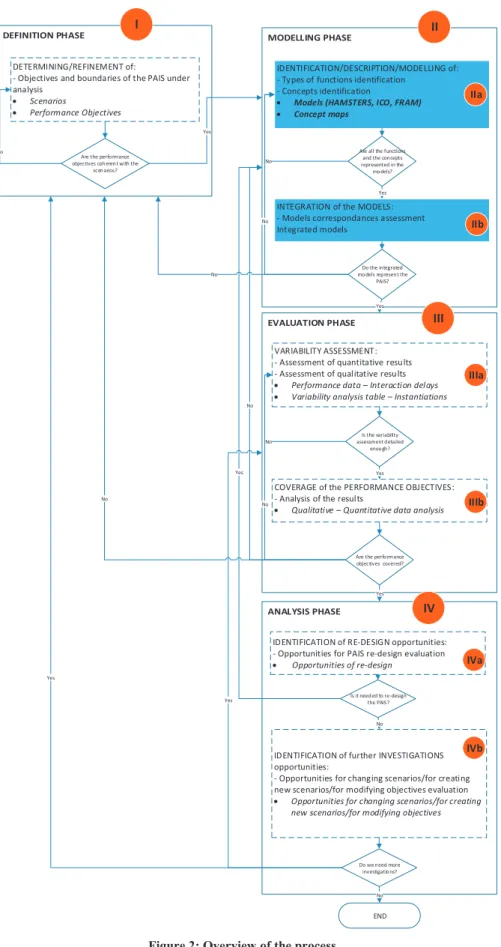
The proposed process aims at describing in an integrated way all the elements of the STS within a single framework. It provides support to analyze resilience and usability properties of a PAIS within a STS. Figure 2 depicts the overview of the process which consists of four main phases: I. The “Definition phase” is the starting point of the process. Its scope is to define/redefine the boundaries and the objectives of the PAIS under analysis. Its outputs are descriptions of scenarios and of performance objectives. Before proceeding to the following phase, the analyst has to verify if performance objectives are consistent with the scenarios identified. If they are not consistent (“No” back loop in phase I in Figure 2), the analyst has to redefine them or redefine the scenarios. Otherwise, the process carries on to phase II.
II. The “Modelling phase” is made up of two sub-phases: a. The “Identification/Description/Modelling” sub-phase
aims at identifying and modelling operators, system and interactive functions as well as their associated concepts (required information, knowledge and objects). The outputs of this sub-phase are the three models (operators’ tasks and functions, system behavior and functions, human-system interactions) and the concept map (gathering information, knowledge and objects manipulated in the three models). In order to proceed with the next sub-phase, the analyst has to verify that all functions and concepts represented in the models appear in the concept map. If they do not (“No” back loop to the IIa sub-phase in phase II in Figure 2), the analyst has to correct the models and/or the concept maps. Otherwise, the analysis proceeds to phase IIb.
b. The “Integration of the Models” sub-phase aims at assessing all the correspondences between models and at integrating them. The outputs of this sub-phase are the integrated models. In order to proceed with the next phase, the analyst has to verify if the models properly
represent the PAIS within its STS (according to the scenarios and the objectives of the analysis). If they do not (“No” back loop in Figure 2), the analyst has to understand why the representation is not consistent with scenarios and objectives. The cause of the problem may be a modelling issue, and in this case, models have to be re-worked/modified. Or, if it is needed to redefine the PAIS under analysis (with associated scenarios and/or objectives of the analysis), the analyst has to re-work on/modify the scenarios and/or objectives re-perform (“Definition phase”, labelled in Figure 2). If the integrated models represent the PAIS within the STS (“Yes” arrow from sub-phase IIb to phase III in Figure 2) the process carries on to phase III.
III. The “Evaluation phase” can be further decomposed into two sub-phases:
a. The “Variability assessment” sub-phase aims at assessing both qualitative and quantitative results from the analysis performed on the integrated models. These sub-phase outputs are performance data and variability analysis tables. In order to proceed with the next sub-phase, the analyst has to verify if the qualitative and quantitative assessments of performance variability are detailed enough to be analyzed. If they are not (“No” back loop to sub-phase IIIa in phase III in Figure 2), the analyst has to re-work on variability assessments. If variability assessments are detailed enough (“Yes” arrow to sub-phase IIIb in phase III, in Figure 2), the process carries on to phase IIIb.
b. The “Coverage of the performance objectives” sub-phase aims at analyzing how many performance objectives are reached by the PAIS and how. This sub-phase output is a coverage estimation. To proceed with the next phase, the analyst has to verify if the performances objectives are covered. If they are not (“No” back loops to phase II and to phase I in Figure 2), the analyst has to understand why. There may be errors in the models and the analyst will have to re-work on them and to modify them. Or, the performance objectives may have to be redefined. If the performance objectives are covered (“Yes” arrow to phase IV in Figure 2), s/he can carry on to phase IV. IV. The “Analysis phase” can be further decomposed into
two sub-phases:
a. The “Identification of re-design opportunities” sub-phase aims at taking into consideration opportunities for re-designing the PAIS. If the PAIS needs to be re-designed, the analyst rework on the models for identifying what it has to be improved or modified. If the PAIS does not need to be re-designed, the analyst can proceed with the next sub-phase
b. The “Identification of further investigations opportunities” sub-phase aims at taking into consideration several opportunities with regards to the on-going analysis. The analyst can identify opportunities
for changing scenarios, for creating new scenarios, and for modifying performances objectives. If additional investigations are required, the analyst has to perform again some previous steps. These can belong to the previous “Evaluation phase” if the analyst needs to assess another level(s) of variability. The analyst may also need to define new scenarios and/or to modify the performance objectives. If further investigations are not required, the process can end.
These phases and sub-phases are ordered in a consecutive way for sake of understandability. However, they can be performed in an iterative way until the objectives are reached. This means that the presented multi-models based approach is iterative both at the generic level (between phases) and at the specific level (within each phase). More details about the content of each phase can be found in [28]. The concept mas as a glue in the modelling phase. Despite the many differences among theories of knowledge representation, they share a fundamental assumption that knowledge can be modelled in terms of a set of components and their relationships. Concept mapping is a method for externalizing such a structure in a single artefact, making concepts and relationships explicit [13]. Moreover, they can be used either to represent knowledge or be used by automated systems for reasoning about the represented knowledge. As information, objects and knowledge are represented in each model, we propose to use such data as a glue for integrating modeling techniques for the analysis and re-design of partly-autonomous interactive systems. It can thus be considered as the corner stone of the approach bringing all the other models together.
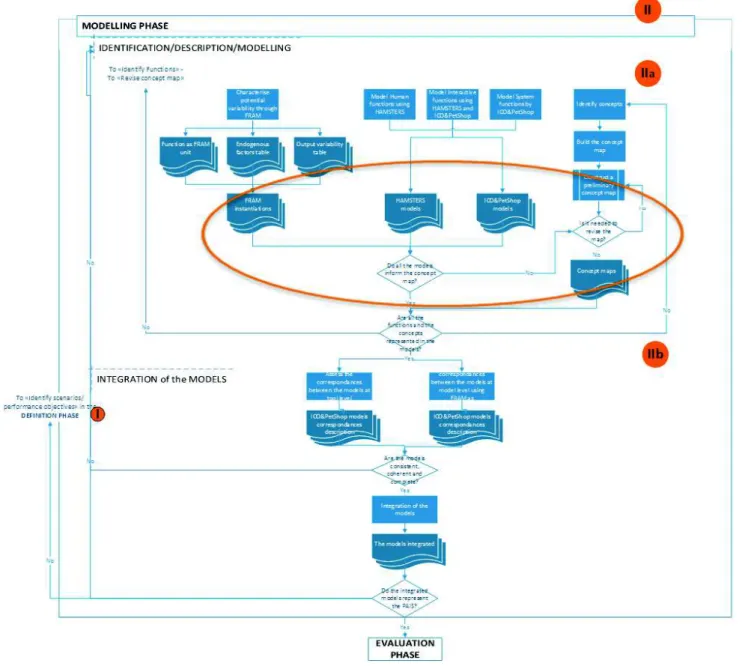
Indeed, concept maps provide a unified description of all the concepts (information, objects, knowledge and their relationships) that are modelled through the selecting modelling techniques in the first sub-phase IIa (the flow on the left side in Figure 3) of the second main phase. To obtain this unified description it is needed to perform several steps (summarized in Figure 3 - parallel flow on the right side). In particular (as highlighted by the orange circle in that figure), once all the models are built their content inform the concept map ensuring an exhaustive coverage of data and also supporting consistency checking for all the functions and the concepts. This preliminary check, it is fully accomplished in the second sub-phase of the modelling phase.
Once a complete representation of all the functions has been obtained through the three modelling techniques (FRAM, HAMSTERS and ICO&PetShop) and once a complete representation of the concepts has been obtained and gathered in concept maps, the correspondences between models have to be assessed (“Assess the correspondences between models at tool level” on the left side in Figure 3 and “Assess the correspondences between models at model level using FRAM as correspondence editor” on the right side in Figure 3) respectively (beginning of the IIb sub-phase).
HAMSTERS and ICO&PetShop models can be integrated both at model and at tool level as presented in [1]. This means that a variation of the system model that impacts a human task will trigger a change in the corresponding task model and vice versa. This helps in iteratively refining models of both types until all the corresponding models are consistent and coherent between each other. In addition, the integration of the system and task models with the FRAM instantiations, at the model level, provides a complementary view for assessing consistency and coherence between system and
task models, as it enables to verify the sequence of function calls between models [20].
The current paper goes beyond previous work such as [20] and [18] as it proposes the use of a concept map as a mean for systematically structuring and recording data from the various models and for assessing the consistency and the discrepancies of the three types of models. This assessment of models consistency is explained in the following section using a practical example.
Figure 3: Modelling phase THE PROCESS IN PRACTICE
The proposed process has been applied to a case study taken from the ATM domain: an aircraft route change. This case study has been already used in [20] for illustrating a
simplified version of the approach focused on functional resonance analysis. Current paper further extends that previous work by exploring variability issues and re-design opportunities. Due to space constraints, we cannot present in
detail each phase. We briefly describe the scenario and then, we focus on the concept map and we provide an example of ICO, FRAM and HAMSTERS models and how the concept map is central to this integration.
Application of the definition phase
WXR is an application currently deployed in many cockpits of commercial aircraft. It provides support to pilots’ activities by providing information about meteorological phenomena during the flight, allowing them, for instance, to whether or not they have to request a trajectory change, in order to avoid storms or precipitations. In the proposed scenario, due to a weather perturbation, the pilot needs to change route. This way, a new heading is requested for avoiding that perturbation. Contact is made with the executive air traffic controller (EXC) in charge of the sector. When the EXC receives the request, the request clearance is analyzed it in order to assess safety and regulatory consequences according to current air traffic flow, current position of the aircraft and parameters of the requested clearance. In the scenario considered, the EXC decides that the requested heading clearance is not compliant with the trajectories of some aircraft in the sector. Thus, EXC rejects the clearance that was requested by the pilot. The coordination can take time in order to identify the suitable solution for both. Finally, EXC acknowledges the last requested clearance and the pilot can execute it entering the new heading through the Flight Control Unit (FCU) and the weather perturbation is avoided.
This scenario makes it possible to identify performance objectives related to the resilience (i.e. the pilot should be able to find an appropriate new route and to get approval to implement this new route whatever the surrounding traffic and weather conditions) and to the usability (i.e. the maximum time to configure the WXR interactive application for displaying weather conditions on the current route shall not exceed 10 seconds) properties of the PAIS under analysis.
Application of the modelling phase
According to the process presented above, when the scenario is defined, models of operators’ tasks, system and interactive functions as well as their associated concepts (required information, knowledge and objects). Thanks to FRAM we can characterize potential variability for each identified function. For example, one of the functions is “Execute the clearance”. This is represented as FRAM unit in Figure 4.
P T R O I C Execute the clearance
· Aircraft status monitored · Weather radar status monitored
and operational
· Contact between ATCOs and pilots established Coordination accomplished · Flight Plan · On-board instruments · MPIA · Radio · Navigation Display · FCU · Pilots Heading changed
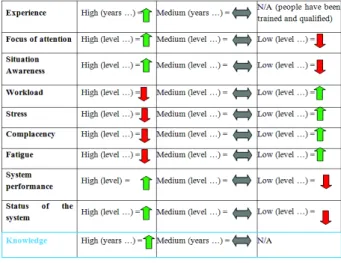
Figure 4: “Execute the clearance” function as FRAM unit Then, through FRAM endogenous (Table 1) and exogenous factors (Table 2) tables, we can describe all the factors that can affect the variability of the described function.
Table 1: Endogenous factors of variability related to “Execute the clearance” function
Table 2: Exogenous factors of variability related to “Execute the clearance” function
The impact of these factors can be positive, neutral or negative represented by a green, grey or red arrow respectively and it can affect the function output variability in terms of time and precision (Table 3).
Table 3: Output variability of "Execute the clearance" function
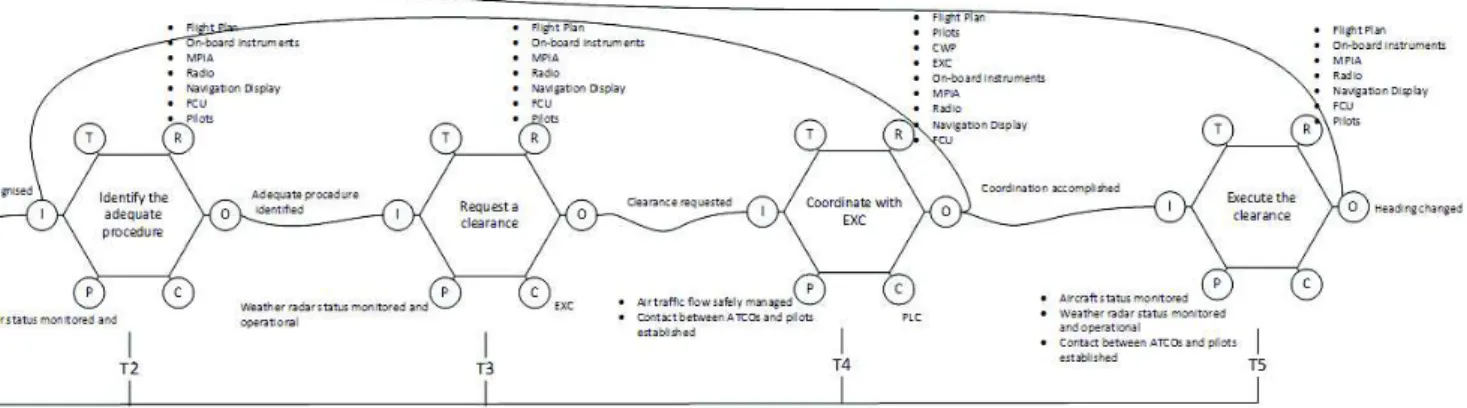
Once all these steps have been accomplished for each identified function, it is possible to build a FRAM instantiation. Figure 5 illustrates an excerpt of the FRAM
instantiation of the WXR case study. The instantiation shows how the functions are coupled between them. These couplings allow us to preliminary detect the functional resonance and how they can be affected from its propagation. Once we have identified the functions, according to the type (human, system or interactive), we use dedicated modelling techniques for building the related models. Regarding the system models, Figure 6 shows the ICO&PetShop model of range selection WXR functionality. The setting of the range detection of the weather radar is done using a FCU physical knob by switching between 6 values (from 1 to 6). Each time the value is set an event is raised (holding this value) by the knob and received by a dedicated part of the cockpit application.
Figure 5. Excerpt of FRAM instantiation of the WXR case study
Figure 6: ICO&PetShop – Behavior of the range selection Figure 6 maps the value (form 1 to 6) into a range value that is sent to the WRX equipment. The event is received and the selected value is extracted by one of the two transitions called valueChanged_T1 and valueChanged_T2.
The place RangeMapping contains the mapping between a value and the corresponding range (for instance 1 corresponds to range 10, 2 to 20…). Finally, the WXR equipment range is set with the selected range by the firing of transition mapIndexToRange.
Regarding the task models, Figure 7 illustrates the task model of the “Execute the clearance (change heading)” task. At the higher level of the tree, there is an iterative activity
“Manage change heading request” that is interrupted (operator [>) by a cognitive analysis task “Analyse that change heading clearance has been received” which can be allowed to the pilot to “Enter the new heading” abstract task. In the scenario under analysis in which the pilot can request a clearance at time, the iterative activity “Manage change heading request” has to be performed several times in order to find the appropriate clearance matching the pilot and the EXC needs. However, as represented in the model, the pilot could make a choice (operator [] by “Request a clearance” abstract task): instead of following the communication/coordination protocol with the ATCOs requesting a clearance at time (“Decide about new heading” and “Ask for new heading clearance” tasks linked to the information “requested heading”), s/he can adopt a strategy (the StK “Communication/coordination with the ATCOs”). In this case, the pilot can “Decide about several possible headings” and “Ask for heading clearance with several options” providing a list of possible headings (information represented by a yellow box) to the EXC. This strategy could reduce the number of iterations between the pilot and the EXC. But this strategy is not the standard procedure and will be applied depending on the person who is in charge of the aircraft and on a common agreement with the remote EXC
These are just examples for illustrating how, for each STS elements, we have a dedicated modelling technique. Moreover, in parallel, we have to build the corresponding concept map. This provide a unified description of all the
concepts (information, objects, knowledge and their relationships) and it can be used either to represent knowledge and/or to support automated systems for reasoning about the represented knowledge.
Figure 7: HAMSTERS 2.0 task model of the “Execute the clearance (change heading)” task
The concept map as the corner stone of the federation of models
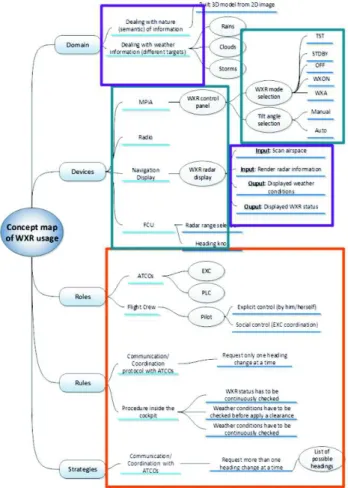
Figure 8 represents required declarative knowledge necessary to be able to use the WXR. The concepts which are necessary or useful to perform actions during the flight phase are grouped and linked through a semantic network. It is made up of 5 key concepts or nodes that are Domain, Roles, Rules, Strategies and Devices. In this case study, these concepts are further detailed and applied to the specific context of the WXR. Structure from left to right shows the refinement of concepts, from abstract to concrete, as well as the instantiation. For example, the concept of “ATCOs” is instantiated twice: the “EXC” instance and the “PLC” instance. Lastly, relationships between refined concepts can also be represented in an explicit way, using links. In order to illustrate the concept map in a seamless way and facilitate its reading, they are not shown here.
Figure 8 shows how all the represented concepts, in the concept map, have a corresponding representation in one or several models produced with the task, system or organization selected modelling technique.
The integration of the modelling techniques
The models provide various perspectives able to cover the characteristics of the different interacting complex components concurring to the achievement of the whole system of systems’ goals. However, these multiple views on the same system must be consistent and overlapping as little as possible in order to reduce duplication of work [18].
Figure 8: Concept map of WXR usage and concepts corresponding representation in one or several models
The integration can be or at tool level (e.g. between HAMSTERS and ICO&PetShop) or at the model level using FRAM, which is not supported by a tool, as correspondence editor. The principle of editing the correspondences between the two models is to put together interactive input tasks (from the task model) with system inputs (from the system model) and system outputs (from the system model) with interactive output tasks (from the task model).
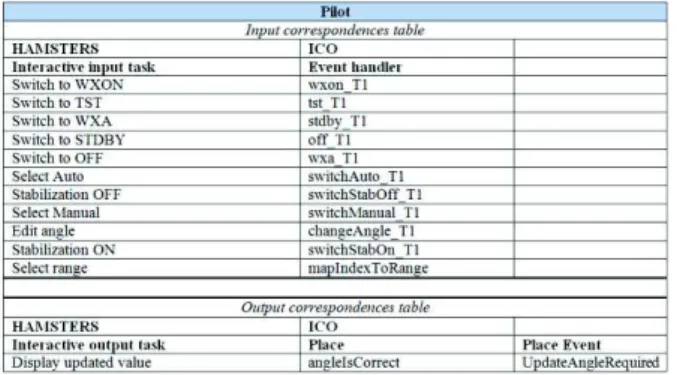
Table 4 is an example of the output of this integration in which the principle of editing the correspondences between the two models is to put together system outputs Place Event “UpdateAngleRequired” in Place “AngleIsCorrect” (from the ICO&PetShop model) with Interactive output tasks “Display update value” (from the HAMSTERS 2.0 model). Setting up this correspondence may show inconsistencies between the task and system model such as interactive tasks not supported by the system or rendering information not useful for the tasks performance. This integration allows a real co-evolution of two models, as the execution of one tool impacts the execution of the other tool. This integration can provide designers with shorter iterations in the task and system modelling process [1]. It also represents an improvement for the end user as the execution of the system should support training and provide contextual help. At the model level, FRAM (and its function instantiations) can be considered as a metamodel for connecting and representing the correspondences between HAMSTERS 2.0 and ICO models. It can be defined as a correspondence editor. The task models built through HAMSTERS 2.0 have their respective “Human functions” in the FRAM instantiations. This is also true for the system models built through PetShop which have the correspondent “System functions” in FRAM. In case of the interactive functions, at each variation on the task model, which impacts on system component, corresponds a change on the system model and vice versa. This means that in FRAM the output of the “Human function” (which corresponds to the HAMSTERS model) causes an input in the “Interactive function” generating a change in the correspondent system model (modelled through PetShop).
Table 4: WXR case study – HAMSTERS 2.0 and Ico&PetShop models correspondences
Figure 9 shows an example of the role of FRAM as correspondence editor in the WXR case study. On the left side, an excerpt of the “HAMSTERS 2.0 task model of the subroutine “Manage weather radar” task”. The task model has its correspondent function, named “Edit angle”, in the FRAM instantiation. For accomplishing this task, the pilot has to perform some consecutive tasks. One of these is to “Edit angle” (the orange box in the task model).
This HAMSTERS 2.0 Interactive Input task has its correspondent in the PetShop model (the orange box in the system model). In FRAM, this correspondence is assessed through the output “Angle edited” of the function “Edit angle” which is the input for activating the “Display updated value” function. Consequently, this system function has its correspondent in the ICO model (the blue box in the system model) which has its correspondent in the HAMSTERS 2.0 model (the blue box in the task model). These assessments ensure that the models are consistent, coherent, and complete.
Figure 9: FRAM as correspondence editor in the WXR case study
Application of the evaluation phase
Once we have built and integrated all models, it is necessary to assess the variability. This can be evaluated both quantitatively, using HAMSTERS and ICO&PetShop, and also qualitatively, using FRAM. Both outputs and their comparison provide a complete variability assessment which supports the identification of good candidates for re-design opportunities for improving the usability and the resilience of the PAIS. Due to space constraints, we cannot describe all the steps of this evaluation but, in the current scenario of the WXR case study, this assessment shown that the pilot could not be able to find an appropriate new route and to get approval to implement this new route whatever the surrounding traffic and weather conditions. Indeed, the qualitative variability analysis between the coupling factors (Time and Precision) of the “Coordinate with EXC” function have shown that its impact, medium and high, can affect the downstream function and the entire system under analysis in term of clearance execution.
Application of the analysis phase
From the results of the evaluation, we can identify an opportunity for re-designing the PAIS under analysis such as changing, on the human side, a task for allowing the pilot in
requesting more than one clearance at a time to avoid delays in coordination exchanges (Figure 10).
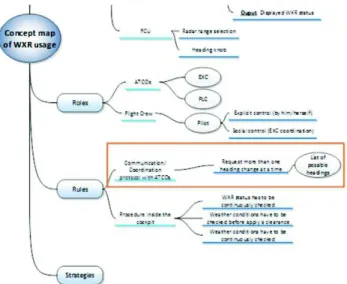
Figure 10: Excerpt of the revised HAMSTERS 2.0 model Thanks to the fact that we take into account the PAIS within its STS as a whole, we are able to indifferently re-design human or system aspects for improving the resilience of the whole STS. However, due to the fact that all the models have to be coherent, consistent and complete between them, the current change in the HAMSTERS 2.0 model, which involves the knowledge, should be reflected in the concept map. Differently from the previous concept map (Figure 8) and according to the revised HAMSTERS 2.0 model, Figure 11 shows the revised concept map of WXR usage in which there is no Strategy but this has been implemented in the Rules as “Communication/coordination protocol with ATCOs” (highlighted by the orange box).
Figure 11: Excerpt of the revised WXR usage concept map Once the re-design opportunity has been identified, it is needed to come back to the modelling phase in order to integrate all the models and to re- perform all the required steps for evaluating, qualitatively and quantitatively, the whole variability of the revised PAIS (unfortunately due to space constraints, we cannot re-perform all the required
steps). Furthermore, the developed approach can support automation design, as it enables the comparison between several design opportunities to allocate tasks and functions between users and systems.
HANDLING AUTOMATION IN THE PROCESS
The case study has presented a re-design opportunity based on changing operator tasks and the procedures of the socio-technical system. However, other opportunities based on automation exist. The operators’ tasks that are resource consuming (e.g. time) would be good candidates for migration in the system. For this case study of the ATC clearances, the list of possible clearances could be sent altogether to the ATC via the data link. For this re-design opportunity, modelling phase would be more complex involving the production of new ICO models that would add new functions to the system. In such case no modification would have been made to the user interface but design alternatives could also require changes there (for instance showing progress in the sending of clearances). The stage called “integration of models” would be performed again as well as the downstream stages. The proposed process then provides support for analyzing and re-designing automation at a fine grain level thanks to the integration of the 3 types of models (human, system, organization). Each step of the process can deal with automation design as even the definition phase can issue an objective related to particular automation levels. More details on how such integration of operators’ tasks, user interfaces and system automations have been presented in [16].
CONCLUSION
When adding a new technology or an enhanced version of an existing technology in a STS, such as aircraft glass cockpits or Air Traffic Control stripless workstations equipped with Arrival MANager (AMAN) or Departure MANager (DMAN), the unpredictable nature of humans can bring human-related unreliability issues in addition to technical unreliability. On the industrial side, even though classical development processes are employed for the development of such systems, they are not able to guarantee both usability and resilience of the produced PAIS. On the research side, reduced views are used for the development of PAIS within a STS which usually focus on some specific aspects and hide away other ones due to STS complexity. These limited views allow providing local solutions to the development issues but their integration is usually claimed to be beyond the scope of the research.
This paper has proposed a multi-model-based approach for to describe the STS at the adequate level both for design and analysis purposes. The approach is organized around a development process of models and an integration of those models using a specific artefact called concept map. While the paper focused on ATM Systems, the definition of the models and the process for using them make them applicable to other domains. We have applied some aspects of the approach to satellite ground segments and interactive
cockpits of large civil aircrafts demonstrating that the approach is suitable to other large scale STSs (even though some adjustments are required to manage their idiosyncrasies).
ACKNOWLEDGMENTS
This work was partly funded by HALA! SESAR research network and SESAR WPE SPAD project.
REFERENCES
1. Barboni E., Ladry J-F, Navarre D., Palanque P., Winckler M. Beyond modelling: an integrated environment supporting co-execution of tasks and systems models. ACM EICS 2010: 165-174, ACM DL. 2. Barboni, E., Lanzi, P., Martinie, C., Palanque, P., Pasquini, A.,
Ragosta, M. and Winckler, M., Formal Tasks and Systems Models as a Tool for Specifying and Assessing Automation Designs. ATACCS 2011, ACM DL, 2011, pp. 46-50
3. Emery, F., & Trist, E. (1960). Management Science Models and Techniques, vol. 2. In C. Churchman, & M. Verhulst, Socio-technical systems. pp. 83–97. Pergamon, Oxford, UK.
4. Finkelstein C. An Introduction to Information Engineering: From Strategic Planning to Information Systems, Addison-Wesley Longman Publishing Co., Inc., Boston, MA, 1990
5. HALA¡ SESAR Research Network, 2014. E-01-02: Position Paper, Ed.00.00.02
6. Hollnagel, E. (2012). FRAM: The functional resonance analysis method for modelling complex socio-technical systems. Farnham, UK: Ashgate.
7. Hollnagel, E. 1998. Cognitive Reliability and Error Analysis Method. Elsevier Science, Oxford.
8. Hollnagel, E., "Resilience - the Challenge of the Unstable (Chapter 1)." Resilience Engineering: Concepts and Precepts. 2006. 9. IEC 61882:2001 Hazard and Operability Studies (HAZOP Studies) -
Application Guide.
10. Isaac, A., Shorrock, S., & Kirwan, B. (2002). Human error in European air traffic management: The HERA project. Reliability Engineering and System Safety, 75(2), 257-272.
11. Jackson M.A. System development (Prentice-Hall International series in computer science), Prentice-Hall, Inc., Upper Saddle River, NJ, 1983
12. Jacob, R. (1999). A Software Model and Specification Language for Non-WIMP User Interfaces. ACM Transactions on Human-Computer Interactions, vol. 6, n. 1, pp. 1-46.
13. Leake, D. B., Maguitman, A., & Reichherzer, T. (2004).
Understanding knowledge models: Modeling assessment of concept importance in concept maps. In R. Alterman, & D. Kirsch (Éd.), Proc. of the 26th annual conference of the cognitive science society; Mahwah, NJ: Lawrence Erlbaum, pp. 795-800.
14. Leveson, N. G. (2004). A New Accident Model for Engineering Safer Systems. Science, 42(4), 237-270.
15. Management (BPM'06), Schahram Dustdar, José Luiz Fiadeiro, and Amit P. Sheth (Eds.). Springer-Verlag
16. Martinie C., Palanque P., Barboni E., Ragosta M. Task-model based assessment of automation levels: Application to space ground segments. SMC 2011: 3267-3273
17. Martinie, C., Palanque, P., & Winckler, M. (2011). Structuring and Composition Mechanism to Address Scalability Issues in Task
Models. INTERACT 2011. LNCS 6948, pp. 589-609. Lisbon, Portugal: Springer Verlag.
18. Martinie, C., Palanque, P., Pasquini, A., Ragosta, M., Rigaud, E., Silvagni, S. (2012) Using Complementary ModelS-Based Approaches for Representing and Analysing ATM Systems' Variability. ATACCS 2012, London, UK, ACM DL, 2012.
19. Martinie, C., Palanque, P., Ragosta, M. (2013) Extending Procedural Task Models by Explicit and Systematic Integration of Objects, Knowledge and Information, In ECCE 2013, 26 – 28 August, Toulouse, France
20. Martinie, C., Palanque, P., Ragosta, M., Sujan, M. A., Navarre, D., (2013) Understanding functional resonance through a federation of models: preliminary findings of an avionics case study, SafeComp 2013, LNCS, Springer Verlag.
21. Meshkati, N. (1989). Technology transfer to developing countries: a tripartite micro- and macro ergonomic analysis of
human-organization-technology interfaces. International Journal of Industrial Ergonomics, 4, 101-115
22. Mori G., Paternò F. & Santoro C: CTTE: Support for Developing and Analyzing Task Models for Interactive System Design. IEEE Trans. Software Eng. 28(8): 797-813 (2002).
23. Navarre, D., Palanque, P., & Bastide, R. (2004). A formal description technique for the behavioral description of interactive applications compliant with ARINC 661 specifications. HCI-Aero’04. Toulouse 24. Oracle BPEL Process Manager.
http://www.oracle.com/technology/products/ias/bpel/index.html 25. Palanque P., Basnyat S. Task Patterns for Taking Into Account in an
Efficient and Systematic Way Both Standard and Erroneous User Behaviours. IFIP conference on Human Error, Safety and Systems Development 2004: 109-130
26. Parnas, D. L. (1969). On the use of transition diagrams in the design of a user interface for an interactive computer system. Proceedings 24th National ACM Conference, (pp. 379-385).
27. Paternò F., Santoro C. Preventing user errors by systematic analysis of deviations from the system task model. Int. J. Hum.-Comput. Stud. 56(2): 225-245 (2002)
28. Ragosta, M. A multi-modelS based approach for the modelling and the analysis of usable and resilient partly autonomous interactive systems. PhD Thesis. May 7th, 2015. University of Toulouse. 29. Reason, J. (1997): Managing the Risks of Organizational Accidents.
Ashgate, England.
30. Tardieu, H., Rochfeld, A., Colletti, R., 1985 "La Méthode MERISE". Tome 1. ISBN
31. Tardieu, H., Rochfeld, A., Colletti, R., Panet, G., Vahée, G., 1987 "La Méthode MERISE". Tome 2. ISBN: 2-7081-0703-8. Ed. Les Edition d'organization
32. U.S. Department of Defense, Procedures for Performing a Failure Mode, Effects and Criticality Analysis. 1980. MIL-STD-1629A. 33. van der Aalst W., ter Hofstede A. YAWL: yet another workflow
language, Information Systems, v.30 n.4, p.245-275, June 2005. 34. Wohed P., van der Aalst W., Dumas M., ter Hofstede A., and Russell
N. 2006. On the suitability of BPMN for business process modelling. In Proceedings of the 4th international conference on Business Process Management (BPM'06), LNCS, Springer-Verlag, 161-176.
35. Wood, W. (1970). Transition network grammars for natural language analysis. Communications of the ACM, vol. 13, issue 10.