TH `ESE
TH `ESE
En vue de l’obtention du
DOCTORAT DE L’UNIVERSIT´E DE TOULOUSE
D´elivr´e par : l’Universit´e Toulouse 3 Paul Sabatier (UT3 Paul Sabatier)
Pr´esent´ee et soutenue le 05/10/2020 par :
Mahmoud QODSEYA
Managing Heterogeneous Cues in Social Contexts - A Holistic Approach for Social Interactions Analysis
JURY
Oscar PASTOR Universit´e polytechnique de
Valence Rapporteur
Christophe NICOLLE Universit´e de Bourgogne Rapporteur
Jean-Pierre JESSEL Universit´e de Toulouse Examinateur
Donatello CONTE Universit´e de Tours Examinateur
Guillaume CABANAC Universit´e de Toulouse Invit´e
Pierre DUFRESNE Toulouse Tech Transfer Invit´e
Florence S`EDES Universit´e de Toulouse Directrice de Th`ese Jean-Pierre POULAIN Universit´e de Toulouse Co-directeur de th`ese
´Ecole doctorale et sp´ecialit´e :
EDMITT - Ecole Doctorale Math´ematiques, Informatique et T´el´ecommunications de Toulouse, Sp´ecialit´e : Informatique et T´el´ecommunications
Unit´e de Recherche :
IRIT : Institut de Recherche en Informatique de Toulouse (UMR 5505)
Directeur(s) de Th`ese :
Florence S `EDES et Jean-Pierre POULAIN
Rapporteurs :
Managing Heterogeneous Cues in
Social Contexts - A Holistic
Approach for Social Interactions
Analysis
Mahmoud QODSEYA
octobre 2020
R E M E R C I E M E N T
Je tiens à remercier tout particulièrement et à témoigner toute ma reconnaissance à ma directrice de thèse Pr. Florence Sèdes et mon codirecteur Pr. Jean-Pierre
Poulain, pour l’expérience enrichissante, du fait de son interdisciplinarité, et pleine d’intérêt qu’ils m’ont permis de vivre durant ma thèse, pour leur implication, leurs précieux encadrements et surtout leur soutien, jusqu’à la concrétisation de mon contrat sur la plateforme OVALIE. L’humain est au cœur de cette thèse en Informatique, à l’image de leur humanité. . .
Pr. Jean-Pierre Jessel, aussi humain et l’esprit affûté, curieux et entrepreneur, s’est dévoué pour présider ce jury : merci à vous, M. le (Vice-)Président de notre Université.
Ma gratitude aux membres du jury pour avoir accepté d’évaluer ce travail :
Pr. Christophe Nicolle, d’après ce que m’a expliqué Pr. Sèdes, est très intéressé par l’objet de notre étude : l’interaction sociale au restaurant . A-t-il enfin eu la réponse à sa question « qu’est-ce que l’intelligence artificielle va penser de moi ? » ?...
Pr. Oscar Pastorm’a convaincu, moi qui viens de la robotique et du monde de la vision, que « Using Conceptual Model Technologies for Understanding the Human . . . » était un vrai verrou scientifique. L’analyse des interactions sociales ibériques nous tient à cœur pour de futures perspectives de collaboration.
M. Guillaume Cabanac, éminent « scientomètre », s’intéresse plutôt aux interactions scientifiques, mais après tout n’est-ce pas une autre forme de socialisation, dans ce monde (post-)(pré ?)confiné ? M. Cabanac, please, « T’AS PENSÉ À RETWEETER MON ARTICLE ? » .
M. Donatello Conte, vous avez aiguisé mon appétit vec « Video Processing for Human Behavioral Analysis” Track@SAC 2020 et même si notre proposition fut refusée, le fait que de tels calls émergent prouve la pertinence en devenir de notre objet de recherche.
Je saisis cette occasion pour exprimer ma reconnaissance envers mes amis et collègues Mahdi Washha, Joël Courant, Franck Panta et Wafa Abdelghani qui m’ont apporté leur soutien moral et intellectuel tout au long de ma thèse, ainsi que l’ensemble des membres de l’IRIT qui m’ont consacré leur temps pour les enregistrements qui ont valorisé ma recherche dans notre mini-lab bricolé.
Un message à l’attention de l’Université Fédérale Toulouse Midi-Pyrénées et à la Région Occitanie sans qui rien n’aurait démarré: le financement de cette thèse dans la cadre du programme APR (Appel à Projets de Recherche) a matérialisé la collaboration entre les équipes de l’IRIT et du CERTOP, avec le soutien de l’ISTHIA et de Taylor’s University (KL, Malaysia). Un grand pas pour l’interdisciplinarité et le partage des cultures. . .
J’adresse également mes remerciements à TTT (Toulouse Tech Transfer) pour avoir cru en notre projet SOIF (SOcial Interactions analysis Framework) dans le cadre du programme Proto’Pitch Challenge. M. Pierre Dufresne, son Président (CEO), est présent aujourd’hui et cette marque d’intérêt prouve le lien fort et nécessaire à la recherche que sont le transfert et la valorisation.
J ’adresse mes remerciements également à ma mère, à qui je dois la réussite, pour l’éducation qu’elle m’a prodiguée ; avec tous les moyens et au prix de tous les sacrifices qu’elle a consentis à mon égard, pour le sens du devoir qu’elle m’a enseigné depuis mon enfance, mon père, mes frères, et mes sœurs pour leurs encouragements. Je désire aussi remercier ma femme, Mounia, pour son soutien inconditionnel qui m’a donné la force et la patience d’accomplir ce travail. Enfin, je tiens à remercier ma fille Cataleya, qui est venue au monde il y a deux mois, de m’avoir donné un bonheur et un plaisir illimité.
Mahmoud Qodseya
The purpose of abstraction is not to be vague, but to create a new semantic level in which one can be absolutely precise. — Edsger Dijkstra
A B S T R A C T
Social interaction refers to any interaction between two or more individuals, in which information sharing is carried out without any mediating technology. This interaction is a significant part of individual socialization and experience gaining throughout one’s lifetime. It is interesting for different disciplines (sociology, psychology, medicine, etc.). In the context of testing and observational studies, multiple mechanisms are used to study these interactions such as questionnaires, direct observation and analysis of events by human operators, or a posteriori observation and analysis of recorded events by specialists (psychologists, soci-ologists, doctors, etc.). However, such mechanisms are expensive in terms of processing time. They require a high level of attention to analyzing several cues simultaneously. They are dependent on the operator (subjectivity of the analysis) and can only target one side of the interaction. In order to face the aforemen-tioned issues, the need to automatize the social interaction analysis process is highlighted. So, it is a question of bridging the gap between human-based and machine-based social interaction analysis processes.
Therefore, we propose a holistic approach that integrates multimodal hetero-geneous cues and contextual information (complementary "exogenous" data) dynamically and optionally according to their availability or not. Such an ap-proach allows the analysis of multi "signals" in parallel (where humans are able only to focus on one). This analysis can be further enriched from data related to the context of the scene (location, date, type of music, event description, etc.) or re-lated to individuals (name, age, gender, data extracted from their social networks, etc.). The contextual information enriches the modeling of extracted metadata and gives them a more "semantic" dimension. Managing this heterogeneity is an essential step for implementing a holistic approach.
The automation of « in vivo » capturing and observation using non-intrusive devices without predefined scenarios introduces various issues that are related to data (i) privacy and security; (ii) heterogeneity; and (iii) volume. Hence, within the holistic approach we propose (1) a privacy-preserving comprehensive data model that grants decoupling between metadata extraction and social interaction analysis methods; (2) geometric non-intrusive eye contact detection method; and (3) French food classification deep model to extract information from the video content. The proposed approach manages heterogeneous cues coming from dif-ferent modalities as multi-layer sources (visual signals, voice signals, contextual information) at different time scales and different combinations between layers (representation of the cues like time series). The approach has been designed to
operate without intrusive devices, in order to ensure the capture of real behav-iors and achieve the naturalistic observation. We have deployed the proposed approach on OVALIE platform which aims to study eating behaviors in different real-life contexts and it is located in University Toulouse-Jean Jaurès, France.
Keywords: Observational studies, Social interaction analysis, Heterogeneous Social cues, Eating behavior analysis
R É S U M É
Une interaction sociale désigne toute action réciproque entre deux ou plusieurs individus, au cours de laquelle des informations sont partagées sans « médiation technologique ». Cette interaction, importante dans la socialisation de l’individu et les compétences qu’il acquiert au cours de sa vie, constitue un objet d’étude pour différentes disciplines (sociologie, psychologie, médecine, etc.). Dans le con-texte de tests et d’études observationnelles, de multiples mécanismes sont utilisés pour étudier ces interactions tels que les questionnaires, l’observation directe des événements et leur analyse par des opérateurs humains, ou l’observation et l’analyse à posteriori des événements enregistrés par des spécialistes (psycho-logues, socio(psycho-logues, médecins, etc.). Cependant, de tels mécanismes sont coûteux en termes de temps de traitement, ils nécessitent un niveau élevé d’attention pour analyser simultanément plusieurs descripteurs, ils sont dépendants de l’opérateur (subjectivité de l’analyse) et ne peuvent viser qu’une facette de l’interaction. Pour faire face aux problèmes susmentionnés, il peut donc s’avérer utile d’automatiser le processus d’analyse de l’interaction sociale. Il s’agit donc de combler le fossé entre les processus d’analyse des interactions sociales basés sur l’homme et ceux basés sur la machine.
Nous proposons donc une approche holistique qui intègre des signaux hétérogènes multimodaux et des informations contextuelles (données "exogènes" complémentaires) de manière dynamique et optionnelle en fonction de leur disponibilité ou non. Une telle approche permet l’analyse de plusieurs "signaux" en parallèle (où les humains ne peuvent se concentrer que sur un seul). Cette analyse peut être encore enrichie à partir de données liées au contexte de la scène (lieu, date, type de musique, description de l’événement, etc.) ou liées aux individus (nom, âge, sexe, données extraites de leurs réseaux sociaux, etc.) Les informations contextuelles enrichissent la modélisation des métadonnées extraites et leur donnent une dimension plus "sémantique". La gestion de cette hétérogénéité est une étape essentielle pour la mise en œuvre d’une approche holistique.
L’automatisation de la capture et de l’observation « in vivo » sans scénarios prédéfinis lève des verrous liés à i) la protection de la vie privée et à la sécurité ; ii) l’hétérogénéité des données ; et iii) leur volume. Par conséquent, dans le cadre de l’approche holistique, nous proposons (1) un modèle de données complet préservant la vie privée qui garantit le découplage entre les méthodes d’extraction des métadonnées et d’analyse des interactions sociales ; (2) une méthode géométrique non intrusive de détection par contact visuel ; et (3) un modèle profond de classification des repas français pour extraire les informations du contenu vidéo. L’approche proposée gère des signaux hétérogènes provenant de différentes modalités en tant que sources multicouches (signaux visuels,
signaux vocaux, informations contextuelles) à différentes échelles de temps et différentes combinaisons entre les couches (représentation des signaux sous forme de séries temporelles). L’approche a été conçue pour fonctionner sans dispositifs intrusifs, afin d’assurer la capture de comportements réels et de réaliser l’observation naturaliste. Nous avons déployé l’approche proposée sur la plateforme OVALIE qui vise à étudier les comportements alimentaires dans différents contextes de la vie réelle et qui est située à l’Université Toulouse-Jean Jaurès, en France.
Mots clés : Études observationnelles, Analyse des interactions sociales, De-scripteurs sociaux hétérogènes, Analyse du comportement alimentaire
P U B L I C AT I O N S
Our ideas and contributions have already been published in the following scien-tific publications:
International conference papers
1. Mahmoud Qodseya, Franck Jeveme Panta, and Florence Sèdes. Visual-based eye contact detection in multi-person interactions. In 2019 International Conference on Content-Based Multimedia Indexing, CBMI 2019, Dublin, Ireland, September 4-6, 2019, pages 1–6, 2019
2. Mahmoud Qodseya. Visual non-verbal social cues data modeling. In Ad-vances in Conceptual Modeling - ER 2018 Workshops Emp-ER, MoBiD, MREBA, QMMQ, SCME, Xi’an, China, October 22-25, 2018, Proceedings, pages 82–87, 2018
3. Mahmoud Qodseya, Mahdi Washha, and Florence Sèdes. Dievent: Towards an automated framework for analyzing dining events. In 34th IEEE Interna-tional Conference on Data Engineering Workshops, ICDE Workshops 2018, Paris, France, April 16-20, 2018, pages 163–168, 2018
4. Franck Jeveme Panta, Mahmoud Qodseya, André Péninou, and Florence Sèdes. Management of mobile objects location for video content filtering. In Proceedings of the 16th International Conference on Advances in Mobile Computing and Multimedia, MoMM 2018, Yogyakarta, Indonesia, November 19-21, 2018, pages 44–52, 2018
5. Franck Jeveme Panta, Mahmoud Qodseya, Geoffrey Roman-Jimenez, André Péninou, and Florence Sèdes. Spatio-temporal metadata querying for cctv video retrieval: Application in forensic. In Proceedings of the 9th ACM SIGSPATIAL International Workshop on Indoor Spatial Awareness, pages 7–14. ACM, 2018
S U M M A R Y
1 i n t r o d u c t i o n 1
1.1 Face-to-Face interaction . . . 1
1.2 Social cues . . . 1
1.3 Social interaction analysis . . . 2
1.4 Towards «in vivo» automatic social interaction analysis . . . 2
1.5 Social interaction analysis automization: the challenges . . . 4
1.6 Contributions . . . 5
1.7 Thesis organization . . . 5
2 b a c k g r o u n d: observational studies, social cues, and ma-c h i n e l e a r n i n g 7 2.1 Observational study . . . 7 2.2 OVALIE platform . . . 7 2.3 Social cues . . . 8 2.3.1 Facial expressions . . . 9 2.3.2 Body posture . . . 9 2.3.3 Gestures . . . 10 2.3.4 Eye contact . . . 11
2.3.5 Pitch and tone of voice . . . 11
2.4 Machine learning . . . 12
2.4.1 Machine learning styles . . . 12
2.4.2 Clustering . . . 13
2.4.3 Classification . . . 13
2.4.3.1 Decision trees and forests . . . 13
2.4.3.2 Artificial Neural Networks (ANN)s . . . 15
2.4.4 Deep learning . . . 15
2.4.5 Transfer learning . . . 16
2.4.5.1 Transfer learning strategies . . . 17
2.4.5.2 Deep transfer learning strategies . . . 18
2.4.6 Image augmentation for deep learning . . . 19
2.4.7 Model evaluation and metrics . . . 19
2.4.7.1 Model evaluation . . . 19
2.4.7.2 Metrics . . . 21
2.5 Prader–Willi syndrome (PWS) . . . 22
2.6 Conclusion . . . 24
3 r e l at e d w o r k: experimental platforms, social interac-t i o n d e interac-t e c interac-t i o n a n d a na ly s i s, and food classification 25 3.1 Experimental platforms for eating behavior observation . . . 25
3.2 Social interaction detection and analysis . . . 26
3.2.1 Verbal cues detection . . . 26
3.2.2 Vocal nonverbal cues detection . . . 27
s u m m a r y xi
3.2.2.1 Speaker diarization . . . 27
3.2.2.2 Speech emotion recognition (SER) . . . 27
3.2.3 Visual nonverbal cues detection . . . 28
3.2.3.1 Facial expression recognition (FER) . . . 28
3.2.3.2 Gaze and eye tracking . . . 28
3.2.3.3 Eye contact detection . . . 30
3.2.4 Analysis methods based on visual nonverbal cues (VNAM) 30 3.3 Food recognition and classification . . . 31
3.3.1 Food datasets . . . 32
3.3.2 Deep learning and food recognition . . . 32
3.3.3 Food recognition and classification applications . . . 33
3.4 Conclusion . . . 34
4 c o n t e x t-aware feature extraction methods 35 4.1 Eye contact detection in Face-to-Face interactions . . . 35
4.1.1 Geometrical eye contact detection . . . 36
4.1.1.1 Cameras setup . . . 36
4.1.1.2 Person detection and tracking . . . 37
4.1.1.3 LookAt() . . . 38
4.1.1.4 Time variant LookAt squared matrix . . . 40
4.1.1.5 Eye contact detection . . . 40
4.1.1.6 Experimental setup . . . 40
4.1.1.7 Experimental results . . . 41
4.2 Deep model for French food classification . . . 43
4.2.1 Dataset collection . . . 44
4.2.2 Methodology . . . 44
4.2.2.1 Residual Neural Network (ResNet) . . . 45
4.2.2.2 Densely Connected Convolutional Networks (DenseNet) . . . 46
4.2.2.3 Inception-V3 . . . 46
4.2.3 Experimental results . . . 46
4.3 Conclusion . . . 53
5 t o wa r d s a h o l i s t i c a p p r oa c h (framework) for social in-t e r a c in-t i o n a na ly s i s 54 5.1 Raw data acquisition module . . . 55
5.2 Context-aware feature extraction module . . . 55
5.3 (Meta)data management . . . 56
5.3.1 Experiment group . . . 56
5.3.2 Acquisition group . . . 58
5.3.3 Video group . . . 58
5.3.4 Features group . . . 58
5.4 Social behavior analysis module (Multi-layer aggregation) . . . 59
5.5 Visualization tools . . . 60
5.6 Conclusion . . . 61
s u m m a r y xii
6.1 OVALIE platform floor plan . . . 63
6.2 Raw data acquisition module . . . 66
6.2.1 Axis cameras . . . 66
6.2.1.1 Axis F Series . . . 67
6.2.1.2 AXIS P33 Series . . . 68
6.2.2 Microphones . . . 68
6.2.3 AXIS Camera Station software . . . 69
6.3 Multi-person social interactions analysis . . . 70
6.3.1 Qualitative analysis based on the eye gaze and the sum eye gaze over time . . . 70
6.3.2 Social media aggregation for better interpretation . . . 71
6.3.3 (Meta)data aggregation and statistics visualization using Kibana . . . 71
6.4 Study of eating behavior of the children with Prader–Willi syn-drome (work in progress) . . . 74
6.5 Conclusion . . . 75
7 c o n c l u s i o n 76
L I S T O F F I G U R E S
Figure 1.1 Taxonomy of social cues [7]. . . 2
Figure 1.2 A group of nonverbal behavioral cues is recognized as a social signal [136]. . . 3
Figure 2.1 A smile gives an indication that the person is pleased or amused [126]. . . 8
Figure 2.2 Samples of basic six emotions displayed by facial expres-sion from MMI dataset[133]. . . 9
Figure 2.3 Two examples of body postures. On the left is a slumped posture, on the right is a erect posture . . . 10
Figure 2.4 On the left "OK" and "cross figures" gestures, on the right examples of hand-over-face gestures taken from [80]. . . . 10
Figure 2.5 Eye contact clipart. . . 11
Figure 2.6 Three common learning styles adopted in machine learning field. . . 12
Figure 2.7 The random forest algorithm relies on multiple decision trees that are all trained slightly differently; all of them are taken into consideration for the final classification. . . 14
Figure 2.8 A CNN sequence to classify handwritten digits [2]. . . 16
Figure 2.9 On the left learning process of traditional machine learn-ing; On the right learning process of transfer learning. . . . 17
Figure 2.10 Transfer Learning with Pre-trained Deep Learning Models as Feature Extractors. . . 18
Figure 2.11 In fine-tuning process, all convolutional layers (blue layers) in the network are fixed and gradient is backpropagated through the fully connected (FC) layer only. . . 19
Figure 2.12 10-fold cross validation. The designated training set is further divided up into K folds (K=10), each of these will now function as a hold-out test set in K iterations. Finally, the scores obtained from the model on individual iterations are summed and averaged into the final score. . . 20
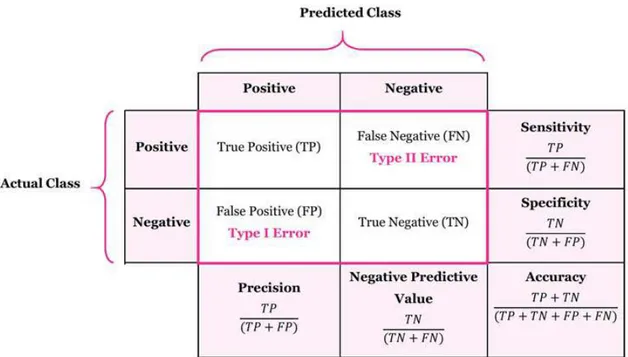
Figure 2.13 An illustrative depiction of the (binary) confusion matrix and a selection of the measures that may be derived directly from it. . . 21
Figure 2.14 Eight-year-old with PWS: Note presence of morbid obesity [29]. . . 23
Figure 3.1 The general pipeline of speech recognition engines. . . 26
Figure 3.2 The general pipeline of speech emotion recognition. . . 27
Figure 3.3 The general pipeline of deep facial expression recognition systems [75]. . . 29
l i s t o f f i g u r e s xiv
Figure 3.4 This Figure shows one example for 100 out of the 101
classes Food-101 dataset. [19]. . . 32
Figure 3.5 The multitask CNN used a VGG16 architecture for feature mining and the learned features were fed into four parallel subnetworks to predict the calorie and other attribute of food [41]. . . 33
Figure 4.1 Camera setup used for the dataset recording. . . 36
Figure 4.2 Calibration checkerboard contains 8 × 6 internal corners, 9× 7 squares, square size = 4cm. . . 37
Figure 4.3 LookAt() evaluation between two persons. C1, C2 are first and second cameras; P1, P2 are first and second persons; F1is the reference frame of C1, F2 is the reference frame of C2;1F3is P1 head pose w.r.t. F1,2F4is P2 head pose w.r.t. F2;iTj is the pose of Fj w.r.t. Fi;3V1is the gaze direction of P1 w.r.t.1F3,4V2is the gaze direction of P2 w.r.t. 2F4. . 38
Figure 4.4 Look At square matrix example. Pi is the ith person; on the table, the value of (x, y) is 1 if Px is looking at Py else it is 0. 40 Figure 4.5 Examples of “crepe” that shows intra-class diversity. . . 43
Figure 4.6 Typical examples of our French food dataset. . . 45
Figure 4.7 Residual learning: a building block [59]. . . 46
Figure 4.8 A deep DenseNet with three dense blocks. The layers be-tween two adjacent blocks are referred to as transition layers and change feature-map sizes via convolution and pooling [62]. . . 46
Figure 4.9 Inception-v3 Architecture [130]. . . 47
Figure 4.10 Training and validation accuracy of the fine-tuned models. 47 Figure 4.11 Some examples of wrong prediction. First column show the target class, the second one show correct prediction, and the rest shows wrong prediction. . . 48
Figure 4.12 Confusion matrix of the fine-tuned models. . . 50
Figure 4.12 Confusion matrix of the fine-tuned models (cont.). . . 51
Figure 5.1 Social interaction analysis framework architecture. . . 54
Figure 5.2 Social media (meta)data model. . . 56
Figure 5.3 Generic (meta)data model.This generic data model for visual nonverbal social cues shows the relationships that exist between experiment, acquisition, video, and feature groups of entities, which are color-coded as green, orange, yellow, and gray respectively. . . 57
Figure 5.4 Social cues representation as multi layer. . . 59
Figure 5.5 Emotion layer scaling up example. . . 59
Figure 5.6 Face-to-Face visualization tool. . . 60
Figure 5.7 (Meta)data visualization pipeline using kibana. . . 61
Figure 5.8 Statistics visualization using Kibana. . . 61
l i s t o f f i g u r e s xv
Figure 6.2 Calibration and secure areas floor plan. . . 64
Figure 6.3 Sample from one ceiling camera fixed inside the kitchen. . 64
Figure 6.4 Restaurant area floor plan. . . 65
Figure 6.5 Hospital room setup in the adjustable area. . . 65
Figure 6.6 A sample from the multiple views for the focus group observation area in OVALIE. . . 66
Figure 6.7 b . . . 67
Figure 6.8 AXIS P3367 network camera. . . 68
Figure 6.9 U843R three directional boundary microphone. . . 69
Figure 6.10 AXIS Camera Station multiple views example. . . 69
Figure 6.11 Participants’ gaze direction summation during the ana-lyzed segment. Pi is a person with index i. . . 70
Figure 6.12 Example of the collected contextual information from social networks. . . 71
Figure 6.13 Face-to-Face social interaction analysis dashboard . . . 72
Figure 6.14 Face-to-face social interaction experiment sample received gaze pie chart. . . 73
Figure 6.15 Face-to-face social interaction experiment sample gaze di-rection heat-map. . . 73
Figure 6.16 Face-to-face social interaction experiment sample speaking cues pie chart. . . 74
L I S T O F TA B L E S
Table 3.1 Visual nonverbal signals associated to the most common social behaviors. . . 31
Table 4.1 LookAt performance results of our proposed method (Ge-ometrical approach) compared with multiple supervised approaches: Random Forest (RF), Random Tree (RT), J48, Naïve Bayes, and Neural Network (NN), in terms of Ac-curacy, Precision, Recall, and F-Measure for NotLooking class (0) and Looking class (1). Results averaged over 10 videos when performing 10-fold validation on each video. 41
Table 4.2 10-fold cross validation (video level) Looking_At perfor-mance results of our proposed method (Geometrical ap-proach) compared with multiple supervised approaches: Random Forest (RF), Random Tree (RT), J48, Naïve Bayes, and Neural Network (NN), in terms of Accuracy, Preci-sion, Recall, and F-Measure for NotLooking class (0) and Looking class (1). . . 42
Table 4.3 List of the 37 classes in our French food dataset. . . 44
Table 4.4 Top–1 and Top–5 performance test on our French food dataset achieved by fine-tuned DCNN models. Best results are highlighted in boldface font . . . 48
A C R O N Y M S
GDPR General Data Protection Regulation
IoT Internet of Things
ML Machine Learning PWS Prader–Willi syndrome
IP Internet Protocol
WDR Wide Dynamic Range HDTV High-definition television
RF Random Forest
SVM Support Vector Machine
TP True Positives FP False Positives
TN True Negatives
FN False Negatives TPR True Positive Rate
FPR False Positive Rate
ANN Artificial Neural Network RNN Recurrent Neural Network
CNN Convolutional Neural Network
DCNN Deep Convolutional Neural Network
ResNet Residual Neural Network
DenseNet Densely Connected Convolutional Network
CCTV Closed-Circuit TeleVision
VNAM Analysis Method based on Visual Nonverbal cues FER Facial expression Recognition
a c r o n y m s xviii
GPS Global Positioning System
IMU Inertial Measurement Unit SER Speech Emotion Recognition
LPCs Linear Prediction Coefficients
MFCCs Mel-Frequency Cepstrum Coefficients NAS Network-attached storage
1
I N T R O D U C T I O N
Man is by nature a social animal; an individual who is unsocial naturally and not accidentally is either beneath our notice or more than human.
— Aristotle, Politics ca. 328 BC
1.1
Face-to-Face interaction
In sociology, face-to-face interaction is a concept describing social interaction carried out without any mediating technology [32]. Georg Simmel, one of the
earliest social science scholars to analyze this type of interaction, observed that sensory organs play an essential role in interaction, discussing examples of human behavior such as eye contact [121].
Social interaction is a dynamic relationship of social cues/signals exchange between two or more individuals within a group. It has a vital role to play in the evolution of learners, which is not a straightforward generalization of complex environments[123]. Authors of [95] found a statistical correlation between the
amount of social interaction and individual mental health. Thus, the study of social interaction provides a better understanding of human behavior in different contexts and scenarios.
Social interaction analysis can be useful in many domains like industry (e.g., restaurants) in which stakeholders can get feedback illustrating the satisfaction level of the clients regarding the provided service; medical services by which health issues such as eating disorders can be detected in a person’s eating behavior; Internet of Things (IoT) applications where we can provide a fast and reliable way to measure user’s experience with new devices testing; and observational studies in which individual’s behaviors are systematically observed and recorded in order to describe the relationship the observed behaviors with a variable or set of variables.
1.2
Social cues
Social cues can be categorized into verbal (word) and nonverbal (wordless/visual) information [7], as shown in Figure 1.1. The verbal behavioral cues take into
account the spoken information among persons, such as ‘yes/no’ responses in answering question context. Nonverbal behavioral cues represent a set of temporal changes in neuromuscular and physiological activities, which send a message about emotions, mental state, and other characteristics [135]. Nonverbal
1.3 social interaction analysis 2 Social Cues Verbal Cues Speech Non-Verbal Cues Vocal Visual Physical Appearance Space and Environment Gesture and Posture Face and Eyes
Facial Expression
Silences Voice Quality Turn Taking Patterns Focus of Attention Posture Gaze Behavior Hand-Over-Face Gesture Hand
Gesture Age Gender Attractiveness
Seating/Standing Arrangement Distance
Figure 1.1: Taxonomy of social cues [7].
cues are accessible to our senses by sight and hearing, as shown in Figure1.2. This
fact means they are detectable through microphones, cameras, or other suitable sensors (e.g., accelerometer). Nonverbal cues can be taxonomized into vocal and visual cues, where: (i) vocal cues include voice quality, silences, turn-taking patterns, nonlinguistic vocalizations, and linguistic vocalizations; and (ii) visual cues include physical appearance (e.g., gender, height, ethnicity, age), face and eyes cues (e.g., facial expression, gaze direction, focus of attention), gesture and posture, and space and environment [136].
1.3
Social interaction analysis
In the context of testing and observational studies, several mechanisms are used to analyze social interactions from various perspectives. For example, if a teaching institute want to evaluate a new teaching technique (focus group, team working, etc.) in a class, one of the following method may be used: (i) directly observing students’ behavior and recording notes during the class; (ii) asking students to fill pre-defined form (questionnaire), then analyze it; or (iii) recording the lecture and perform video analysis by human operators (observer). However, such mechanisms are expensive in terms of processing time, requiring a high level of concentration and attention to analyze several cues in parallel and dependent on the observer’ personal beliefs or feelings (subjectivity of the analysis).
1.4
Towards «in vivo» automatic social interaction
analysis
To face the observers’ subjectivity and their limited ability to track multiple cues in the observational studies, the need for automatization of the analysis procedure
1.4 towards «in vivo» automatic social interaction analysis 3
Figure 1.2: A group of nonverbal behavioral cues is recognized as a social signal [136].
is highlighted. So it is a question of bridging the gap between the human-based and machine-based social interaction analysis processes. Such an approach will eliminate the observers’ subjectivity and will allow the analysis of multi "signals" in parallel (where humans are able only to focus on one). This analysis can be further enriched by data related to the context of the scene (location, date, type of music, event description, etc.), individuals personal data (name, age, gender, education levels), or data extracted from individuals’ social networks ( subscribers, friends, groups, shared contents, etc.).
Various studies have been performed to detect, analyze, and assess social interac-tions using automatic machine-learning methods, including automatic extraction of nonverbal social signals corresponding to multimodal (e.g., eye contact, touch-ing, etc.) social cues [7]. These studies have been applied in a tremendous range
of applications and domains, including role recognition [40], social interaction
detection in a smart meeting [102], and work environments [69], detecting
decep-tive behavior [4], detecting dominant people in conversations [63], and studying
parent-infant interaction [12].
Social signals that have been investigated during social interactions are prim-itive and context-independent because they are not semantic and often occur unconsciously. These signals include frequency and duration of social behav-ioral cues occurrences, such as the number of eye contact actions that happened between two persons. Different from the previous studies, our proposal take the“context” into account as an independent variable. We focus on visual social cues (highlighted in green color in Figure1.1) and precisely the following:
• Facial expression since it is one of the most effective, natural, and universal signals for human beings to convey their emotional states [35].
• Eye and gaze behavior, as it is an important social cue for performing a wide range of analysis and studies such as a dominant person detection [51]. It
1.5 social interaction analysis automization: the challenges 4
seeking, establishment and recognition of social relationships, and signaling that the “channel is open for communication” [10].
1.5
Social interaction analysis automization: the
chal-lenges
To face the observer’s subjectivity and limited observation ability, we need to automate social interaction analysis process. This automation introduce three main challenges that must be considered in the proposed approach:
• the gap that appears from the transforming human-based social interaction analysis observation tasks into machine-based computational tasks;
• keeping the observation naturalistic, which means anything can affect the data subject’s behavior is not allowed, like using intrusive device (head-mounted camera), having a camera in front of data subject, attaching micro-phone to the data subject;
• the different time scales that social cues can be changed within. For example, hand-over-face gesture can change one time every twenty seconds, but the gaze direction can be changed up to one hundred times per second.
In addition to the three main challenges, there are multiple technical challenges related to multiple technical challenges related to:
• Data heterogeneity, multiple social cues in face-to-face interaction need to be tracked. These cues are related to head, hands, face, body, and voice, which means each cue has a different representation, and this causes heterogeneity in data. For example, facial expression can be represented as discrete values, whereas the gaze direction is represented as a vector.
• Data volume, the minimum time scale that can be used in the analysis of observational studies records is the frame-level. Thus, the amount of the extracted data (social cues) proportionally increases with respect to the frame rate and video length and number of tracked cues. For example, performing analysis on the SALSA [9] dataset needs to extract social signals
from 216,000 (60 × 60 × 15 × 4) frames belonging to four videos with a length of one hour and frame rate equals to fifteen frames per second, related to only one experiment. Therefore, with this example, analyzing hours of experiments will produce a massive data.
• Personal data privacy and security, with the progress in the computer vision field is raising concerns about individuals’ privacy since visual information can be misused to profile/track them against their will. From another perspective, the General Data Protection Regulation (GDPR), which is a regulation in EU law on data protection and privacy for all individuals within the European Union [137], has to be considered.
1.6 contributions 5
1.6
Contributions
The main contribution of this thesis consist of the automation of social interactions analysis in the context of observational studies. In particular, we propose a generic architecture for a holistic approach for social interactions analysis. The proposed approach integrates different components: (i) data acquisition methods (cameras, microphones, etc.); (ii) context-aware feature extraction methods; (iii) (meta)data model; and (iv) social behavior analysis methods.
In (meta)data model component, we propose a comprehensive (meta)data model within which is the heart of the proposed approach due to many reasons: (1) it decouples feature extraction methods from the analysis methods; (2) it facilitates heterogeneous data fusion from different modalities; and (3) it encapsulates the recorded video, so we will (if it is needed) share (meta)data and analysis results only instead of sharing the recorded videos.
In the data acquisition methods, we propose a novel geometric-based method to detect eye contact in natural multi-person interactions without the need for eye tracking devices or any intrusive in order to do naturalistic observation studies. Furthermore, we propose a find-tuned deep model for food classification that will be used to extract contextual information from the video content.
In the social behavior analysis methods, we analyze the heterogeneous social cues coming from different modalities as multi-layer sources (visual cues, voice cues, contextual information (complementary "exogenous" data)) at different time scales and different combinations between layers. In our context, the layer is the representation of the cue as time series. So, we represent the cues as time series with a common time scale (sampling time such as millisecond, second, minute, etc.). This enables the aggregation between the heterogeneous social cues and contextual information dynamically at different time scales, and optionally according to their availability or not.
Finally, we have deployed the proposed holistic approach on the OVALIE 1
platform which is located in University Toulouse II-Jean Jaurès (UT2J - France) and it aims to study eating behaviors in different contexts .
1.7
Thesis organization
The rest of the thesis is structured into 5 chapters.
Chapter2gives an introduction to basic concepts related to social cues, machine learning, transfer learning, and Prader–Willi syndrome (PWS).
Chapter3 reviews related work of common social interaction detection methods with a focus on the visual nonverbal cues based approach. Beside that, we reviews the existed methods of food classification based on the deep learning,
1.7 thesis organization 6
since the food is commonly exist in several contexts (restaurant, hospital, etc.) and it consumption has an effect on the social interaction.
Chapter4Presents a novel geometrical method to detect eye contact in natural multi-person interactions without the need of any intrusive eye tracking device. We have experimented our method on 10 social videos, each 20 minutes long. Experiments demonstrate highly competitive efficiency with regards to classification performance, compared to the classical existing supervised eye contact detection methods. Also, this chapter evaluates the effectiveness of deep convolutional neural network (DCNN) in classifying French food images task.
Chapter5presents our holistic approach for social interaction analysis architec-ture that combines various methods together using a comprehensive (meta)data model that able to store heterogeneous (meta)data.
Chapter 6 presents OVALIE platform floor plan, hardware, software. After presenting the platform, we introduce the dataset that collected to perform our experiments. Finally, we introduce a PWS observation study which will be performed in OVALIE platform.
2
B A C K G R O U N D : O B S E R VAT I O N A L S T U D I E S , S O C I A L C U E S , A N D M A C H I N E L E A R N I N G
A good stance and posture reflect a proper state of mind. — Morihei Ueshiba
In this chapter, we introduce the basic concepts and definitions that we are going to use in the thesis. First, we introduce the observational study in social sciences, then we present «in vivo» experimental platform for eating behavior analysis (OVALIE), which is in the context of observational studies. Second, we introduce the main social signals that we are interested in within this thesis. After that, we provide a general overview of machine learning and transfer learning since we developed machine learning-based methods in this thesis to detect social cues. Finally, we present Prader–Willi syndrome (PWS) because we are going to study the eating behavior of children born with it (work in progress).
2.1
Observational study
In social sciences, observational study is a non-experimental social research method in which a researcher records and observes ongoing behavior in a natural setting. It aims to draw inferences from a sample to a population where the independent variables are not under the control of the researcher. The collected data in observational research studies are often qualitative. Based on the involve-ment of the observer, we can classify the observational methods into participant observation and non-participant observation.
Observational studies have many advantages: it is one of the main bases of formulating hypotheses; it has higher accuracy compared with other methods like interviews, questionnaires, etc. However, it is a time-consuming process, and it could affected by the observer subjectivity (Personal Bias of the Observer).
2.2
OVALIE platform
In the context of observational studies, OVALIE [3] is an experimental platform
in human and social sciences, is located in University Toulouse-Jean Jaurès (UT2J - France) , aims to observe, analyse and study the influence of physical and social context on eating behaviors. In addition to the use of behavioral research equipment and software that can perform a wide variety of tasks, including facial expression analysis, audio analysis, spatial behavior tracking, and eye tracking.
2.3 social cues 8
This platform will take the “context” into account as an independent variable, differing from previous studies which neutralized the context. Additionally, through a partnership with Taylor’s University (TU - Malaysia), an identical platform will be established, facilitating cross-cultural studies in eating behaviors.
2.3
Social cues
Social cues are critically an essential aspect of communication. In the following, we identify social cues and explore some examples of how they influence social interaction and engagement. More technical details related to the automatic detection of thesis social cues will be presented in Section3.2. Imagine that you
are talking to a friend at a party and suddenly he turns and walks away. Would you follow him and keep talking or would you simply go talk to someone else? Likely you would go find someone else because you recognize that walking away from you in the middle of a conversation is an indication that your friend is not interested in what you were talking about. You understood the fact that your friend was not interested in your talk because he gave you a social cue.
Figure 2.1: A smile gives an indication that the person is pleased or amused [126].
A typical example of a social cue is a smile (see Figure 2.1). Although smiles
are not always genuine, people generally smile (consciously and unconsciously) when they are happy or amused. For instance, if you are in a group and tell a joke that makes people smile, then you can assume that the joke go well because people have provided a social cue (smile). Conversely, if your joke does not elicit a smile, then you can assume that the joke did not went well since people did not provide a smile (lack of smile is a social cue indicating that the group did not think what you said was funny). In both cases, social cues give you an indication of what to do next. The smile indicates that they like your humor and a lack of smile suggests that you should try a different style.
Having a well-developed understanding of social cues and the strong ability to interpret them can greatly increase your skills as a communicator because you will be able to read a person’s behavior and appropriately respond. On the other
2.3 social cues 9
hand, under-developed awareness of social cues makes it challenging to create relationships with others and interact in social situations.
Social cues are symbols expressed through facial expressions, body posture, gestures, eye movement, pitch and tone of voice, or words that are intended to send a message from one person to another.
2.3.1
Facial expressions
Facial expressions are social signals that we make by moving our facial muscles. Facial expressions generally signify an emotional state. Authors of [43] defined
six basic emotions based on cross-culture study, each emotional state of mind has a specific facial expression[42]. These facial expressions are anger, disgust, fear,
happiness, sadness, and surprise as shown in Figure2.2.
Anger Disgust Fear
Joy Sadness Surprise
Figure 2.2: Samples of basic six emotions displayed by facial expression from MMI dataset[133].
2.3.2
Body posture
Body posture is the position in which someone holds their body while standing, sitting, or lying down. Posture can reveal significant information, such as a person’s current state of mind, emotions, and attitudes [30]. Figure 2.3shows
2.3 social cues 10
slumped and erect postures. Slumped posture is an example of a depressed attitude, whereas erect posture is an example of a more energized attitude.
Figure 2.3: Two examples of body postures. On the left is a slumped posture, on the right is a erect posture
2.3.3
Gestures
People often use gestures during their communication. Gestures are hands, face, or another part of the body movement to send a message in place of the speech or in parallel with it [68].
Figure 2.4: On the left "OK" and "cross figures" gestures, on the right examples of hand-over-face gestures taken from [80].
2.3 social cues 11
They may be conscious like the sign language or unconscious like the hand-over-face gestures; Figure2.4 shows some examples of gestures. Gestures are
culture-specific and may carry different meanings in different cultures. For example, the "OK" gesture in the USA signifies OKay; in Japan, it symbolizes money; in Brazile, is a rude gesture.
2.3.4
Eye contact
Eye contact detection is defined as a task of detecting whether two people look at each other’s eyes or face simultaneously as shown in Figure 2.5. It is
Figure 2.5: Eye contact clipart.
an important feature for better understanding human social behavior. It has numerous applications. For example, it is a key component in attentive user interfaces and it is used to analyze turn-taking, social roles, and engagement during multi-person interactions. Even more, we can deduce many things based on the eye contact [10]: (i) the topic nature, in which, there is more eye contact in
case of the topic being discussed is straightforward and less personal, whereas, there is less eye contact during the hesitating passages; (ii) the relation between two persons, in which, there is more eye contact if the two persons are positively interested in each other.
2.3.5
Pitch and tone of voice
When communicating with others, the pitch and tone of your voice (intonation) can be a good indicator of how do you feel at that moment. For example, if someone was speaking very quickly in a shaky tone. His rapid speech is a sign of anxiety and urgency, which means you should assume something is wrong and requires an immediate attention.
2.4 machine learning 12
2.4
Machine learning
In this section, we will briefly introduce the machine learning field. Based on it, we will be able to detect the introduced social cues in Section2.3.
Machine learning is a field in computer science that shows the abilities of ma-chines in learning to solve problems from given experimental data instead of explicitly programmed. The behavior of most machine learning algorithms is con-trolled by a set of parameters that define a model. The main purpose of machine learning is to estimate the parameters of the model to learn regular patterns from data observations, with avoiding learning the training samples “by heart”. In practice, given a dataset of training examples, an algorithm is expected to learn a model to solve a specific task. Learning from Examples is one of the most commonly adopted learning strategies as well as it provides the most flexibility with enabling computer programs to completely develop unknown skills or find unknown structures and patterns in a given data [21]. Learning from examples is
a technique that is often leveraged in classification tasks to predict the class label of new, properly unseen, data entries based on a dynamic set of known examples.
2.4.1
Machine learning styles
There are so many machine algorithms available that follow the learning from ex-amples strategy. However, these algorithms can be categorized based on learning style (supervised, unsupervised, and semi-supervised) [67] as shown in Figure 2.6. Supervised Learning includes every task in which the algorithm has access
Figure 2.6: Three common learning styles adopted in machine learning field [17].
to input and output values. Herein, input values can be defined as the external information that the algorithm can use, such as attribute values, while output val-ues, are the specific target labels of the class attribute. It means that the structure of the data is known and the purpose of these programs is to predict the correct class for a given new data. Unsupervised Learning is used for the tasks that have no access to output values and thus try to find structures within the data through
2.4 machine learning 13
creating classes on their own. Semi-Supervised Learning is adopted for solving tasks that have a mixture input data between labeled and unlabeled examples. Indeed, those tasks can be viewed as a prediction problem, but the model has to learn the structures to organize the data.
2.4.2
Clustering
Clustering is one of the common data analysis techniques used to get knowledge about the structure of the data. It is the task of identifying subgroups (clusters) in the data such that data points in the same cluster are very similar based on similarity measures such as euclidean-based distance or correlation-based distance. Clustering is an unsupervised learning method since it does not need the ground truth. K-means is one of the most common used clustering algorithms due to its simplicity. We used the K-means algorithm in person tracking in our proposed geometrical eye contact detection algorithm in Section4.1.1.
K-means algorithm is an iterative algorithm aims to partition the data into K clusters where each data point belongs to only one cluster. It works as following:
1. determine number of clusters K,
2. initialize centroids by shuffling the input data and then randomly selecting K data points for the centroids,
3. keep iterating until there is no change to the centroids:
• compute the sum of the squared distance between data points and all centroids,
• assign each data point to the closest cluster (centroid),
• compute the centroids for the clusters by taking the average of the all data points that belong to each cluster.
2.4.3
Classification
Various supervised learning algorithms have been designed and well-implemented to build data-driven models using a given training set at hand. In this work, we focus on commonly classification learning methods, including decision tree, random forests, artificial neural networks, and conventional neural networks and we used these algorithms to make comparison with our proposed geometrical eye contact detection algorithm in Section4.1.1.
2.4.3.1 Decision trees and forests
Decision tree-based learning algorithms are one of the most common methods used for non-linear classification problems. Their popularity increased because
2.4 machine learning 14
Instance
Tree-1
Tree-2 Tree-n
Class-X Class-Y Class-Y
Majority Voting
Final Class
Figure 2.7: The random forest algorithm relies on multiple decision trees that are all trained slightly differently; all of them are taken into consideration for the final classification.
of their intuitive representation in the decision-making process. Decision trees are composed of a set of internal nodes where each one is labeled with an input feature. The output of each node represents a test resulting of the branch based on a certain threshold value. Both the actual branch feature and the threshold value are computed using an optimization procedure. Individual branches represent the outcome and lead to child nodes with subsequent tests, a target class label in the case of a leaf node. While single trees are useful for demonstration purposes, an ensemble of trees (i.e., tree forests) is widely used for classification problems than relying on single decision trees. Forests of trees [23] have many benefits over
only adopting single trees where lower error margin and better generalization are the most important aspects. Random Forest (RF) is an ensemble of unpruned trees that can be used for both classification and regression problems. The key point of random forest is to build as a set of decision trees as shown in Figure2.7. This
method involves random feature selection for building individual and different trees. The final classification result is computed using an aggregating (voting) scheme in case of classification and averaging for regression problems over the members. RF has shown a massively improved performance compared to the traditional single decision trees [23,20] such as C4.5 and J48. The generalization
2.4 machine learning 15
of forests decreases as the number of trees increases, because of the randomness in the sampling process adopted for building the individual trees.
2.4.3.2 Artificial Neural Networks (ANN)s
ANNs are computing systems designed to mimic the human brain information processing mechanism. Such systems "learn" to execute tasks by considering examples without being programmed with any task rules and they have self-learning capabilities that make them produce better results when more data become available. For example, if someone wants to identify images that contain salad dishes, he can use example images that have labeled as "salad" or "no salad" to train an ANN and use the trained network to identify salad in other new images. ANNs perform the tasks without any prior knowledge about salad dishes. Instead, they automatically generate identifying characteristics from the learning material (e.g., labeled salad images).
An ANN consists of a collection of connected nodes called artificial neurons, which model the neurons in a human brain. Each connection can transmit a signal from one artificial neuron to another. The artificial neuron (signal receiver) can process it and then transmit to the connected artificial neurons.
In common ANN implementations, the signal at a connection between artificial neurons is a real number, and the output of each artificial neuron is computed by some non-linear function of the sum of its inputs. The connections between artificial neurons are called ’edges’. Artificial neurons and edges typically have a weight that adjusts as learning proceeds. The weight increases or decreases the strength of the signal at a connection. Artificial neurons may have a threshold such that the signal is only sent if the aggregate signal crosses that threshold. Typically, artificial neurons are aggregated into layers. Different layers may perform different kinds of transformations on their inputs. Signals travel from the first layer (the input layer) to the last layer (the output layer), possibly after crossing multiple layers.
2.4.4
Deep learning
In this Section, we introduce deep learning since we used the deep model in the food classification in Section4.2. Deep learning is a subset of machine learning
methods based on artificial neural networks[115]; it uses multiple layers to extract
higher-level features from the raw input [38]. Deep learning architectures such as
convolutional neural networks (CNN)s and recurrent neural networks (RNN)s have been applied to fields including natural language processing, computer vision, speech recognition, and audio recognition, where they have produced results comparable to human experts [71, 26].
In deep learning, each layer learns to transform its input data into a more abstract representation. For example, in face recognition application, the raw input is a matrix of pixels; the first representational layer will abstract the pixels and
2.4 machine learning 16
Figure 2.8: A CNN sequence to classify handwritten digits [2].
encode edges; the second layer may encode arrangements of edges; the third layer may encode a nose and eyes; and the fourth layer may recognize that the image contains a face [38].
The name of CNN drove from the employment of a mathematical operation called convolution in the network. In other words, CNN is a neural network that uses convolution operation instead of classical matrix multiplication within at least one layer [53]. A CNN consists of an input and an output layer, as well as
multiple hidden layers. The hidden layers of a CNN typically consist of a series of convolutional layers that convolve with multiplication or other dot product. The activation function is commonly a RELU layer and is subsequently followed by additional convolutions such as pooling layers, fully connected layers, and normalization layers referred to as hidden layers because their inputs and outputs are masked by the activation function and final convolution as shown in Figure
2.8.
2.4.5
Transfer learning
Many machine learning methods work well under a common assumption: the training and test data are drawn from the same feature space and the same distribution. When the distribution changes, most statistical models need to be rebuilt from scratch using newly collected training data [96]. In many real world
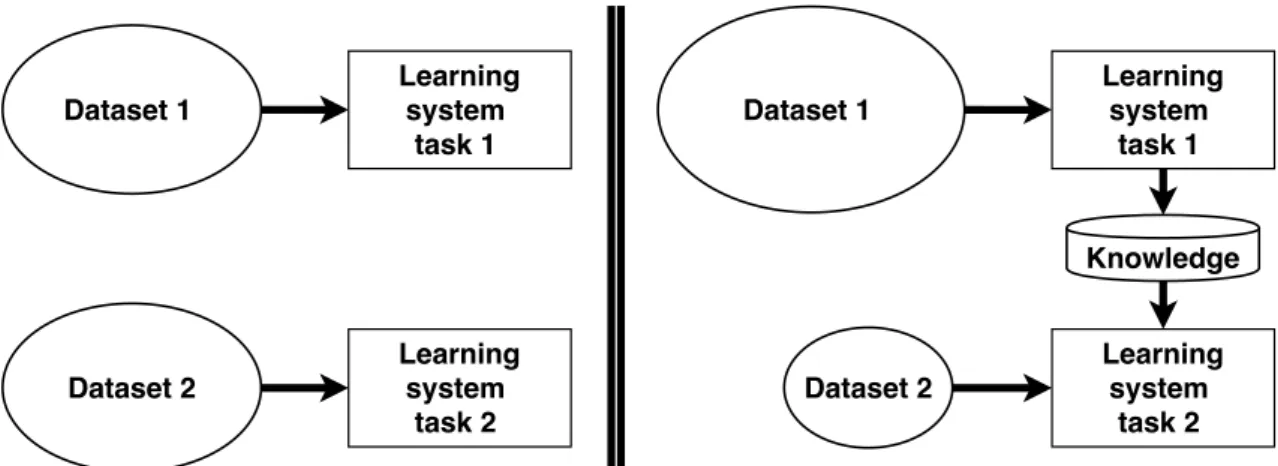
applications, it is expensive or impossible to re-collect the needed training data and rebuild the models. It would be nice to reduce the need and effort to re-collect the training data. In such cases, knowledge transfer or transfer learning between task domains would be desirable.
2.4 machine learning 17 Dataset 2 Dataset 1 Learning system task 1 Learning system task 2 Dataset 2 Dataset 1 Learning system task 1 Learning system task 2 Knowledge
Figure 2.9: On the left learning process of traditional machine learning; On the right learning process of transfer learning.
Transfer learning is a machine learning method where a model developed for a task is reused as the starting point for a model on a second task as shown in Figure2.9. It is a popular approach in deep learning where pre-trained models are
used as the starting point on computer vision and natural language processing tasks given the vast compute and time resources required to develop neural network models on these problems and from the huge jumps in skill that they provide on related problems [53].
As shown in Figure2.9, traditional learning is isolated and occurs purely based
on specific tasks, datasets and training separate isolated models on them. No knowledge is retained which can be transferred from one model to another. In transfer learning, you can leverage knowledge (features, weights etc) from previously trained models for training newer models and even tackle problems like having less data for the newer task.
2.4.5.1 Transfer learning strategies
In transfer learning, we need to determine which part of knowledge can be transferred across domains or tasks. After discovering which knowledge can be transferred, we need to develop learning algorithms to transfer the knowledge. Based on different situations between the source and target tasks and domains we can categorize the transfer learning into inductive transfer learning, transductive transfer learning and unsupervised transfer learning.
In the inductive transfer learning setting, the target task is different from the source task but they are related, no matter if the source and target domains are the same or not. In the transductive transfer learning setting, the source and target tasks are the same, while the source and target domains are different. Finally, for the unsupervised transfer learning setting the target task is different from the source task but they are related, similar to inductive transfer learning setting. However, the unsupervised transfer learning focus on solving unsupervised learning tasks in
2.4 machine learning 18
the target domain, such as clustering [34], dimensionality reduction and density
estimation [140].
2.4.5.2 Deep transfer learning strategies
Deep learning has made remarkable progress in recent years. This progress has enabled researcher to undertake complicated problems and yields amazing results. However, the required amount of data and the training time for such deep learning systems are much more than comparing with the traditional ML systems. There are various deep learning networks with the state-of-the-art performance that have been developed and tested across fields such as computer vision and natural language processing. In most cases, people share the details of these networks for others to use. These pre-trained models form the basis of inductive transfer learning in the context of deep learning (deep transfer learning). The two most commonly used deep transfer learning strategies are
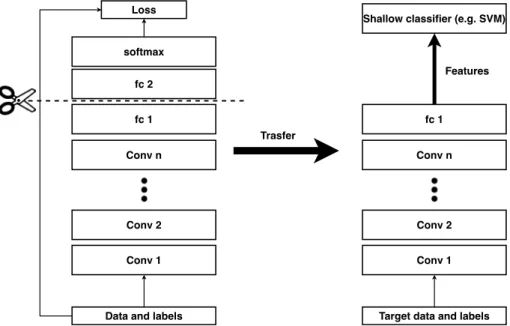
• Off-the-shelf Pre-trained Models as Feature Extractors. Deep learning models are layered architectures that learn different features at different layers (hierarchical representations of layered features). These layers are then finally connected to the last layer to get the final output. This lay-ered architecture allows utilizing a pre-trained network by removing the final layer and use the rest of the network as a feature extractor for other classification tasks, as shown in Figure2.10.
Conv 1 Conv 2 Conv n fc 1
Data and labels fc 2 softmax Loss Conv 1 Conv 2 Conv n fc 1
Target data and labels Shallow classifier (e.g. SVM)
Features
Trasfer
Figure 2.10: Transfer Learning with Pre-trained Deep Learning Models as Feature Extrac-tors.
The principal idea is utilizing the pre-trained model’s weighted layers as features extractor without updating the weights of the model’s layers during the new task’s training phase.
2.4 machine learning 19
• Fine Tuning Off-the-shelf Pre-trained Models. Deep neural networks are highly configurable architectures with various hyper-parameters. Using this fact, particular layers can be frozen ( weights are fixed) while the rest layers are retrained or fine-tuned to satisfy the new task, as shown in Figure 2.11.
In this way, the network’s architecture is utilized and used as a starting point for the retraining step.
Input Conv1 Conv2 Conv n FC
Softmax
output labels
Figure 2.11: In fine-tuning process, all convolutional layers (blue layers) in the network are fixed and gradient is backpropagated through the fully connected (FC) layer only.
2.4.6
Image augmentation for deep learning
Image augmentation is another solution to overcome the limited number of avail-able annotated images. It increases the size of the availavail-able data by applying some image transformation operations to the existing images from a training dataset to produce new versions of existing images. Image transformation operations in-clude rotation, shearing, translation, zooming, etc. these random transformations will produce different images each time.
2.4.7
Model evaluation and metrics
Model evaluation is a crucial part when developing data-driven models. The purpose of any predictive model is to correctly predict the target class value for unseen data instances with the highest possible accuracy. Thus, it is required to have a way of evaluating model performance, typically by quantifying it using some measure of model error. This same measure must be used to train the model to obtain high accuracy performance. One of the significant pitfalls when creating a predictive model is evaluating the trained model on the same or almost similar data to the training ones [49]. Adopting incorrect measures and evaluation
methods may lead to generate overfitted and over-optimistic models.
2.4.7.1 Model evaluation
There are two main methods of model evaluation in machine learning: (i)
hold-out validation; (ii) and cross-validation. Both methods use a separated test set of unseen data in model performance evaluation process. While in model training, the objective is to minimize the training error based on the chosen metric.
• Hold-Out Validation. It is called a train/test-split method which requires a part of the original data to be held-out from the training process. The final
2.4 machine learning 20
40
Fig. 3-5 10-fold cross validation. The designated training set is further divided up into K folds (K=10), each of these will now function as a hold-out test set in K iterations. Finally, the scores obtained from the model on individual iterations are summed and averaged into the final score. (image source: https://sebastianraschka.com)
Cross validation [24][26] is a further extension of the hold-out method. Cross validation is
widely accepted as the state-of-the art method for ensuring model reliability and improved
generalisation ability. In k-fold cross validation (
Fig. 3-5), k is the number of partitions that the
training set will be split into. The same k is also the number of iterations that the classifier will
execute, each resulting in an evaluation score. The k scores are then averaged to obtain the final
(training) score. For each iteration one of the (k-1)/k of the data is used for training the classifier,
while the remaining partition of size 1/k is used for validation of the model from that iteration.
With each iteration, the next, yet unused partition is set aside for validation test, and a new
model is trained from the remaining partitions as described above. The final score is then
averaged over the number of iterations, k. The advantages of k-cross validation are reduced
variance because of the averaging effect, but the process is slow having high resource
requirement, as the classifier has to be trained and multiple (k) times over the total size of the
training data.
3.2.4.2 Metrics
A good model measures what it was intended to measure and generalizes well to unseen data.
In this section, we will introduce the set evaluation metrics that will be used in the experiments.
The main motivation for choosing relatively many different metrics is to encourage comparative
experiments and provide an extended spectrum of potentially complementary information.
According to previous analysis by [51] it can be shown that most of the metrics commonly used
in machine learning for evaluating classifiers, fundamentally measure different things, this
being especially true for multiclass and imbalanced class problems.
Figure 2.12: 10-fold cross validation. The designated training set is further divided up into K folds (K=10), each of these will now function as a hold-out test set in K iterations. Finally, the scores obtained from the model on individual iterations are summed and averaged into the final score.
evaluation score is only computed through experimenting the test set on the produced model. This method is simple, relatively fast, and it ensures that the model is tested on unseen data. The main disadvantage in this method is that a part of the original data is removed from the training set of the model. Moreover, there is a risk to have high variance in the predictions. • Cross-Validation [58, 88]. This method is an extension for the hold-out
validation method. Cross-validation is a widely accepted and used in the state-of-the-art predictive methods for ensuring model reliability and gener-alization ability. In k − fold cross validation 2.12, k represents the number
of partitions that the training set will be divided into. Also, k represents the number of iterations that the trained model will execute, resulting an evaluation score at each iteration. The evaluation scores of k iterations are averaged to obtain the final score. For each iteration, (k-1)/k ratio of the original data is used for training a model, while the remaining partition with size of 1/k is used for model validation. With each iteration, the unused partition is set aside for the validation test, and a new model is trained from the remaining partitions as described above. The final score is computed through averaging over the number of iterations, k. The benefits of k − cross validation are in reducing variance due to the averaging effect. However, this process is quite slow and requires high resource requirement.
![Figure 1.2: A group of nonverbal behavioral cues is recognized as a social signal [ 136 ].](https://thumb-eu.123doks.com/thumbv2/123doknet/2225490.15407/21.892.157.756.129.406/figure-group-nonverbal-behavioral-cues-recognized-social-signal.webp)
![Figure 2.1: A smile gives an indication that the person is pleased or amused [ 126 ].](https://thumb-eu.123doks.com/thumbv2/123doknet/2225490.15407/26.892.191.702.556.783/figure-smile-gives-indication-person-pleased-amused.webp)
![Figure 2.2: Samples of basic six emotions displayed by facial expression from MMI dataset[ 133 ].](https://thumb-eu.123doks.com/thumbv2/123doknet/2225490.15407/27.892.218.673.453.910/figure-samples-basic-emotions-displayed-facial-expression-dataset.webp)

![Figure 2.6: Three common learning styles adopted in machine learning field [ 17 ].](https://thumb-eu.123doks.com/thumbv2/123doknet/2225490.15407/30.892.168.724.731.929/figure-common-learning-styles-adopted-machine-learning-field.webp)

![Figure 2.14: Eight-year-old with PWS: Note presence of morbid obesity [ 29 ].](https://thumb-eu.123doks.com/thumbv2/123doknet/2225490.15407/41.892.195.701.124.932/figure-year-old-pws-note-presence-morbid-obesity.webp)