HAL Id: tel-02524477
https://tel.archives-ouvertes.fr/tel-02524477
Submitted on 30 Mar 2020
HAL is a multi-disciplinary open access
archive for the deposit and dissemination of sci-entific research documents, whether they are pub-lished or not. The documents may come from teaching and research institutions in France or abroad, or from public or private research centers.
L’archive ouverte pluridisciplinaire HAL, est destinée au dépôt et à la diffusion de documents scientifiques de niveau recherche, publiés ou non, émanant des établissements d’enseignement et de recherche français ou étrangers, des laboratoires publics ou privés.
Visual interactive knowledge management for
multicriteria decision making and ranking in linked open
data environments
Evangelia Triperina
To cite this version:
Evangelia Triperina. Visual interactive knowledge management for multicriteria decision making and ranking in linked open data environments. Information Theory [cs.IT]. Université de Limoges, 2020. English. �NNT : 2020LIMO0010�. �tel-02524477�
UNIVERSITE DE LIMOGES
ECOLE DOCTORALE SCIENCE – TECHNOLOGIE
Equipe de recherche ou Laboratoire XLIMThèse
pour obtenir le grade de
DOCTEUR DE L’UNIVERSITÉ DE LIMOGES
Discipline / Spécialité : Informatiqueprésentée et soutenue par Evangelia TRIPERINA
le 24 Janvier 2020
Visual Interactive Knowledge Management for Multicriteria Decision
Making and Ranking in Linked Open Data Environments
Thèse dirigée par Professeur Georges MIAOULIS
et Professeur Olivier TERRAZ
JURY :
Président du jury
M. Nikolaos VASSILAS, Professeur, Université de l'Attique de l'Ouest Rapporteurs
M. Nikolaos DOULAMIS, Professeur Associé, Ecole Polytechnique d’Athènes Mme. Aikaterini KABASSI, Professeure Associé, Université Ionienne
Examinateurs
M. Jean-Pierre JESSEL, Professeur, Université Paul Sabatier
M. Georges MIAOULIS, Professeur, Université de l'Attique de l'Ouest M. Olivier TERRAZ, Professeur, XLIM, Université de Limoges M. Nikolaos VASSILAS, Professeur, Université de l'Attique de l'Ouest
T hè se de doc tora t
A la mémoire de mon père et mes grands-parents, à ma famille.
Remerciements
Je voudrais remercier Monsieur Olivier Terraz, professeur, membre du département d’informatique de l’Université de Limoges et Monsieur Georges Miaoulis, professeur, membre du département d'informatique et d'ingénierie informatique de l'Université de l'Attique de l'Ouest, pour la supervision et le soutien de ce travail lors d’avoir fait partie du jury. Je tiens à les remercier de m'avoir donné la possibilité de réaliser ce travail.
Je tiens également à remercier la professeure Madame Cleo Sgouropoulou, le maître de conférences Monsieur Georges Bardis et le professeur adjoint Monsieur Ioannis Xydas, tous membres du département d'informatique et d'ingénierie informatique de l'Université de l'Attique de l'Ouest, pour leurs précieuses contributions en tant que co-encadrant dans cette thèse.
Je voudrais remercier Monsieur Jean-Pierre Jessel, professeur à l’Université Paul Sabatier de bien vouloir fait partie du jury, et de me faire l’honneur d’être présent à la soutenance, et Monsieur Nikolaos Vassilas, professeur, membre du département d'informatique et d'ingénierie informatique de l'Université de l'Attique de l'Ouest de bien vouloir présider ce jury, et de me faire l’honneur d’être présent à la soutenance.
Je voudrais remercier la professeure Madame Aikaterini Kabassi, Professeure Associé, Université Ionienne, et l’associate professor Monsieur Nikolaos Doulamis, membre de l’Ecole Polytechnique d’Athènes, pour avoir bien voulu rapporter sur cette thèse, et pour leurs remarques pertinentes qui ont permis d’améliorer ce travail.
Je remercie Anastasios Tsolakidis pour sa coopération et encouragement. Je voudrais remercier le professeur adjoint Monsieur Athanasios Voulodimos, membre du département d'informatique et d'ingénierie informatique de l'Université de l'Attique de l'Ouest pour ses remarques pertinentes qui ont permis d’améliorer ce travail.
Enfin, je voudrais remercier ma famille pour son soutien et ses encouragements continus tout au long de ces années.
Droits d’auteurs
Cette création est mise à disposition selon le Contrat : « Paternité-Pas
d'Utilisation Commerciale-Pas de modification 3.0 France » disponible en ligne :
«VISUELLE INTERACTIVE GESTION DES CONNAISSANCES POUR LA PRISE DE DÉCISIONS ET LE CLASSEMENT MULTICRITÈRES DANS DES ENVIRONNEMENTS DE DONNÉES OUVERTES LIÉS»
Résumé
Le doctorat impliqués la recherche dans le domaine des représentations visuelles assistées par des technologies sémantiques et des ontologies afin de soutenir les décisions et les procédures d'élaboration des politiques, dans le cadre de la recherche et des systèmes d'information académique. Les visualisations seront également prises en charge par l'exploration de données et les processus d'extraction de connaissances dans l'environnement de données liées. Pour élaborer, les techniques d'analyse visuelle seront utilisées pour l'organisation des visualisations afin de présenter l'information de manière à utiliser les capacités perceptuelles humaines et aideront éventuellement les procédures de prise de décision et de prise de décision. En outre, la représentation visuelle et, par conséquent, les processus décisionnels et décisionnels seront améliorés au moyen des technologies sémantiques basées sur des modèles conceptuels sous forme d'ontologies.
Ainsi, l'objectif principal de la thèse de doctorat proposée consiste en la combinaison des technologies sémantiques clés et des techniques de visualisation interactive basées principalement sur la perception du graphique afin de rendre les systèmes de prise de décision plus efficaces. Le domaine de la demande sera le système de recherche et d'information académique.
Domaine d'application: Recherche de gestion de l'information et
d'exploration de données éducatives dans l'enseignement supérieur
Mots clés: Visualisation, Analyse visuelle, Technologies sémantiques,
«VISUAL INTERACTIVE KNOWLEDGE MANAGEMENT FOR MULTICRITERIA DECISION MAKING AND RANKING IN LINKED OPEN DATA ENVIRONMENTS»
Abstract
The dissertation herein involves research in the field of the visual representations aided by semantic technologies and ontologies in order to support decisions and policy making procedures, in the framework of research and academic information systems. The visualizations will be also supported by data mining and knowledge extraction processes in the linked data environment. To elaborate, visual analytics’ techniques will be employed for the organization of the visualizations in order to present the information in such a way that will utilize the human perceptual abilities and that will eventually assist the decision support and policy making procedures. Furthermore, the visual representation and consequently the decision and policy making processes will be ameliorated by the means of the semantic technologies based on conceptual models in the form of ontologies.
Thus, the main objective of the proposed doctoral thesis consists the combination of the key semantic technologies with interactive visualisations techniques based mainly on graph’s perception in order to make decision support systems more effective. The application field will be the research and academic information systems.
Application field: Research information management and educational data
mining in Higher Education
Key words: Visualization, Visual analytics, Semantic Technologies,
Table of Contents
A la mémoire de mon père et mes grands-parents,
à ma famille... i Remerciements ... iii Droits d’auteurs ... v Chapter 1 . Introduction ... 1 1.1 Introduction ... 1 1.1.1 MCDM ... 2 1.1.2 Visual analytics ... 2
1.1.3 Ontologies and the Semantic Web ... 3
1.2 Structure ... 3
1.3 Motivation ... 3
1.4 Thesis overview... 4
1.4.1 Related efforts ... 4
1.5 Research problem and hypotheses/research questions ... 6
1.6 The proposed approach and research methodology ... 14
1.7 Contribution areas ... 15
1.7.1 Multidimensional Ontology Based Visual Ranking (MOBVR) ... 17
1.8 Prospective Benefits ... 17
1.9 Thesis organization ... 18
1.10 Summary and conclusion... 18
Chapter 2 . Literature overview ... 19
2.1 Introduction ... 19
2.2 Structure ... 19
2.3 Decision support ... 20
2.3.1 Multiple criteria decision making ... 23
2.3.2 Comparison between Multiple criteria decision making methods 34 2.4 Visual analytics ... 35
2.4.1 Visual analytics and visualization ... 37
2.4.2 Visual analytics of multidimensional datasets ... 38
2.4.3 Visual analytics techniques ... 39
2.4.4 Human cognition and perception ... 40
2.5 Semantic web ... 41
2.5.1 Semantic organization of the data ... 43
2.5.2 Ontology... 43
2.5.3 Schema and ontology matching ... 45
2.5.3.1 Schema matching ... 45
2.5.3.2 Ontology matching ... 45
2.5.4 Linked Data and Linked Open Data ... 46
2.6 Combining DM, visual analytics and ontologies ... 48
2.6.1 Literature review on the combination of decision making methods / MCDM and ontologies ... 49
2.6.2 Literature review on multi-faceted MCDM ranking methods ... 52
2.6.3 Literature review on the combination of decision making and visual analytics ... 53
2.6.4 Literature review on the combination of visual analytics and ontologies 54 2.6.5 Summary and conclusion ... 55
Chapter 3 . Methodology ... 57
3.1 Introduction ... 57
3.2 Structure ... 57
3.3 Methodology ... 58
3.3.1 General definition of the approach ... 58
3.3.2 Significant variables ... 59
3.3.3 Instrumentation ... 60
3.3.4.1 The MOBVR competency check ... 63
3.3.4.2 Data layer ... 65
3.3.4.3 Ontology layer... 65
3.3.4.4 Dynamic multidimensional decision making layer ... 69
3.3.4.5 Interactive presentation layer ... 75
3.3.4.5.1 The performance profiles ... 79
3.3.4.6 Reusability layer ... 81
3.4 Limitations and delimitation ... 81
3.5 Case studies and cross-case analysis ... 81
3.6 Summary and conclusion ... 81
Chapter 4 . Design and implementation ... 83
4.1 Introduction ... 83
4.2 Structure ... 83
4.3 Key technologies and tools ... 83
4.3.1 Key flows ... 84
4.4 The MOBVR prototype ... 85
4.5 Generic aspects of the MOBVR system ... 85
4.5.1 Web interface ... 85
4.5.2 General ranking method ... 86
4.5.3 Semantic Web components ... 86
4.5.4 MCDM method ... 91
4.5.4.1 Algorithm ... 91
4.5.5 Visual analytics approach ... 93
4.6 Domain specific aspects of the MOBVR system ... 93
4.6.1 Case study 1: Academic multidimensional ranking ... 94
4.6.2 Case study 2: World Development Indicators ... 130
4.8 Cross-case analysis ... 158
4.8.1 Cases similarities... 160
4.8.2 Cases differences ... 161
4.8.3 Patterns across the cases ... 162
4.9 Summary and conclusion ... 164
Chapter 5 . Conclusion and perspectives ... 165
5.1 Structure ... 166
5.2 Findings ... 166
5.3 Theoretical implications ... 172
5.3.1 Contribution ... 172
5.4 Policy implications ... 173
5.5 Limitation of the study ... 173
5.6 Recommendation for future research ... 174
5.7 Summary and conclusion ... 174
Index of abbreviations ... 177
Appendix ... 181
Appendix 1 – Academic ontologies ... 181
Bibliography ... 187
List of tables Table 1 – A classification of MCDM methods ... 25
Table 2 - MOBVR competency check and the obligation of the questions [292] ... 63
Table 3 – Example of values’ assignment of domain to MCDM-base ontology [293] ... 68
Table 4 - The MOBVR-ELECTRE III and MOBVR resolution method [294] ... 70
Table 5 – MOBVR ontology requirements specification ... 87
Table 7- Dimensions and criteria for the academic domain grouped based on
the dimension they belong to and their context ... 102
Table 8 – AcademIS ontology requirements specification [295]... 103
Table 9 – Ontologies that AcademIS reuses ... 110
Table 10 - Pre-glossary of Terms and Their Frequency [295] ... 111
Table 11 – The dimensions of academic ranking and their weights ... 114
Table 12 - The criteria of each dimension of academic ranking and their weights ... 115
Table 13 – The identified profiles in academia and their corresponding dimensions ... 116
Table 14 – An excerpt of Tbox, Rbox And Abox Of Academis Ontology In Description Logic [292] ... 120
Table 15 – Excerpt SPQs and their SPARQL equivalent ... 123
Table 16 – WDI ontology requirements specification ... 133
Table 17 - Glossary of Terms and Their Frequency (Excerpt) ... 136
Table 18 - The dimensions of world development ranking and their weights ... 138
Table 19 – An excerpt of the criteria of each dimension of world development ranking and their weights ... 139
Table 20 – The identified profiles in the WDI & the corresponding dimensions ... 140
Table 21 – An excerpt of Tbox, Rbox And Abox Of WDI Ontology In Description Logic [292] ... 144
Table 22 – Excerpt SPQs and their SPARQL equivalent ... 149
Table 23 – Statistics of the knowledge bases of the case studies, amount of relations, number of relations with less or equal than 50 triples and total amount of triples... 157
Table 24 – Amount of #owl:sameAs links in the knowledge bases ... 157
Table 25 – Percentage of queries using the different SPARQL features ... 157
Table 26 – Ranking patterns word table (2 ranking domains and their characteristics) ... 159
Table 27 – Patterns of multidimensionality word table (2 multidimensional domains and their characteristics) ... 159
Table 28 – Visual analytics patterns word table (2 case study and their
characteristics) ... 159
Table 29 – Decision making patterns word table (2 case study and their characteristics) ... 160
Table 30 – Patterns on the organization of the data word table (the 2 case study and their characteristics of organization of the data) ... 160
List of figures Figure 1 – The main topics of research ... 4
Figure 2 – Publication and the addressed research questions ... 13
Figure 3 - Simon's phases of decision making [26] ... 20
Figure 4 – Decision making process steps ... 21
Figure 5 – High level architecture of a Decision Support system (DSS) [24] . 23 Figure 6 – ELECTRE methods timeline ... 30
Figure 7 - Combination of visual and automatic data analysis [19] ... 36
Figure 8 - A schematic diagram of the visualization process [27] ... 38
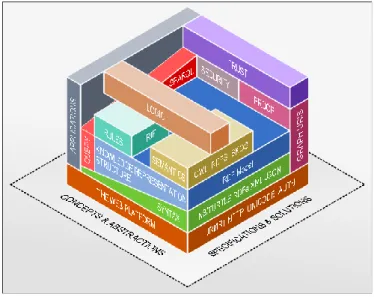
Figure 9 - The semantic web stack ... 42
Figure 10 - Ontology languages in the Semantic Web Architecture [34] ... 44
Figure 11- Classification of schema-based matching techniques [283]... 45
Figure 12 – LOD cloud, indicating the evolution of LOD (from 2007, to 2011 and finally to 2019), from lod-cloud.net [219] ... 47
Figure 13 – Flowchart of ranking a multidimensional domain [293] ... 62
Figure 14 – The MOBVR architecture (adapted from [294]) ... 63
Figure 15 – The evolution of the ontology throughout the framework... 67
Figure 16 – DATA (Decision Aiding Terms Alignment) method ... 68
Figure 17 – Performance profiles ... 79
Figure 18 – Overview of the MOBVR domain-independent parts of the ontology ... 90
Figure 19 – VIVO-ISF ontology ... 109
Figure 20 – Overview of the AcademIS domain model [295] ... 112
Figure 21 – The additional data property ... 112
Figure 22 – The additional object properties ... 112
Figure 24 – Overview of the main topics of the AcademIS interface and the amount of their contents... 125
Figure 25 – The webpage for a research project and its related information . 125 Figure 26 – Research fingerprint of an academic faculty ... 126 Figure 27 – Comparative ranking of the academic departments ... 126 Figure 28- WDI domain model ... 136 Figure 29 – Comparative ranking of countries based on the results of the ontology-based ELECTRE III ... 151
Chapter 1 . Introduction
1.1 IntroductionRanking constitutes a way of solving numerous problems, ranging from defining the classification of candidates for a specific task to concluding to the most suitable action among a set of alternatives that may lead to the desired outcome. Rankings may depend either on a single, or numerous variables. Single dimension ranking problems are usually less complex, while in the case of multiple criteria the resolution of the problem becomes more perplexed and calls for a more elaborate solution. In order to respond to multidimensional ranking, all the facets that contribute to the formation of the final decision must be taken into account, along with the significance that each feature holds in the specified problem. An effective way to handle that kind of computer-aided decision making process is the Multiple Criteria Decision Making (MCDM).
Multiple-Criteria Decision Making involves the process of many variables to support the decision maker with a specific problem. However, there are several ways to enhance the MCDM process and to aid the decision maker both efficiently and effectively. The introduction of the Semantic Web technologies to the core of the MCDM procedure ameliorate the process by enabling the reproducibility and transparency of the method and its results, the interoperability of the data and the adaptability of the system to other application fields. Furthermore, by employing visual analytics in the presentation stage of the MCDM process, the information becomes easier processible and understandable by the decision maker, leading to more informed decisions made in less time and with less effort.
Especially, when MCDM is applied in the ranking problematic, the before mentioned enhancements are even more needed. The multiple-criteria ranking problematic implicates the classification of the alternatives based on multivariate data, while the multidimensionality of a domain indicates added levels of complexity. The involvement of the semantic web in the multidimensional data ranking expedite the
whole lifecycle of the information, including the input, structure, management, export and reuse of information, while the visual analytics ease the presentation and the understanding of the complex and multidimensional information and results. This thesis is focused on multidimensional ranking facilitated by a MCDM method aided by visual analytics and semantic web technologies. A brief description of the involved disciplines follows in the next paragraphs.
1.1.1 MCDM
Multiple-criteria decision-making (MCDM) or multiple-criteria decision analysis (MCDA) refers to decision making that relies on the processing of multiple attributes. MCDM problems are encountered often in everyday life. Examples of MCDM problems range from selecting a Personal Computer to purchase based on its various characteristics, to choosing employees to recruit for a job based on specific criteria. Many different approaches have been developed to respond to multiple criteria decision making. These methods are applicable to several problems that can be classified to the following categories: choice, sorting, ranking and description [98]. Any MCDM problem comprises four components: the set of alternatives, the set of criteria, the outcome of every choice and the preference structures [99].
In MCDM, the decision makers set their preferences on the various criteria in order to retrieve a solution that matches their requirements. This process is considered subjective and ultimately depends on the opinion and the needs of the involved decision maker.
1.1.2 Visual analytics
Visual analytics concerns analytical reasoning facilitated by interactive human-machine interfaces [100]. It meant to solve problems of great size and high complexity by taking advantage and augmenting the human cognitive capabilities. The goal of visual analytics is to “make the way of processing data and information transparent for
analytical discourse” [19] and to aid understanding, reasoning and decision making in
Visual representation enables the processing of larger amount of information than in text, due to the increased visual human perception [17]. They also empower deeper understanding of complex multi-dimensional data, revealing information that otherwise will not be obvious [17]. Thus, the information becomes easier detectable.
1.1.3 Ontologies and the Semantic Web
Nowadays, the Linked Open Data (LOD) cloud is growing at a fast pace. Datasets from multiple domains are published in Linked Open Data underlining both the significance of opening the data rather than keep it in data silos, as well as linking the data with other already existing datasets. Semantic web technologies provide the means and the techniques to generate LOD datasets.
Ontology is one of the components of the Semantic Web that is utilized to provide structure of the information in an explicit way. Furthermore, the semantic web introduces several valuable characteristics to datasets, such as transferability, open access and interoperability [133].
1.2 Structure
The remaining sections of this chapter are structured as follows: the motivation for the dissertation is described. Moreover, the thesis overview is presented along with the related efforts on the domain, followed by the hypothesis and the thesis objectives are outlined. The proposed approach and the research methodology are also described, then the contribution areas are referred and the prospective benefits from this research are analyzed. Finally, the thesis organization is outlined followed by the summary and conclusions of the introduction.
1.3 Motivation
The motivation for our work stems from the need of a reproducible and transparent multidimensional ranking method that is capable of using state of the art technology to adapt in various settings, as well as actively and proactively support the
stakeholders during the decision making procedure. Due to the nature of this problem multiple scientific areas are involved:
i) the decision making and more specifically the MCDM,
ii) the visual analytics for the interactive support of the stakeholders, and iii) the semantic web for the formation of the interoperable data.
1.4 Thesis overview
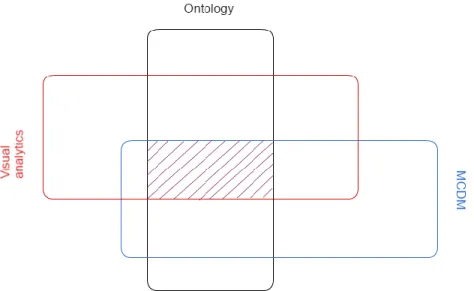
The thesis is concentrated on the visual enabled ontology-based multiple criteria decision support, focused on the ranking problematic. The Multidimensional Ontology-Based Visual Ranking is based on visual analytics, ontologies and Semantic Web technologies to enhance, boost and generalize the decision making process. Apart from combining the before mentioned disciplines, we propose a novel technique for multifaceted ranking that seamlessly integrates MCDM, visual analytics and Semantic Web (Figure 1).
Figure 1 – The main topics of research
1.4.1 Related efforts
Though there are several methods that successfully rank the alternatives based on multiple criteria, little work has been done in multifaceted ranking [130, 131]. Bearing in
mind that all the efforts for multifaceted ranking correspond to multiple levels of hierarchy [130, 131], there is none approach that clusters the criteria into groups based on their similarity. In an approach that adopts multiple levels of hierarchy in MCDM, a problem is divided into sub-problems that facilitate the specification of a preference model at each node of the hierarchy [130], while another method decomposes a problem into individual sub-problems in different levels of hierarchy [131]. However, treating the criteria in groups with related subjects, allows the generation of individual and combinable ranking sub-profiles that are able to shed light to all the separate missions of an entity.
Although, there are approaches that combine the MCDM approaches with ontologies [109, 110, 111, 112, 113], several methods utilize the ontologies as a structure mechanism that is not implicated to the decision making [114, 115, 116] or the multiple criteria decision mechanism [117, 118, 119, 120], while other methods solely rely on the ontology to provide the decision making process by the means of the ontology reasoning [109, 121 - 129]. Nevertheless, there are added benefits from employing a hybrid approach that merges a MCDM method with ontologies and exploits them at all the stages of the decision making process. The facilitation of the structure of the MCDM method information by ontologies diminishes the dependency of the data from the involved information system and vice versa. A methodology that implements a concrete decision making method allows for efficient and effective results on the multidimensional setting, while a reasoning mechanism based on ontologies provides deeper exploration and understanding of the information.
MCDM results are better perceived in visual form due to their size and complexity. As a result, visual representation has been used widely in MCDM [108]. Since visual analytics simplify the complex information by making it easier processible. There are only a few efforts that implement visual analytics in MCDM [101 - 107]. Visual analytics have been used in MCDM for textile composite materials selection [101], for finding the ideal landfill monitoring process [102], for observing and comprehending critical infrastructures, cascading infrastructure effects, and managing crisis response [105], or the evaluation of building design alternatives [103]. It has been
also utilized for evaluating low energy building design alternatives [104] and for geo-social visual analytics [106]. The introduction of the interactive multi-objective optimization (IMO), a new subdomain which merges visual analytics (VA) and Multiple Criteria Decision Making (MCDM) further proves the significance of the combination of those two fields [107].
Nonetheless, none of the before mentioned approaches is occupied with the multidimensional ranking of entities’ performance. The proposed approach eases the decision making by presenting the multidimensional ranking in formation with the assistance of visual analytics.
1.5 Research problem and hypotheses/research questions
The research problem is related to the ranking of a domain, characterized by multiple dimensions and multiple criteria. The situation of relying on multifaceted data to rank a group of entities that belong to the same category generates an abundance of information that the human brain and perceptional abilities cannot process easily if it is not presented appropriately. It is quite difficult to manage the performance related data of numerous alternatives on multiple dimensions and criteria, and to conclude on which of the presented alternatives is more consistent with the stated requirements. While this problem has been addressed in textual form, there is also the need to visualize the results in an interactive manner. This problem impacts the user of the DSS in terms of time, effort and efficiency, because the process of filtering the information to meet the indicated specifications can be tedious, time consuming and error-prone.
It is of vital importance to be able to reproduce the results in order to check the validity of the rankings. In order for the rankings to be reproducible, the data upon which they are based should be available in an open and processible form. Nonetheless, the most rankings provide only their results and abstain from revealing the relevant data or process. Even for those rankings that provide their input data, it is challenging to reproduce them, due to the format of the data, which hinder the validation of the rankings. In the proposed approach, the entire ranking information, including inputs and
outputs of the method, together with information about the process itself (because it is depicted in the ontology), can be exported in semantic web compliant format. Hence, the examination of ranking results from a third party becomes feasible and requires minimum effort. Furthermore, important information for the ranking domain can be overlooked due to the profusion of data. The decision maker should be able to access not only the outputs of the rankings, but also the information about the domain and the alternatives, so as to make an informed decision. To enable the deeper exploration of the information, the dataset is queried based on semantic web technologies.
The main objective of this work is to combine the power of visual analytics and Linked Open Data in order to assist the decision making process of the stakeholders in the context of multidimensional domains. The aim is to propose a methodology, in which each of these areas contributes its outmost to ameliorate the MCDM process. More detailed description is available at Chapter 3. Methodology.
This work contributes to the body of knowledge, by answering the following question:
1. How can a visual-aided ontology-based MCDM system facilitate informed and insightful decisions on multidimensional data?
This question can be further analyzed to the following sub-questions:
1.1. How can visual analytics be implemented and integrated in a MCDM system to aid the DM process?
1.2. How can ontologies be utilized to facilitate a MCDM ranking method regardless the domain?
1.3. How can visual analytics and semantic web technologies be combined in order to enhance the user-system interaction?
1.4. How can we make ranking deductions for multifaceted data irrespective of the context?
2. What is the current stage of ontology-based decision making methods and what are the research gaps?
3. Which are the prerequisites for an application domain in order to apply to it the Multidimensional Ontology-Based Visual Ranking framework?
4. What is the current stage on multidimensional MCDM approaches?
Our research focuses not only on bridging the gap and conglomerating these heterogeneous scientific domains, but proposes a concrete and reproducible methodology on ranking that will significantly assist the involved stakeholders, augment the efficacy of the decision making process and reduce the time spent on this task. In the following paragraphs, the research questions and their background in the literature will be outlined and also the related research gaps addressed by this study will be discussed.
RQ1: How can a visual-aided ontology-based MCDM system facilitate
informed and insightful decisions on multidimensional data?
MCDM methods involve the processing of multivariate data. Thus, the data required by a MCDM method, the process of the data and the presentation of the information implicate increased complexity and great volume. Visual analytics are used for reducing the intricacy of the information and for allowing the process of larger amount of data [17]. Likewise, semantic web technologies enable the discovery of information and relations within the data that would be inaccessible in any other way. The ontologies abstract the domain specific information from an information system making it receptive to other domains and adjustable to changes.
When it comes to information systems dedicated to decision making, it is essential to be able to effortlessly transfer the associated methodology to other application fields. The goal in this case is to construct a backbone for the visual aided decision making process facilitated by ontologies to host and contain the domain specific information through its whole lifecycle in the system. This methodology will be discussed further in section 4.6.1 Multidimensional Ontology Based Visual Ranking (MOBVR).
RQ1.1: How can visual analytics be implemented and integrated in a MCDM
system to aid the DM process?
Visual analytics accelerate the processing speed of the information [96]. To be more specific, the information when presented in visual form can be handled by humans more easily, due to the increased visual perception capabilities in relation to the processing of information in other form [97]. Especially, in MCDM, where the volume and the multiplicity of the information are great, it is essential to reduce the cognitive burden. However, the utilization of visual analytics in multidimensional decision making in ranking problematic is yet to be explored. This leads us to the RQ1.1.
Multidimensional ranking involves the processing and the weighting of the alternatives and results in the presentation of the ranking outputs. Since the ranking outputs are also multifaceted themselves, it is important to allow the user to conceive the presented information and to make their decision based on it. To amplify the perception abilities of the decision makers, we employ visualizations of the MCDM results with the multidimensional comparative ranking visualization. Capturing and displaying multidimensional information concerning the performance indicators of an entity also implicates complex and abstruse data that needs to be understood by the involved stakeholders. The aim is to design and implement a method, called fingerprint, which visually presents the multidimensional performance data of any entity, compared to other entities or based to predefined profiles. These features will be presented in Chapter 4 –
Methodology.
RQ1.2: How can ontologies be utilized to facilitate a MCDM ranking method
regardless the domain that would also enable deeper exploration of the data?
Ontologies introduce several characteristics when they are used, such as interoperability and dynamic features [133]. They also allow profounder understanding of the data involved, because of the semantic relationships that are inherent in this type of information [134]. MCDM ranking can benefit from the semantic web technologies for a more independent and detailed investigation of the information. The multiple criteria
decision making methodology can also be ameliorated by the transferability which is offered by the ontologies. Hence, it is vital to explore the merging of ontologies and MCDM in such a way that may benefit the decision maker. This matter will be described in section Chapter 3. Methodology.
RQ1.3: How can visual analytics and semantic web technologies be combined
in order to enhance the user-system interaction?
Visual analytics allow the user to process larger amount of information [135] and to more effortlessly comprehend the presented data [136]. So, they can be utilized to present ontology structured data and take advantage of the rich semantic information and relationships [137] to enable the user to access and process the relevant data. Nowadays, little work has been done in representing ontologies by visual analytics [138]. This feature will be discussed in Chapter 4 – Methodology.
RQ1.4: How can we make ranking deductions for multifaceted data
irrespective of the context?
Ranking multifaceted information involves the processing of large amount of complex data. The development of a multidimensional ranking approach that makes this process dynamic, generally applicable and permits its utilization in numerous application fields is facilitated by the semantic web. This aspect of the method will be presented in
Chapter 4 – Methodology.
RQ2: Which are the prerequisites for an application domain in order to apply
to it the Multidimensional Ontology-Based Visual Ranking framework?
The proposed framework, the Multidimensional Ontology-Based Visual Ranking framework, is developed to respond to a certain type of problematic. More precisely, it aims to rank multidimensional disciplines based on a MCDM method. The requirements that an application domain must suffice in order for the MOBVR technique to be applied to it are described thoroughly in the MCDM competency check. The MCDM competency check constitutes a mandatory step prior to the application of the developed framework to
a discipline that ensures their compatibility. The prerequisites in order for the MOBVR framework to be applied to a domain are described in section 4.3.4.1 The MOBVR
competency check.
RQ3: What is the current stage of decision making methods assisted by visual
analytics and/or semantic web technologies and what are the research gaps?
Ontologies have been utilized in decision making to ameliorate the process, to provide structure to the data and to promote sharing [132], or as a reasoning mechanism that entails decision support capabilities [109]. The majority of such ontology-based approaches employ decision making process, whereas fewer ontology-based approaches are utilized in MCDM systems. Several approaches that combine decision making or multiple criteria decision making and ontologies use the ontology as the source of the information needed from the decision making system, while others employ ontology reasoning mechanisms to facilitate the decision making process. Although ontologies have been utilized in decision making, there are just a few ontology-based MCDM methods and the majority of them are not dynamic since they are implemented to meet the specific needs of a single domain.
In the section 2.6.1 Literature review on the combination of decision making
methods and ontologies the current stage and the research gaps of ontology-based
decision methods will be discussed. Visual analytics can enhance the knowledge and the decisions [150]. Therefore, the field of visual analytics for decision making [234] is constantly evolving. Although many decision making methods has been assisted by visual analytics, there are fewer multiple criteria decision making methods that utilize visual analytics. In the section 2.6.2 Literature review on the combination of decision
making methods and visual analytics will described the current stage of the decision
making methods that are enhanced by visual analytics, as well as the identified research gaps.
Ontologies and visual analytics assist the deeper understanding and exploration of data and can foster the decision making process. There are a few methods that involve
decision making, visual analytics and ontologies. Nonetheless, there are not any MCDM methods that employ visual analytics and ontologies to support decisions. The current stage of decision making methods facilitated by visual analytics and ontologies and the research gaps will be outlined in the section 2.6 Combining DM, visual analytics and
ontologies.
RQ4: What is the current stage on multidimensional MCDM approaches and
what are the research gaps?
MCDM approaches involve the processing of multiple variables. Usually, several of these variables have certain similarities among them. These variables can form separate profiles, which may judge the outcome of the decision making. Hence, it is important to be able to capture and express these profiles. However, the existing multifaceted MCDM methods consider multiple levels of criteria [130, 131], rather than clustering of the criteria that we consider in our method. The literature review will be discussed in the section 2.8.1.3 Literature review on multi-faceted MCDM ranking
methods.
The research questions are also addressed in the conducted research publications as shown in Figure 2. The research publications that were published concerning this thesis are the following:
1. Triperina, E., Sgouropoulou, C., Xydas, I., Terraz, O., & Miaoulis, G. (2015). Creating the context for exploiting linked open data in multidimensional academic ranking. International Journal of Recent Contributions from Engineering, Science
& IT (iJES), 3(3), 33-43.
2. Triperina, E., Sgouropoulou, C., Xydas, I., Terraz, O., & Miaoulis, G. (2017, April). Assessing the performance of educational institutions: A multidimensional approach. In Global Engineering Education Conference (EDUCON), 2017
IEEE (pp. 1337-1344). IEEE.
3. Triperina, E., Bardis, G., Sgouropoulou, C., Xydas, I., Terraz, O., & Miaoulis, G. (2018). Visual-aided Ontology-Based Ranking on Multidimensional Data: A Case Study in Academia. Data Technologies and Applications, Vol. 52 Issue: 3,
pp.366-383, https://doi.org/10.1108/DTA-03-2017-0014.
1.6 The proposed approach and research methodology
Multidimensional ranking involves the ranking of multiple criteria. The multiple criteria are grouped in several dimensions, which have similar characteristics. A multidimensional ranking system should satisfy the following needs:
Access information related to the activities, the relationships and the interactions that happen within a unit.
Gain insights about the performance of units, to compare them, or to learn about the ranking information of the units.
Acquire information about the quality of the offered services or products of a unit.
Simplify the complex multidimensional ranking information to aid the decision making process of the user. Enable the testing of the ranking information.
We have built a framework according to the before mentioned needs. The framework is composed by the data layer, the ontology layer, the dynamic multiple criteria decision making layer and the presentation layer. In the data layer the data aggregation takes place, where the information is accumulated from various sources. The data is unified and structured by the ontology in the ontology layer. The MOBVR (Multidimensional Ontology-Based Visual Ranking) ontology constitutes the core of the dynamic multiple criteria decision making layer, which assists the alignment between the ontology structured data to the information required for the ranking. The presentation layer consists of the ranking results facilitated by visual analytics and semantic web that aids the deeper understanding of the ranking information and the reusability layer allows the transferability of the data to other systems.
To validate the before described framework, two application domains have been selected that satisfy its prerequisites – the MOBVR competency check. The first domain is the academic discipline, whereas the second domain is the world development indicators derived by the World Bank. The before mentioned domains have been selected to satisfy the prerequisites of the MOBVR methodology. The proposed methodology includes the definition and implementation of an ontology for each involved application
field. The first ontology is named AcademIS (AcademIS), and depicts research and education in the Higher Education Institutions (HEIs). The second ontology is the WDI-IS and captures the world development indicators. The domain ontologies (AcademWDI-IS and WDI-IS) function as a basis for the transformation of the information to Linked Open Data. In this document, we will call this process LODification. Following is the implementation of an information system, which (i) displays the contents of the dataset, (ii) provides interactive visualization of the data, (iii) applies a multidimensional ranking technique and (iv) visualizes its results, (v) computes the academic fingerprint of the institution and (vi) assists the user into shaping its own decisions.
In order to ensure the validity of our process, we have applied the methodology in two application fields. The required modification that should be applied to the method to host another application field will be also described. To further assure the validity of the proposed technique, we aim to evaluate the performance of Multidimensional Ontology Based Visual Ranking (MOBVR) prototype. After the design of the Multidimensional Ontology Based Visual Ranking (MOBVR) framework and the implementation of the respective prototype system, an evaluation of the aforementioned system will be conducted that will be presented in Chapter 3 – Methodology.
1.7 Contribution areas
In this paragraph, we will introduce the contribution areas of the thesis. The proposed thesis is multidisciplinary. Although our research is focused on the generation and implementation of a multiple criteria ranking approach, auxiliary methods have been developed to support the overall process. In the following section the major contributions of this approach will be described. More specifically, we propose:
In terms of methodology
A hierarchical framework that ranks entities assisted by ontologies and visual MCDM, namely the Multidimensional Ontology Based Visual
Ranking (MOBVR).
A new visual enhanced ranking method based on MDCM algorithms to aid the decision maker.
A new technique on utilizing and unifying structured and unstructured data from heterogeneous sources based on ontologies, namely the
LODification method.
Application related
An interactive semantic web interface that allows both textual and visual representation of the information.
Focused on the application field
A new ontology, the AcademIS ontology, which combines renowned narrow-scoped ontologies and extends them in terms of concepts and relationships and introduces rules.
A new ontology, the WDI (World Development Indicators) ontology. An analysis of the requirements and criteria for the application of the
process in the academic field.
An analysis of the requirements and criteria for the application of the process in the world development domain.
First and foremost, through this approach a novel ontology is introduced that incorporates the characteristics of all the facets of academia, as well as their intersections. Moreover a domain model for the world development field. Another area, in which this doctoral thesis contributes, is the use of visualizations for the Linked Open Data. Graphs are the most common use of visualization for the Linked Open Data that solely reveal the structure of data, whereas in this effort, we showed the multidimensional relationships of the data. The visualization aided multiple criteria decision making methodology is also proposed in the dissertation. Another contribution of this dissertation is the introduction of the academic unit fingerprint, which measures the proportion of an institution based on specific profiles. For instance, when the selected profile is the education, the system
inspects only the characteristics that are relevant to education and defines the score of the institution based only on these characteristics.
1.7.1 Multidimensional Ontology Based Visual Ranking (MOBVR)
The motivation of this work was to exploit the advantages of MCDM in the ranking problematic and to ameliorate them with the introduction of visual analytics and ontologies. To elaborate, this approach is focused on:
Building a framework for an automated multidimensional ranking approach of a specific knowledge domain, structuring the data based on an ontology and assisting the decision making process with visual analytics. The specific domains that this approach was concentrated were the academia and the world development indicators.
The introduction of domain specific information to a semantic web information system.
A specific data flow, which the information should follow in order to be input in the system, formatted in a specific manner with the use of ontologies, processed by the MCDM algorithm, presented in the interface and in the visual analytics and finally be output from the information system.
1.8 Prospective Benefits
The benefit that may derive from this thesis is the exploration of the intersection of Decision Support, Visual Analytics and Semantic Web, which has not been considered yet. Apart from the conjunction of the various fields into a single one, other advantages may arise from this attempt, such as an enhanced solution for the multidimensional ranking, in terms of time, effort and user experience.
1.9 Thesis organization
The thesis is organized as follows: First, we review the state of the art of the relevant areas in Chapter 2, including the visual analytics, the decision making systems and more specifically the MCDM systems and the Semantic Web.
We describe the methodology of our approach in the 3rd Chapter, by presenting
the related stages of the methodology and providing case studies, in which the proposed methodology can be utilized.
In Chapter 4, which corresponds to the prototype system implementation, we define all the components of our prototype system and we showcase our two case studies. The first case study concerns the application field of research and education in Linked Open Data, while the other regards the world development indicators in Linked Open Data setting.
In Chapter 5, we discuss the conclusions and perspectives of our research regarding the contributions, the main findings, the interpretation of the research and the results, as well as the implications of our methodology. Additionally, the recommendations for future work are also presented.
Finally, Appendix 1 provides the required background of academic ontologies.
1.10 Summary and conclusion
The Multidimensional Ontology Based Visual Ranking (MOBVR) framework aims to exploit the benefits that the research areas of visual analytics and ontologies introduce in the multiple criteria decision making. In the following chapters we will thoroughly describe the problem statement, the literature review, the methodology, the results and the consequences of our research.
Chapter 2 .
Literature overview
2.1 IntroductionAs mentioned before, this thesis is concentrated on multidimensional ranking based on a MCDM method that is assisted by visual analytics and semantic web technologies to support the decision-making process. The second chapter presents all the necessary background information of all the main thematic areas that the thesis deals with. More specifically, it provides a thorough description of the background information of decision making – especially when multiple criteria are involved, visual analytics and semantic web, as well as background information about their combination according to the literature.
2.2 Structure
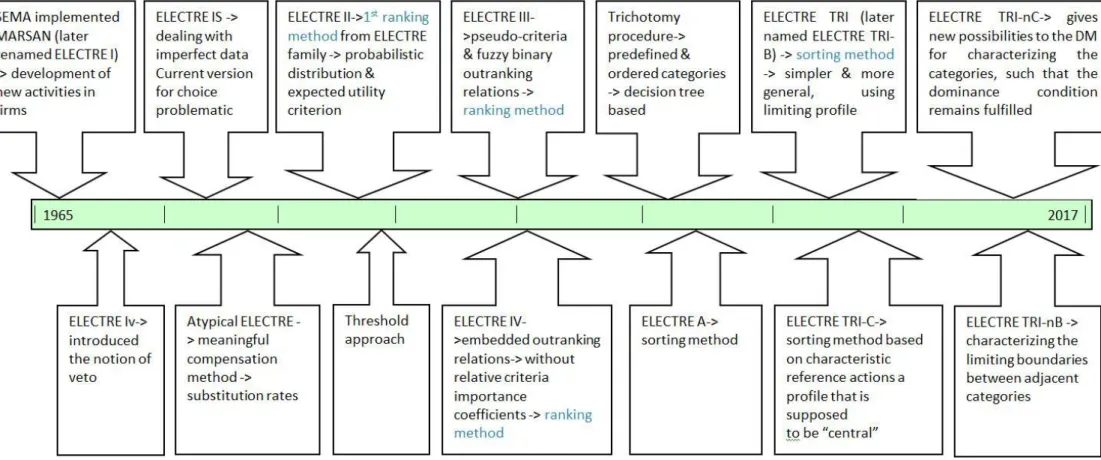
The remaining sections of the second chapter are structured as follows: firstly the scientific area of decision making is presented, along with the definitions of the important terms of the area and the literature review of decision making, followed by the description of the multiple criteria decision making, the definitions of its important terms and its literature review. In the MCDM subsection, an overview of the outranking methods and with a focus on the methods of the ELECTRE family is presented. Subsequently, a thorough description of the ELECTRE III method, the specific terms used in this method and the algorithm of the ELECTRE III are available.
In section 2.4, the scientific area of visual analytics is described. In the aforementioned section, the history of the visual analytics is referred, followed by a comparison between visual analytics and visualizations. Then, the term of interactive visualizations is described and the visual analytics process is demonstrated, while the utilization of the visual analytics in the presentation of multidimensional dataset is explored. The human cognition and perception and its connection with visual analytics is also introduced.
Section 2.5 provides an analysis of the semantic web and its constituents. Terms such as ontologies, linked data and linked open data are described also in this section, followed by the presentation of the semantic organization of the data.
In the Section 2.6, the literature review of the combination of the involved scientific areas is introduced. First, the literature review of the combination of the decision-making methods and ontologies is presented, which is divided to combination of the ontologies with decision making methods or with multiple criteria decision making. In these cases, the ontologies can be used as a source of information, or they can facilitate the reasoning mechanisms. Then, a literature review of the multifaceted MCDM ranking methods is provided. The available approaches that involve MCDM methods on the field of academic ranking are then explored. Furthermore, the combination of decision making methods and visual analytics are then presented. Following, the literature review on the synergy of visual analytics and ontologies is explicated. Finally, the summary and conclusion of the literature review is outlined.
2.3 Decision support
Decision making refers to the identification and selection between alternatives according their values, as well as the decision maker’s preferences. Decision making is the process that involves selection among two or more alternatives towards one or more goals [8, 24]. It is based on the scientific areas of Operations Research (OR) or Management Science (MS), which relied on mathematical modeling to provide solutions to real world problems by representing them with models [24], and Management Information Systems (MIS), which is focused on designing, implementing and providing computer-based systems to managers to accommodate administrative and management activities [180].
The phases of the decision-making process include: i) the intelligence phase, ii) the design phase, iii) the choice and iv) the implementation phases. The first phase denotes the identification, conceptualization and analysis of the problem, as well as the monitoring of the last phase, which is the implementation phase. The second phase, the design phase, involves the comprehension of the problem, the identification and analysis of the possible solutions and the examination of their viability. This phase also corresponds to the creation of a model of the system. In the third phase, a solution is examined, evaluated, suggested and selected for the constructed model, while in the last phase, the suggested solution is implemented.
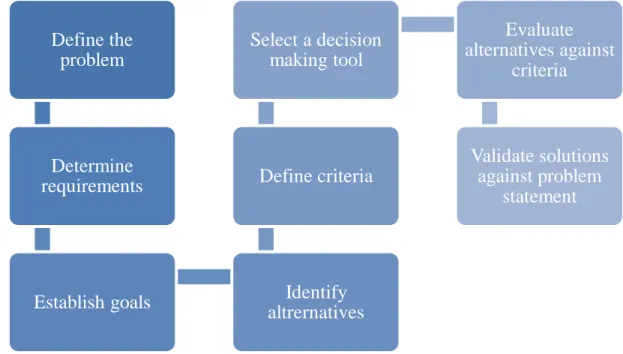
Figure 4 – Decision making process steps
Define the problem
Determine requirements
Establish goals Identify altrernatives Define criteria Select a decision making tool Evaluate alternatives against criteria Validate solutions against problem statement
According to Baker et al, 2001 [7], the steps of the decision-making process are: 1. The definition of the problem, which corresponds to the description of the problem in
an unambiguous, short-length problem statement that takes into account both initial and anticipated conditions.
2. The determination of the requirements and goals. Requirements state the conditions that a solution must meet, while goals constitute general statements of anticipated and required values that should be indicated positively.
3. The establishment of the goals.
4. The identification of the alternatives. An alternative is a way to transform the initial state into the desired one.
5. The definition of the criteria, which are independent from each other and significant for the problem. They indicate the degree in which an alternative achieves the goals. 6. The identification of the decision-making tool based on the complexity of the
problem.
7. The assessment of the alternatives against the criteria. 8. The final step of the process is the validation of solutions.
Decision support system (DSS) is a term, which describes information systems that facilitate decision-making activities and support a wide diversity of decision tasks. The history of the development of DSS commences in the mid-1960s [157]. Throughout the couple following decades, the DSS concept has evolved into a field of research [162]. DSS is defined as a computer-based information system, which involves models, analytical methods, as well as data and allows for contribution from the decision maker, to provide a solution to semi-structured and unstructured [161, 165, 166, 167, 169], or even to ill-structured problems [162]. The fundamental components of DSS architecture are: the database, knowledge base, the model and the user interface [170].
DSS can be classified in various ways. The most representative classification schemes will be presented subsequently. Holsapple and Whinston classifies DSS as follows: Text Oriented DSS, Database Oriented, Spreadsheet Oriented, Solver Oriented DSS, Rules Oriented and Compound DSS [173]. Alter classification of the DSSs has been conducted according to “the degree of action implication of system outputs” [171,
172], in the following categories: (i) file drawer systems, (ii) data analysis systems, (iii) analysis information systems, (iv) accounting models, (v) representational models, (vi) optimization models, and (vii) suggestion models. Donovan and Madnick classified DSSs as institutional, for recurring decisions, or ad hoc, for decisions that happen just once [174], whereas Hackathorn and Keen categorized DSSs in the subsequent groups: personal, group and organizational DSSs [175]. Finally, Power suggested the following broad categories: Data driven DSS, Model driven DSS, Knowledge driven DSS, Document driven DSS, Communication driven and group DSS [159].
Figure 5 – High level architecture of a Decision Support system (DSS) [24]
2.3.1 Multiple criteria decision making
Multiple Criteria Decision Making (MCDM), Multiple Criteria Decision Analysis (MCDA) or Multi-criteria Analysis (MCA) involves the selection between countable or uncountable set of alternatives, based on two or more criteria. The criteria are the standards by which something can be decided, the alternatives constitute the possible solutions of the problem at hand, while the decision space corresponds to the range of the possible decisions that are available to the decision maker and is defined as the area, in
which all the values of the variables are located, whereas the criterion outcome space is the domain formed by the related consequences of these variables [177].
The scientific area of MCDA/MCDM supports decisions in ill-structured problems with contradicting multiple criteria, goals, objectives and perspectives [176]. The systems that structure and solve these problems are called Multiple Criteria Decision Support Systems (MCDSS) [3]. In MCDM, there is not an optimal or unambiguous solution, since different aims generate different recommendations [176]. Based on the existence of trade-offs, MCDM methods can be distinguished in compensatory, which implies the existence of tradeoffs, or non-compensatory, in which there are no counterweights [179]. Multiple criteria decision-making can be also divided in two subcategories, the multiple attribute decision making (MADM) and the multiple criteria design multiple objective decision making (MODM). The former type consists of finite number of alternatives (discrete decision space), explicitly known when the solution process starts [6], while the latter comprises alternatives, which are not explicitly known (continuous decision space) and derive by mathematical models. The number of alternatives in MODM can be either infinite uncountable or extensive and countable [2]. A classification of the MADM methods can be according to the data they use. In this case, the methods can be deterministic, nondeterministic (stochastic), or fuzzy [178], whereas some problems call for combinations of the above data types (e.g. problems that involve stochastic and fuzzy data). MADM methods can be divided into single decision maker MADM and group decision making MADM methods, based on the amount of decision makers that take part in the decision-making process [178]. MCDA methods may belong in one of the following groups: value measurement models, goal, aspiration or reference level models and outranking models [181].
Roy [4] has described four possible problematics for discrete set of alternatives, described by several criteria: choice, sorting, ranking and description.
Choice, where the goal is the selection of an alternative from a set of alternatives.
Classification/sorting, in which the alternatives are organized in predefined and homogenous groups in a preference order.
Ranking that provides the alternatives in an ascending or descending order.
Description that explicates the alternatives regarding their distinguishing features.
Choice, classification/sorting and ranking problematic generate a specific evaluation result. Choice and ranking problematic are based on relative judgments in order to result to this outcome. Thus, the evaluation outcome depends on the considered set of alternatives. Classification/sorting problematic requires absolute judgments from the decision-maker.
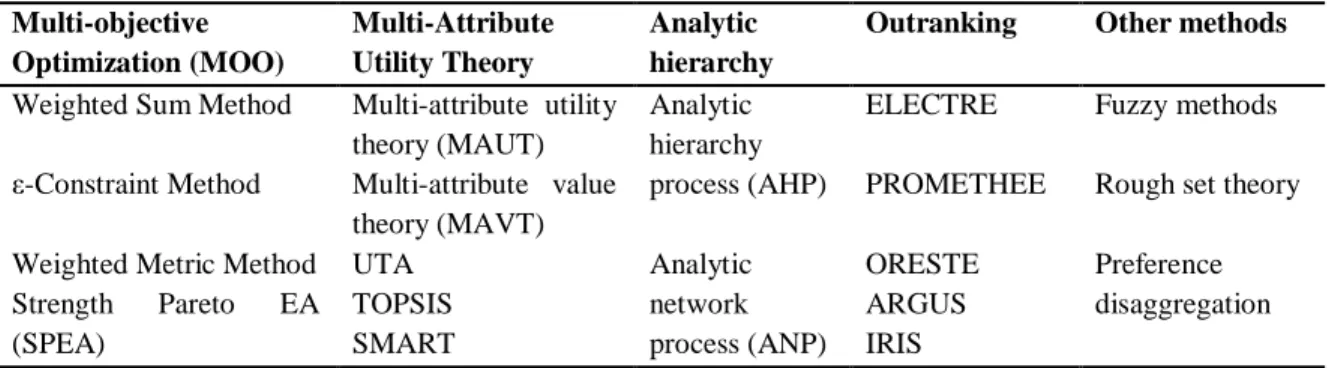
Table 1 – A classification of MCDM methods
Multi-objective Optimization (MOO) Multi-Attribute Utility Theory Analytic hierarchy
Outranking Other methods
Weighted Sum Method Multi-attribute utility theory (MAUT)
Analytic hierarchy process (AHP)
ELECTRE Fuzzy methods ε-Constraint Method Multi-attribute value
theory (MAVT)
PROMETHEE Rough set theory Weighted Metric Method UTA Analytic
network process (ANP) ORESTE Preference disaggregation Strength Pareto EA (SPEA) TOPSIS ARGUS SMART IRIS
2.3.1.1 Multi-objective Optimization (MOO)
Optimization is focused on the minimization or maximization of one or more objectives. The objectives are expressed as functions of variables. A single-objective optimization problem can be formulated as follows: min f(x), x ∈ S, where f is scalar function and S the set of constraints, for which S = {x ∈ m
: h(x) = 0,g(x) ≥ 0}. Multi-objective optimization (MOO) [194], which is also referred as criteria or multi-attribute optimization, aims to optimize two or more conflicting objectives at the same time, while taking into consideration a set of constraints. A multi-objective optimization problem can be formulated as follows: min (f1(x),f2(x),…,fn(x)), x ∈ S, where n>1 and S
objective vector belongs to the objective space, and the feasible set under F is called the attained set and is indicated with C={y ∈ n : y = f(x),x ∈ S}. A vector x∗ ∈ S is the
Pareto optimal for a multi-objective problem, if all other vectors x ∈ S have a higher value for at least one of the objective functions fi, with i = 1,...,n, or have the same value
for all the objective functions.
Multi-objective classification techniques can be classified to the following categories: a priori preference articulation, a posteriori preference articulation and progressive preference articulation [196]. The first category involves decisions before searching and comprises the methods in which the decision maker can conclude to a pre-ordering of the objectives or to an achievable goal before the search. In the second category, search takes place prior to decision making, so the involved methods do not require prior preference information from the decision maker. The third category integrates search and decision making and they are composed of three phases, i) the search of a dominated solution, ii) the feedback of the decision maker about the non-dominated solution, as well as the appropriate modifications to the preferences of the objectives, ii) the replication of the two previous steps while the decision maker is not yet satisfied with the solution or additional improvement is possible. Another way to cope with MOO problems is the application of Evolutionary Algorithms, or Multi-objective Evolutionary Algorithms (MOEAs), which can be classified to Non-Elitist MOEAs and Elitist MOEAs. Evolutionary Algorithms [197], which are based on Darwin’s survival of the fittest theory, constitute stochastic optimization processes that rely on repetitive enhancement of a population of solutions.
2.3.1.2 Multi-Attribute Utility Theory
Multi-attribute Utility Theory (MAUT) is built upon the hypothesis that decision makers want to optimize a function which aggregates all their preferences, which can be denoted by the utility function U [198]. This function is not necessarily known at the beginning of the decision process, so the decision maker needs to construct it first. In MAUT, the overall evaluation v(x) of an object x is defined as a weighted addition of its evaluation with respect to its relevant value dimensions.
∀ a, b ∈ A: a P b ⇔ U(a) > U(b) : a is preferred to b,
∀ a, b ∈ A: a I b ⇔ U(a) = U(b) : a and b are indifferent.
With utility function, the preference of the alternatives is calculated. It involves several criteria, with which the calculation of the global utility of an alternative is achieved. The utility score measures the level of well-being obtainable to the decision maker by the alternatives [199].
2.3.1.3 Analytic hierarchy
Analytic Hierarchy Process (AHP), which was developed by Saaty [200-202], deals with multiple usually contradictory and subjective criteria. In AHP, the main focus is on building the hierarchy of criteria and determining the alternatives. The AHP hierarchy structure entails the goal, the alternative courses of actions to reach the goal, and the criteria and sub-criteria on which they are evaluated [203]. The AHP process is comprised the following phases: the definition of the relative weights of the criteria and the designation of the relative rankings to the alternatives. In this approach the relative scales are resulting from pairwise comparisons [203]. The global score for each alternative is calculated by:
∑
In which a is the alternative, c is the criteria, g is the global score of the alternative, w is the criteria weight and s is the alternative score.
2.3.1.4 Outranking methods
Within the multi-criteria methods, Outranking Methods (OMs) utilize preference relations, called outranking relations, between alternatives on specific criteria to support the decision-making process and they were designed to overcome the difficulties faced by the value function approach, especially when facing practical problems or in ambiguous problems. The outranking techniques originate from the social choice theory [182].
![Figure 5 – High level architecture of a Decision Support system (DSS) [24]](https://thumb-eu.123doks.com/thumbv2/123doknet/14536766.724187/39.918.282.637.389.693/figure-high-level-architecture-decision-support-dss.webp)
![Figure 7 - Combination of visual and automatic data analysis [19]](https://thumb-eu.123doks.com/thumbv2/123doknet/14536766.724187/52.893.195.708.504.771/figure-combination-visual-automatic-data-analysis.webp)
![Figure 8 - A schematic diagram of the visualization process [27]](https://thumb-eu.123doks.com/thumbv2/123doknet/14536766.724187/54.893.155.739.377.718/figure-schematic-diagram-visualization-process.webp)
![Figure 10 - Ontology languages in the Semantic Web Architecture [34]](https://thumb-eu.123doks.com/thumbv2/123doknet/14536766.724187/60.893.179.728.346.519/figure-ontology-languages-semantic-web-architecture.webp)
![Figure 11- Classification of schema-based matching techniques [283]](https://thumb-eu.123doks.com/thumbv2/123doknet/14536766.724187/61.893.140.796.456.683/figure-classification-schema-based-matching-techniques.webp)