UNIVERSITÉ DE MONTRÉAL
SOLVENT-CAST THREE-DIMENSIONAL PRINTING OF POLYLACTIDE
MULTIFUNCTIONAL MICROSYSTEMS
SHUANGZHUANG GUO
DÉPARTEMENT DE GÉNIE MÉCANIQUE ÉCOLE POLYTECHNIQUE DE MONTRÉAL
THÈSE PRÉSENTÉE EN VUE DE L’OBTENTION DU DIPLÔME DE PHILOSOPHIAE DOCTOR
(GÉNIE MÉCANIQUE) JUIN 2014
UNIVERSITÉ DE MONTRÉAL
ÉCOLE POLYTECHNIQUE DE MONTRÉAL
Cette thèse intitulée:
SOLVENT-CAST THREE-DIMENSIONAL PRINTING OF POLYLACTIDE MULTIFUNCTIONAL MICROSYSTEMS
présentée par: GUO Shuangzhuang
en vue de l’obtention du diplôme de : Philosophiae Doctor a été dûment acceptée par le jury d’examen constitué de :
M. CARREAU Pierre, Ph.D., président
M. THERRIAULT Daniel, Ph.D., membre et directeur de recherche
Mme HEUZEY Marie-Claude, Ph.D., membre et codirectrice de recherche M. BARON Luc, Ph.D., membre
DÉDICACE
ACKNOWLEDGEMENTS
I wish to thank all those who supported me in the completion of this study or helped me in any way during my living in Canada.
First of all, I would like to express the deepest appreciation to my supervisor, Professor Daniel Therriault and Professor Marie-Claude Heuzey, who provide me with fundamental advices. I am very grateful for their continued support throughout the whole projects as well as the many interesting discussions. I am also very grateful for the things that I learnt from them; not only the scientific matters, but also lots of knowledge which are very helpful in all aspects of my life. It had been a true privilege to learn from such competent and sincere supervisors.
I would also like to send a heartfelt acknowledgment to the members of Laboratory of Multiscale Mechanics (LM2) research group who made the working place a fascinating area. My especial thanks are due to Dr. Rouhollah Dermanaki Farahani for his encouragements, advices and many things that I have learnt from him during all my study.
I like to acknowledge financial support from CSC (China Scholarship Council).
Finally, I could not have accomplished this without all the supports of my family, especially my lovely wife, Xiao-Yang. They are the driving forces behind all of my successes. To them I tribute a fervent thanks.
RÉSUMÉ
Les progrès faits en termes de microstructuration tridimensionnelle (3D) permettent la configuration d’architectures complexes, qu’elles soient faites de polymère seul ou renforcé. Ces architectures peuvent participer à l’essor de nouvelles applications technologiques ou améliorer des applications existantes.
Plusieurs stratégies et technologies ont récemment émergé pour la fabrication rapide et peu coûteuse de micro-appareils 3D faits à base de polymères thermoplastiques. La déposition par fusion ou « fused deposition modeling » est la méthode la plus populaire pour la fabrication de produits 3D à base de thermoplastiques. Par contre, la dégradation thermomécanique causée par les hautes températures du procédé de déposition et par la haute viscosité de la plupart des polymères fondus peut rendre difficile l’application de cette méthode aux nanocomposites. En effet, les nanoparticules augmentent de façon significative la viscosité du matériau. Bien que le procédé d’électro-filage ou « electrospinnig » ait été utilisé pour produire des structures polymériques diverses, la complexité des structures 3D obtenues est relativement limitée. L’objectif général de cette thèse est le développement d’une technique de fabrication permettant d’élaborer des structures 3D à base de matériaux nanocomposites constitués d’un polymère thermoplastique, le polylactide (PLA), et de nanotubes de carbone multi-parois.
Cette thèse présente le développement d’une méthode de fabrication par écriture directe qui étend significativement les possibilités offertes par la microfabrication de structures 3D en nanocomposites thermoplastiques. Cette méthode commence par la déposition robotisée d’un filament de polymère dissout dans un solvant par micro-extrusion. L’évaporation rapide du solvant permet la solidification directe du filament extrudé. On peut donc donner à celui-ci des formes complexes en 3D comme par exemple des filaments, des tours, des échafaudages ou des spirales à forme libre. De plus, cette technique par évaporation de solvant a été démontrée comme étant abordable, hautement flexible et robuste pour la fabrication de microsystèmes dont des fibres microstructurées à haute ténacité, des canaux microfluidiques ou des micro-antennes.
Nous avons également caractérisé le procédé en utilisant des solutions de PLA pour analyser l’écoulement des solutions, la cinétique d’évaporation du solvant et les effets des paramètres du procédé sur la cristallisation des filaments extrudés. La rhéologie rotationnelle montre un comportement presque Newtonien des solutions de PLA pour des taux de cisaillement faibles ou modérés. Pour des taux de cisaillement plus élevés, des analyses d’écoulement capillaire montrent un comportement rhéofluidifiant. Les essais d’évaporation de solvant suggèrent que la diffusion de ce dernier à l’intérieur du filament est le facteur dominant du retrait de solvant du polymère. Avec l’augmentation de la complexité géométriques des microstructures déposées allant d’un filament 1D, un réseau de fibres 2D jusqu’à un échafaudage 3D et une spirale à forme libre, le filament imprimé doit se solidifier de plus en plus rapidement. C’est pourquoi une cartographie des paramètres du procédé de fabrication a été définie. Celle-ci démontre que la plage utile des paramètres devient de plus en plus restreinte avec l’augmentation de la complexité géométrique. Les résultats de calorimétrie différentielle à balayage ont aussi montré que l’évaporation plus lente du solvant augmente la propension du PLA à compléter sa cristallisation pendant la phase de séchage, ce qui peut être souhaitable dans certains cas.
Des nanocomposites composés de PLA renforcés de nanotubes de carbone multi-parois ont été préparés en combinant des mélanges à l’état fondu et en solution. Les solutions de PLA/nanotubes ont démontré un comportement rhéofluidifiant. L’amplitude de leur viscosité a été affectée par la présence de nanotubes lorsque les taux de chargement étaient supérieurs à 1 % par unité de poids. La viscosité apparente était 40% supérieure à celle du PLA lorsque le taux de charges atteignait 5 % en poids.
Finalement, des structures nanocomposites 3D multifonctionnelles à forme libre ont été imprimées grâce à la technique développée dans cette thèse. Leurs fonctionnalités ont été examinées dans le cadre d’une application d’un détecteur de liquide testé à l’aide de quatre solvants organiques (i.e., acétone, toluène, éthyle acétate et l’éthanol). L’augmentation de surface de contact induite par la géométrie hélicoïdale du détecteur de liquide a permis une excellente
sensibilité et sélectivité, même pour des temps d’immersion très courts. Lors de ces essais, la sensibilité était principalement gouvernée par la combinaison du paramètre d’interaction polymère/solvant et par la pression de vapeur du solvant. Les essais lors de longues immersions ont aussi démontré que la sensibilité du détecteur était principalement fonction du paramètre d’interaction polymère/solvant.
La technique d’impression 3D par évaporation de solvant développée dans cette thèse ouvre de nouvelles perspectives pour la création de microstructures 3D multifonctionnelles pouvant trouver de nombreuses applications dans des micro et nano systèmes pour des mesures de précision, dans la détection de polluants, la fabrication d’échafaudages pour la croissance tissulaire ou dans le contrôle à distance d’appareils autonomes.
ABSTRACT
Three-dimensional (3D) structures fabricated from polymers and their nanocomposites may find widespread technological applications which either require, or could benefit from, the ability to pattern micro-sized features in complex 3D architectures. Several strategies and technologies have recently emerged to rapidly and cost-effectively fabricate thermoplastic polymer-based 3D microdevices. Fused deposition modeling (FDM) stands out as the most popular procedure to manufacture 3D products. However, the thermal degradation caused by high processing temperatures and the high viscosity of most polymer melts may prevent the application of this technique to functional nanocomposite devices, since nanoparticles can significantly increase material viscosity. Also, electrospinning has been used to produce fiber-based polymer structures but is limited in terms of 3D structure complexity. The overall objective of this thesis is the development of a manufacturing technique allowing the fabrication of 3D structures of thermoplastic polymers and their nanocomposites.
This thesis reports the development of a direct-write fabrication technique that greatly extends the fabrication space for 3D thermoplastic nanocomposite structures. The solvent-cast 3D printing of microstructures uses a thermoplastic polymer or its nanocomposite solution as the ink. The method employs the robotically-controlled micro-extrusion of a filament combined with a rapid solvent evaporation. Upon drying, the increased rigidity of the extruded filament enables the creation of complex 3D shapes such as filaments, towers, scaffolds and freeform spirals. For a typical circular spiral, the average coil diameter was 966 ± 6 μm and the average pitch was 530 ± 25 μm. Both values were very close to the programmed deposition path (i.e., coil diameter of 1.0 mm, pitch of 500 μm). The layer-by-layer scaffold and the micro-cup were almost identical to their respective programmed deposition paths because the printing layer was supported by the underlying layer. The main limitation remains the freeform deposition of sharp turns which lead to some geometric discrepancies. Furthermore, the solvent-cast printing technique has been demonstrated to be a low-cost, highly flexible and powerful fabrication route of microsystems
including high-toughness microstructured fibers, microfluidic channels, and micro antennas. We performed a comprehensive characterization of the process using PLA solutions by analyzing the flow behavior of the solutions, the solvent evaporation kinetics and the effects of process-related parameters on the crystallization of the extruded filaments. Rotational rheometry at low to moderate shear rates showed a nearly Newtonian behavior of the PLA solutions, while capillary flow analysis based on process-related data indicated shear-thinning at higher shear rates. Solvent vaporization tests suggested that the internal diffusion of the solvent through the filaments controlled the solvent removal of the extrudates. As the fabrication complexity of micro geometries evolves from one-dimensional (1D) filament, two-dimensional (2D) fiber array to 3D scaffold and freeform spiral, the rigidity of the filament needs to increase faster as well. Thus the processing map, which has been defined, gets narrower for the most complex geometries. The results of differential scanning calorimetry also revealed that slow solvent evaporation could increase the ability of PLA to complete its crystallization process during the filament drying stage.
Subsequently, PLA/MWCNT composite solutions were prepared using a combination of melt mixing and solution processes. The inks of PLA/MWCNT solutions exhibited shear-thinning, and the magnitude of the apparent viscosity was affected by the presence of the nanoparticles for MWCNT loadings of 1 wt% and above. The process-related viscosity of the ink with 5 wt% MWCNT loading was 40% higher than that of the neat PLA ink.
Finally, 3D multifunctional helical liquid sensors were fabricated using the solvent-cast printing technique with PLA nanocomposite solutions as inks. The performance of these sensors was examined in four different organic solvents (i.e. acetone, toluene, ethyl acetate, and ethanol). The structural feature of liquid trapping prompted the helical-shaped liquid sensor with excellent sensitivity and selectivity, even for very short immersion time in the solvent, where the sensing response was governed by a combination of the polymer/solvent interaction parameter and the solvent vapor pressure. In addition, it was found that the sensing ability of the helix was mainly determined by the polymer/solvent interaction parameter in long immersion tests.
The solvent-cast 3D printing manufacturing technique demonstrated here open new prospects for the fabrication of 3D multifunctional microstructures that could find applications in micro- and nanoscale systems such as precision measurements, pollutants detection in natural environments, tissue engineering scaffolds and remote-controlled smart devices.
TABLE OF CONTENT
DÉDICACE ... iii ACKNOWLEDGEMENTS ... iv RÉSUMÉ ... v ABSTRACT ... viii TABLE OF CONTENT... xiLIST OF TABLES ... xiv
LIST OF FIGURES ... xv
LIST OF APPENDICES ... xx
INTRODUCTION ... 1
CHAPTER 1: Literature Review ... 3
1.1 Polylactide ... 3
1.1.1 Thermal properties of polylactide ... 4
1.1.2 Thermal degradation and biodegradation of polylactide ... 4
1.1.3 Rheological properties of polylactide ... 5
1.1.4 Crystallization behavior of polylactide ... 6
1.1.5 Interaction of polylactide with solvents ... 7
1.2 Electrically conductive thermoplastic nanocomposites ... 9
1.2.1 Fundamentals of electrically conductive nanocomposites ... 9
1.2.2 Effect of filler type ... 13
1.2.4 Effect of processing method ... 16
1.3 Fabrication of 3D nanocomposite microstructures ... 19
1.3.1 Microfabrication techniques ... 19
1.3.2 Direct-write technique ... 20
1.4 CNT-based nanocomposites for sensing applications... 22
1.5 Summary of literature review ... 27
CHAPTER 2: Research Objectives and Coherence of Articles ... 28
2.1 Research objectives ... 28
2.2 Presentation of articles and coherence with research objectives ... 28
CHAPTER 3: Article 1: Solvent-Cast Three-Dimensional Printing of Multifunctional Microsystems ... 31
3.1 Abstract ... 31
3.2 Main text ... 31
3.3 Experimental section ... 39
3.4 Supporting information: ... 44
CHAPTER 4: Article 2: Properties of Polylactide Inks for Solvent-Cast Printing of Three-Dimensional Freeform Microstructures ... 47
4.1 Abstract ... 47
4.2 Introduction ... 47
4.3 Experimental section ... 49
4.4 Results and discussion ... 52
CHAPTER 5: Article 3: 3D Printing of Multifunctional Nanocomposite Helical Liquid Sensor
... 70
5.1 Abstract ... 70
5.2 Main text ... 70
5.3 Experimental section ... 78
CHAPTER 6: General Discussion ... 83
6.1 3D printing of thermoplastic polymers ... 83
6.2 Multifunctional nanocomposites microstructures and their applications ... 85
CHAPTER 7: Conclusions and Recommendations ... 88
7.1 Conclusions ... 88
7.2 Recommendations ... 89
REFERENCES ... 91
LIST OF TABLES
Table 1.1 Physical and mechanical properties of selected thermoplastic polymers [25]. ... 3 Table 1.2 Summary of experimental parameters and properties of different polymer composites. ... 10 Table 1.3 Typical properties of 1D conductive nanofillers ... 15 Table 4.1 DSC results of solvent-cast PLA filament crystallization ... 52 Table 4.2 Parameter values of the Carreau-Yasuda model fit for the PLA solutions (data from Figure 4.3). ... 56 Table 5.1 Characteristics of PLA and solvents used for sensing experiments.[29] ... 74
LIST OF FIGURES
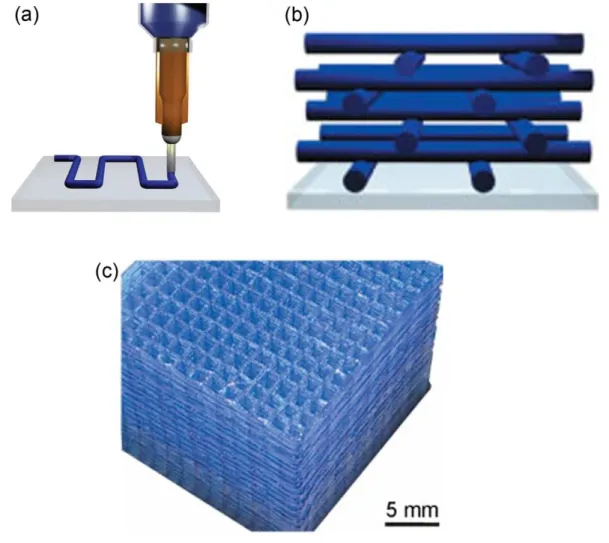
Figure 1.1 Solubility window of PLA in various organic solvents in the Hansen space. Solvent type: polar aprotic (◈), polar protic and non polar (×) [46]. ... 7 Figure 1.2 Relationship between swelling and total Hansen solubility parameter 𝛿𝑡. Organic solvent: alcohol (●), paraffin (■), aromatic hydrocarbon (▢), ester (◆), ether (▼), chloride (◈), ketone (□), amine (△), and others (◇) [46]. ... 8 Figure 1.3 Schematic sketches showing the effect of a 1D filler on the conductivity of polymer composite. (a) No conductivity. Bad distribution and dispersion, (b) No conductivity. Good distribution; Bad dispersion, (c) Conductivity. Bad distribution; Good dispersion, (d) No conductivity. Good distribution and dispersion [57]. ... 12 Figure 1.4 Conceptual diagram of SWCNT (a) and MWCNT (b) [77]. ... 14 Figure 1.5 Photograph of DSM 5 mL micro-compounder. ... 17 Figure 1.6 Schematic illustration of the fabrication of a 3D scaffold by the direct-write method: (a) deposition of fugitive ink; (b) ink layers after deposition; (c) optical image of a 104-layer scaffold assembled from the binary organic ink deposited through a 200 μm nozzle [10]. ... 20 Figure 1.7 Schematic illustration of a direct-write assembly module for thermoplastic polymers [122]. ... 21 Figure 1.8 Perspective views of 3D scaffolds made by the ink-fused direct-write technique: (a) and (c) are optical microscopy images, (b) and (d) are SEM images [122]. ... 22 Figure 1.9 Different sensory CPC designs and CNT arrangements. (a) Partially embedded CNTs in polymer, (b) a polymer substrate covered with CNTs, and (c) full embedded CNTs in polymer. (d) Possible sensory CPC shapes (fibers, compression-molded plate, cylinder, and £2 coin for size comparison) [128]. ... 23
Figure 1.10 Development of the skin-core morphology of a liquid sensor contacting with ―good‖ solvents, showing (blue) the swollen skin and (brown) the dry core, with altered and original composite properties, respectively [128]. ... 24 Figure 1.11 The CPC’s solubility sphere with 44 ―good‖ solvents (green dots), 15 ―bad‖ solvents (red dots) and the sphere’s center point representing the CPC (small blue dot) [132]. ... ... 25 Figure 1.12 Selectivity of the CPC enabling the mapping of ―good‖ and ―bad‖ solvents depending on their molar volume and distance in Hansen solubility space [132]. ... 26 Figure 3.1 Schematic representation of the SC-DW process with a thermoplastic solution. a) Deposition of the polymer solution through a micronozzle. b) Rapid solvent evaporation post extrusion. c) Example of a 3-D square spiral fabricated by the SC-DW assembly. ... 32 Figure 3.2 SC-DW ink characterization. a) Process-related apparent viscosity. b) Solvent content as a function of time for different polymer concentrations. ... 34 Figure 3.3 Microstructures manufactured by SC-DW. (a) Top and side view virtual images of the programmed SC-DW fabrication of the square spiral. (b) Top and side view SEM images of an actual PLA square spiral. (c) Inclined top view SEM image of a PLA circular spiral. (d) Representative optical image of a PLA scaffold composed of nine layers. (e) Inclined top view SEM image of PLA 9-layer scaffold. (f) SEM image of a PLA cup. ... 35 Figure 3.4 Representative SEM images of a) straight PLA fiber and its circular cross section, b) microstructured PLA fiber with sacrificial bonds, and c) stretched microstructured fiber. d) Tensile properties comparison for a straight fiber (dash line) and a microstructured fiber (solid line). e) Fluorescent microscopy top and side view images of a fluid-filled spiral microchannel embedded inside an epoxy matrix. f) Optical side, top and
cross-sectional view images of the copper coated 3-D variable pitch spiral antenna. g) Measured current upon voltage application between two ends of the 3-D spiral antenna. ... 37 Figure 3.5 Instability assisted microfabrication by solvent-cast direct write with (a) 100 μm diameter needle; (b) 30 μm diameter glass capillary. During the microfabrication process, only the substrate moves in a straight line. The liquid rope coiling instability gives rise to various patterns. As the solvent evaporates, it leaves behind a solidified microstructured fiber. ... 45 Figure 3.6 Empty channel in epoxy left after the catalytic depolymerization of PLA using Tin(II) Oxalate as a catalyst in an vacuum oven at a temperature of 200 °C and an absolute pressure of 0.1 inHg for 48 h. ... 46 Figure 4.1 Schematic of the solvent-cast printing process and the main process parameters. ... 49 Figure 4.2 Raw data of the capillary flow experiments: volumetric flow rate as a function of the applied pressure for (a) three PLA solutions (20, 25, and 30 wt%) deposited using a 200 μm nozzle and (b) a 25 wt% PLA solution deposited using three different nozzle diameters (100, 200, and 330 μm). ... 53 Figure 4.3 Viscosity as a function of shear rate for three PLA solutions. (open symbols: data obtained using a concentric cylinder flow geometry in steady simple shear, solid symbols: data obtained by extrusion of the PLA solutions with a 200 μm nozzle in capillary flow analysis, dashed lines: fits of Carreau-Yasuda model with parameters of the fit given in Table 4.2). ... 54 Figure 4.4 Average extrusion velocity as a function of applied pressure for (a) different PLA solutions (20, 25 and 30 wt%) deposited using a 200 μm nozzle, and (b) a 25 wt% PLA solution deposited using three different nozzle diameters (100, 200 and 330 μm) (data from Figure 4.2). ... 56
Figure 4.5 Normalized solvent content as a function of time for (a) three 5 mm long PLA filaments deposited using a 510 μm nozzle under 0.42 MPa applied pressure and 1 mm s-1
robot velocity and (b) 20 wt% PLA solution deposited using three different nozzles under 0.42 MPa applied pressure and 1 mm s-1 robot velocity for 5 s. ... 58 Figure 4.6 Solvent-cast printing processing map showing the parameter ranges for different microstructures fabrication. I: zone for 1D filament, II: zone for 2D filament array or 3D layer-by-layer structure; III: zone for 3D freeform geometry; IV: zone where filaments break; V: zone where PLA is not dissolvable; VI: zone where PLA solutions are too dilute for the process. The letters a-f represent the fabrication parameters of different geometries shown in Figure 4.7. ... 59 Figure 4.7 Morphology of various printed microstructures. (a) Representative SEM image of the PLA filament circular cross section. (b) Representative SEM image of the filament smooth surface. (c) Inclined top view SEM image of PLA 9-layer scaffold. (d) SEM image of a PLA circular tower. (e) SEM image of a PLA square tower. (f) Inclined top view SEM image of a PLA circular spiral. ... 60 Figure 4.8 DSC thermogram of PLA filaments obtained at a heating rate of 10ºC min-1 for different printing parameters: (a) PLA content, (b) applied pressure, (c) nozzle diameter, and (d) robot velocity. ... 62 Figure 4.9 Effects of different printing parameters: (a) PLA content in solution, (b) applied pressure,
(c) nozzle diameter, and (d) robot velocity on the crystallinity of PLA filaments. The data and process parameters are listed in Table 4.1. ... 63 Figure 5.1 (a) Schematic representation of the solvent-cast 3D printing of nanocomposite microstructures. Schematic circuits of the liquid sensing test for (b) the straight line sensor and (c) the 3D helical sensor. (d) Process-related apparent viscosity of PLA nanocomposite solutions (typical processing window used in this work is shown by the
dashed box). ... 71 Figure 5.2 (a) Inclined side view SEM image of the nanocomposite helix. (b) Electrical conductivity of PLA nanocomposite as a function of MWCNT loading. The dashed line is a power-law expression fit[27] and the inset is a top view SEM image of the nanocomposite helix. (c) Measured current upon applied voltage between two ends of the 3D helical sensor. (d) Optical image of two helical sensors mechanically supporting and electrically sourcing a luminous LED bulb. ... 73 Figure 5.3 (a) Fluorescent microscopy side view image of a straight line sensor with liquid on its surface. (b) Solvent content as a function of time for the straight line sensor during drying process. (c) Fluorescent microscopy side view image of the liquid trapped in a 3D helical sensor. (d) Solvent content as a function of time for the 3D helical sensor during drying process (inset is a top view image of the helical sensor with fluorescent liquid trapped). ... 75 Figure 5.4 Relative electrical resistance change of (a) the straight line and (b) 3D helical sensors at short immersion cycles of (1 s) / drying (600 s) with four solvents. (c) Effect of vapor pressure and Flory-Huggins interaction parameter on the maximum relative resistance change of the helical sensor in short immersion tests. (d) Relative electrical resistance change of a 3D helical sensor during long immersion cycles of (120 s) / drying (600 s) in four solvents. ... 77 Figure 6.1(a) A typical commercial 3D printer. Examples of printed models (a) famous buildings in France (c) a horse, and (d) a hand ring [141]. ... 84 Figure 6.2 Comparison of the process-related apparent viscosity for pristine and processed PLA solutions. ... 86
LIST OF APPENDICES
INTRODUCTION
Background and problematic
There has been a lot of interest in the development of conductive polymer nanocomposites (CPN) where conductive nanoparticles are dispersed within insulating polymer matrices to generate a new kind of advanced materials [1-3]. After being first reported by Iijima in 1991[4], carbon nanotubes (CNT) were investigated as fillers for CPN because of their great properties, lightweight and that the relatively low percolation threshold that can be achieved due to their high aspect ratio. Also the CPN can exhibit multifunctional properties such as high mechanical strength and stiffness, along with thermal and electrical conductivity at relatively low CNT loadings, which make them suitable for a broad range of potential applications such as sensors [5], actuators [6], electromagnetic interference shielding [7], as well as energy and gas storage [8].
These applications either require, or could benefit from, the ability to pattern micro-sized features in complex three-dimensional (3D) architectures. Direct-write (DW) assembly is a 3D printing technique that employs a computer-controlled translation stage, which moves an ink-deposition nozzle, to create materials with prescribed 3D architecture and composition [9]. Many ink materials have been employed such as organic fugitive inks [10], concentrated polyelectrolyte complexes [11], colloidal suspensions [12-14], hydrogels [15, 16] and thermoset polymers [17]. These inks solidify through different mechanisms such as viscoelastic recoil [10], coagulation in reservoir [11], suppression of repulsive forces [12], and UV polymerization [15-17].
As a thermoplastic polymer, polylactide (PLA) is one of the most popular bio-based materials because it is widely available commercially, biodegradable, biocompatible and has a relative high-strength, high-modulus and good processability [18]. Several strategies and technologies using PLA to fabricate microscale 3D geometries have been developed. For example, a fused deposition modeling (FDM) method can elaborate PLA solid objects due to the material rigidity increase after the temperature-triggered phase transition from molten to solid state [19]. However this method exhibits limited precision of the printed features, and the high viscosity and/or thermal degradation at high temperature of the PLA melt may restrict this approach. In addition, two other methods including surface tension driven direct-write [20] and soft lithographic approaches [21] were reported to fabricate 3D PLA scaffolds for tissue
engineering. However, these techniques were unable to build complex or freeform 3D structures. Thus, new fabrication methods of multifunctional microstructures using thermoplastic polymers and their nanocomposites would foster larger utilization of their based materials in potential applications.
Organization of the thesis
This thesis is based on three articles that have been published or submitted to scientific journals and comprises the following sections:
Chapter 1 provides a critical literature survey of PLA properties, factors in the preparation of electrically conductive nanocomposites, the various microfabrication techniques, and the CPN used as liquid sensors. Research objectives and the coherence between the specific objectives and the three articles are described in Chapter 2. The main achievements of the thesis are given in the format of three peer reviewed scientific papers in Chapter 3, 4, and 5. Chapter 2 (Article 1) reports on the fabrication of microstructures using the solvent-cast 3D printing method and PLA solutions as the inks. This article mainly focuses on demonstrating the new 3D printing technique to be low-cost, highly flexible and powerful fabrication route by different microsystems including high-toughness microstructured fibers, microfluidic channels, and micro antennas. Chapter 4 (Article 2) deals with the effects of process-related parameters (i.e., applied pressure, nozzle diameter and robot velocity) and material-related parameters (i.e., PLA content, rheology, solvent evaporation) on the processability and the crystallinity of the fabricated filaments. In Chapter 5 (Article 3), PLA/MWCNT nanocomposites have been developed and used to fabricate multifunctional 3D helical liquid sensors. Finally, a general discussion of the main results is presented in Chapter 6, while conclusions and recommendations are stated in Chapter 7.
CHAPTER 1: Literature Review
A multifunctional material is a composite that simultaneously perform (a) multiple structural functions, (b) combined non-structural and structural functions, or (c) both [22]. Structural functions include mechanical properties like strength, stiffness, fracture toughness, and damping. Non-structural functions include electrical and/or thermal conductivity, sensing and actuation, energy harvesting/storage, self-healing capability, electromagnetic interference (EMI) shielding, recyclability and biodegradability [23]. Nanocomposite materials, defined as multiphase materials that incorporate nanosized fillers into a polymer matrix, have drawn specific interest in the development of multifunctional material systems due to their unique mechanical, thermal and electrical properties [24].
Before processing the nanocomposites in their potential applications, it is important to have a basic understanding of the properties of polymer matrix, which is polylactide (PLA) in this project. Then the factors including nanofiller type, polymer matrix and processing method for the preparation of electrically conductive nanocomposite are discussed. Afterwards, the manufacturing techniques for the fabrication of 3D microdevices for different applications are reviewed. Finally, a literature survey concerning the utilization of nanocomposites for sensor applications is discussed.
1.1 Polylactide
Table 1.1 Physical and mechanical properties of selected thermoplastic polymers [25].
Properties PLA PET PP PS PEEK
Density (g cm-3) 1.25 1.37 0.9 1.05 1.32
Young's modulus (MPa) 350-2800 2800–
3100 1100-1550 3000-3500 3600
Tensile strength (MPa) 10-60 55–75 30-38 32-60 90-100
Elastic limit (%) 1.5-380 50–150 200-700 2.8-4 50 Glass temperature (°C) 60-65 75 -10 80-98 143 Melting point (°C) 173-178 254 165 - 343 Thermal Conductivity (W mK-1) 0.13 0.24 0.12-0.22 0.14-0.16 0.25 Water absorption (%) 0.5-50 0.16 0.01 0.1 0.5
and sugar) and viewed as a promising material to reduce solid waste disposal. Moreover, PLA has relatively high mechanical properties when compared to other thermoplastic polymers (Table 1.1) and is considered as a good candidate material for food packaging and for other consumer products [26].
PLA is formed either by direct condensation of lactic acid or via the cyclic intermediate dimer (lactide), through a ring opening process [18]. Lactic acid is simple chiral molecule which exists as two optical isomers, L- and D-lactic acid. The majority of lactic acid from biological sources exists as L-isomer. It is possible to control the ratio and sequence of L- and D-lactic acid units in the final polymer by controlling residence time and temperature in combination with catalyst type and concentration in the polymerization process [27].
1.1.1 Thermal properties of polylactide
As a thermoplastic polymer, semicrystalline PLA exhibits a glass transition (Tg) and melting
temperature (Tm). The Tg of PLA varies according to the molecular weight (Mn) and the optical purity (OP, the fraction of the isomer sequences in the whole molecular chain) of the polymer. Lim et al. found that the Tg increases with molecular weight, and at infinite molecular weight
reaches maximum values of 60.2, 56.4 and 54.6 °C for PLA consisting of 100, 80, and 50 %
L-stereoisomer contents, respectively [28]. However, Ahmed et al. reported that optically pure
polylactide, poly(L-lactide) (PLLA) and poly(D-lactide) (PDLA), are crystalline polymers with
Tg ~ 66 °C, while the atactic polymer, poly-(DL-lactide) is an amorphous material (occurring
about when OP < 0.78) with a glass transition temperature of 50-57 °C [29].
Typical Tm values for PLA range between 130 and 160 °C, and are also a function of its OP.
The maximum practical obtainable Tm for stereochemically pure PLA is around 180 °C, with an
enthalpy of 40-50 J g-1. As the OP decreases, the Tm decreases by as much as 50 °C [28]. Besides,
it was reported that the Tm and enthalpy of crystal fusion of PLLA increased as Mn increased from
1100 to 27500 g mol-1 [29].
1.1.2 Thermal degradation and biodegradation of polylactide
PLA has a tendency to undergo thermal degradation in the molten state, which can be due to several reasons such as (a) hydrolysis by trace amounts of water, (b) zipper-like depolymerization, (c) oxidative, random main-chain scission, and (d) intermolecular transesterification to monomer
and oligomeric esters [30]. PLA is a hygroscopic polymer where amorphous parts of the polymer tend to absorb much more water than that of crystalline phase [31]. Rheological measurements showed that the thermal degradation of PLA is accelerated when the moisture content of the polymer increased and optimal drying conditions are required to reduce the thermal degradation during melt mixing [32].
In the presence of catalyst during thermal degradation, PLA will undergo a zipper-like depolymerization [32]. The catalysts promote the cleavage of ester bonds in the polymer backbone, facilitating the fragmented polymer ends to undergo chain backbiting and thus depolymerization. The effects of the catalyst type and concentration on the degradation has been reported [33].
PLA biodegradation has been found to be dependent of a range of factors such as molecular weight, crystallinity, purity, temperature, pH, presence of terminal carboxyl or hydroxyl groups, water permeability, and additives acting catalytically that may include enzymes, bacteria or inorganic fillers [34]. However, PLA biodegradation is relatively slow in most cases, and the loss of strength is usually observed after several weeks, with complete biodegradation often taking years [35]. Acceleration of hydrolytic degradation may be achieved in several ways including high degradation temperatures, high acidity degradation media, and catalysts [30].
1.1.3 Rheological properties of polylactide
Rheological properties are used to evaluate the behavior of thermoplastics during processing operations. Intrinsic factors affecting the flow characteristics of PLA are molecular weight and distribution, degree and type of branching (though commercial PLA grades are mostly linear), optical composition, optical block length distributions, and melt stability.
Melt rheological properties of PLA are highly dependent on temperature, molecular weight and shear rate. Melt viscosity of high-molecular-weight PLAs is in the order of 500-1000 Pa·s at shear rates of 10-50 s-1 [36]. As shear rates increase, the viscosity of the melt decreases considerably and the polymer melt exhibits a shear-thinning behavior. However, low molecular weight PLA (~40,000 g mol-1) shows Newtonian-like behavior at shear rates typical of film extrusion [37]. The zero shear viscosity, (η0), for linear PLA is found to roughly scale with the
and shear thinning increased with the addition of branched PLA. For both linear and branched PLA, the shear viscosity decreases as the temperature increases [40].
Most of the researches about the rheological properties of PLA dissolved in solvents focus on the intrinsic viscosity ([η]) of dilute solution, which is frequently evaluated to determine the molecular weight, chain flexibility, and defining solvent quality. The relationship between viscosity and molecular weight of PLA in dilute solution is commonly modeled using the Mark-Houwink equation:
[𝜂] = 𝐾 × 𝑀𝑣𝑎 (1.1)
where [η] is the intrinsic viscosity, K and a are constant values, and Mv is the experimental
viscosity-average molecular weight. The Mark-Houwink equation is dependent on the type of PLA, the solvent used, and the temperature of the solution [28].
1.1.4 Crystallization behavior of polylactide
The physical, mechanical and barrier properties of PLA are dependent on the solid-state morphology and crystallinity. Essentially, the crystallization behavior of PLA depends on the thermal history, amount and type of additives and stereo sequence distribution, and OP [29]. By measuring the heat of fusion 𝛥𝐻𝑚 and heat of cold crystallization 𝛥𝐻𝑐, the degree of crystallinity can be calculated based on the following equation:
𝜒𝑐 =
𝛥𝐻𝑚− 𝛥𝐻𝑐
∆𝐻𝑚0 × 100 (1.2)
where ∆𝐻𝑚0 (93.6 J g-1) is the enthalpy of fusion of 100% crystalline PLA [41].
The process of quenching the optically pure PLA from the melt phase (e.g., during injection molding process) may lead to a quite amorphous polymer. Results from the literatures showed that quenching the polymer from melt at high cooling rate resulted in an large cold crystallization peak on the differential scanning calorimetry (DSC) thermogram and a lower crystallinity, while slow cooling produced a polymer with higher crystallinity with much lower enthalpy of cold crystallization [30, 42, 43]. The tendency for PLA to crystallize upon reheat also depended on the heating rate, as well as the OP of the polymer. The attainable percentage of crystallinity decreases with decreasing optical purity, and crystallization is essentially nonexistent when OP < 0.78 [29]. It was reported that PLA with greater than ~ 8% D-isomer remained amorphous even after 15h
of isothermal treatment at 145 °C. In contrast, at 1.5% D-isomer level, the quenched sample still had a minimal crystallinity [44].
1.1.5 Interaction of polylactide with solvents
Generally, the relative affinity of a polymer and a solvent can be assessed using Hansen solubility parameter 𝛿𝑇, which can be calculated by
𝛿𝑇2 = 𝛿
𝑑2+ 𝛿𝑝2+ 𝛿ℎ2 (1.3)
where 𝛿𝑑 , 𝛿𝑝 and 𝛿ℎ are, respectively, the dispersive, polar and hydrogen bonding contributions of the total solubility parameter [45]. The solubility parameter of PLA was 21.2 MPa1/2 [46]. Basically, the closer are the values of 𝛿𝑇 of the polymer and the solvent, the better is the affinity between each other. Sato et al. systematically investigated the effects of 60 organic solvents on PLA (Figure 1.1), and found that PLA was insoluble in 11 of 16 polar solvents (protic acids and alcohols), 9 of 11 nonpolar solvents (aromatic hydrocarbons and paraffins), but was soluble in 28 of 32 aprotic solvents (amines and esters) [46].
Figure 1.1 Solubility window of PLA in various organic solvents in the Hansen space. Solvent type: polar aprotic (◈), polar protic and non polar (×) [46].
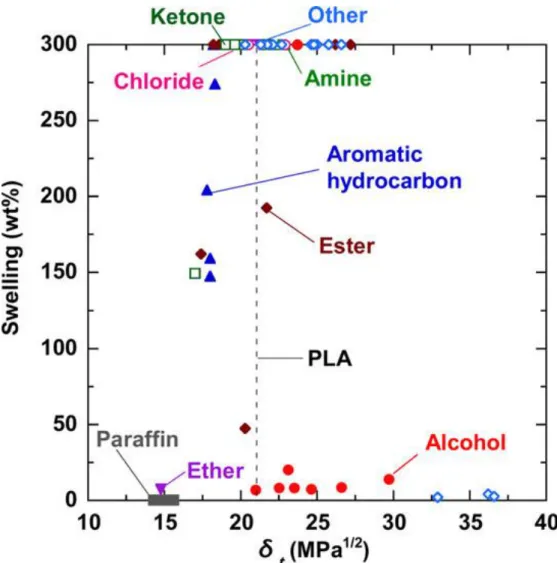
The relationship between swelling and 𝛿𝑡 is shown in Figure 1.2 [46]. The solvents for which the solubility parameter is near 21.2 MPa1/2 exhibited greater swelling. Swelling at and above 300 wt% means the solvents could dissolve or strongly swell PLA. Among the three Hansen solubility parameters, the hydrogen bonding solubility parameter more effectively reflects the solubility of PLA, that explains why the swelling of alcohols is very low even if its 𝛿𝑡 is close to 21.2 MPa1/2.
Figure 1.2 Relationship between swelling and total Hansen solubility parameter 𝛿𝑡. Organic solvent: alcohol (●), paraffin (■), aromatic hydrocarbon (▢), ester (◆),
1.2 Electrically conductive thermoplastic nanocomposites
1.2.1 Fundamentals of electrically conductive nanocomposites
Electrical conductivity may be one of the most important non-structural functions for the nanocomposite, but the most widely used polymer matrix materials such as PLA are typically poor conductors because of their very low concentration of free charge carriers. Various conductive composites were developed by adding high aspect ratio electrically conductive nanofillers such as single-walled carbon nanotubes (SWCNTs) [26, 47, 48], multi-walled carbon nanotubes (MWCNTs) [49-51], graphene [52-54], and metallic nanowires [4, 55, 56] into polymer matrices. The increase of the conductivity can be attributed to the formation of conductive pathways when the filler content exceeds a critical fraction. This critical concentration of the conductive additive is named the percolation threshold [1].
At the percolation threshold (φc), the 3D conductive network has not been formed, and thus
the composite conductivity is due to tunneling in addition to direct contact between the particles. Tunneling conduction occur when the distance between the filler particles are close enough, roughly less than 10 nm. Above the percolation threshold, the filler forms a continuous network inside the polymer matrix, and the further increase in the filler loading usually has no significant effect on the composite electrical conductivity [57].
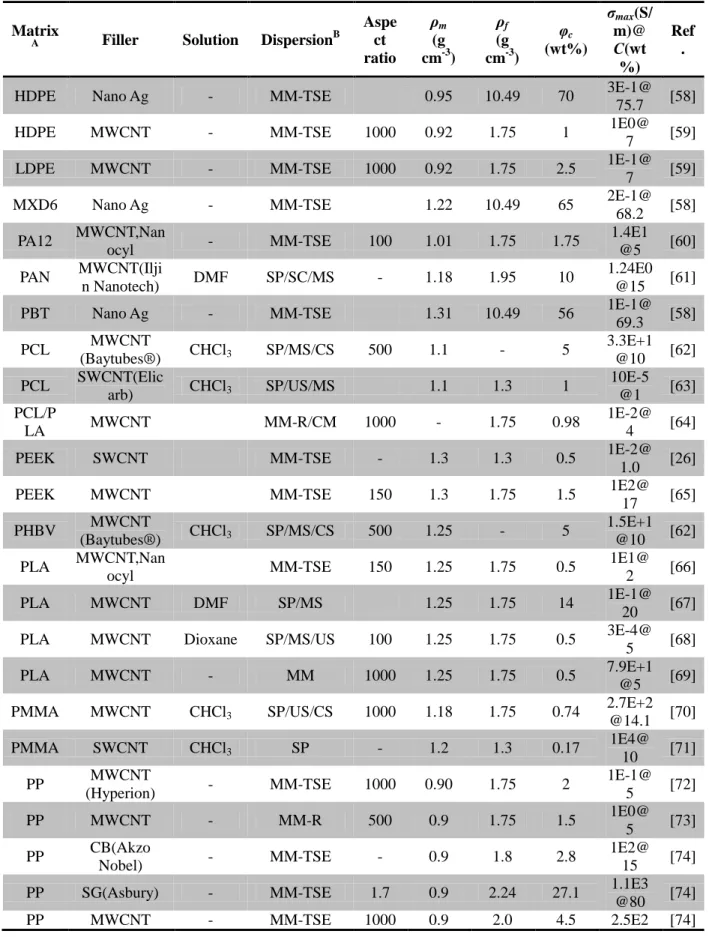
The conductivity and electrical percolation threshold of a composite depend on many factors including nanofiller aspect ratio, dispersion, distribution, and conductivity in addition to the polymer matrix crystallinity and surface tension. Table 1.2 lists a collection of the experimental parameters of electrically conductive thermoplastic nanocomposites. In the table, the polymer matrices are alphabetically arranged. In addition to nanofiller type and manufacturer, dispersion method and solvent in the case of solution processing are specified. Besides, the aspect ratio of nanofiller, density of the matrix (𝜌𝑚) and the filler (𝜌𝑓) are important parameters during processing. Furthermore, the electrical characteristics like φc, and the maximum observed
conductivity (σmax) at the experimental filler concentration (C) are also listed. All percolation
thresholds and filler concentrations are given in weight% (wt%). Wherever the original data were given in vol%, it was converted to wt% using the relation as follows:
Table 1.2 Summary of experimental parameters and properties of different polymer composites.
Matrix
A Filler Solution DispersionB
Aspe ct ratio ρm (g cm-3) ρf (g cm-3) φc (wt%) σmax(S/ m)@ C(wt %) Ref .
HDPE Nano Ag - MM-TSE 0.95 10.49 70 3E-1@ 75.7 [58]
HDPE MWCNT - MM-TSE 1000 0.92 1.75 1 1E0@
7 [59] LDPE MWCNT - MM-TSE 1000 0.92 1.75 2.5 1E-1@
7 [59]
MXD6 Nano Ag - MM-TSE 1.22 10.49 65 2E-1@
68.2 [58] PA12 MWCNT,Nan ocyl - MM-TSE 100 1.01 1.75 1.75 1.4E1 @5 [60] PAN MWCNT(Ilji n Nanotech) DMF SP/SC/MS - 1.18 1.95 10 1.24E0 @15 [61]
PBT Nano Ag - MM-TSE 1.31 10.49 56 1E-1@
69.3 [58] PCL MWCNT (Baytubes®) CHCl3 SP/MS/CS 500 1.1 - 5 3.3E+1 @10 [62] PCL SWCNT(Elic arb) CHCl3 SP/US/MS 1.1 1.3 1 10E-5 @1 [63] PCL/P LA MWCNT MM-R/CM 1000 - 1.75 0.98 1E-2@ 4 [64]
PEEK SWCNT MM-TSE - 1.3 1.3 0.5 1E-2@
1.0 [26]
PEEK MWCNT MM-TSE 150 1.3 1.75 1.5 1E2@
17 [65] PHBV MWCNT (Baytubes®) CHCl3 SP/MS/CS 500 1.25 - 5 1.5E+1 @10 [62] PLA MWCNT,Nan ocyl MM-TSE 150 1.25 1.75 0.5 1E1@ 2 [66] PLA MWCNT DMF SP/MS 1.25 1.75 14 1E-1@ 20 [67] PLA MWCNT Dioxane SP/MS/US 100 1.25 1.75 0.5 3E-4@
5 [68] PLA MWCNT - MM 1000 1.25 1.75 0.5 7.9E+1 @5 [69] PMMA MWCNT CHCl3 SP/US/CS 1000 1.18 1.75 0.74 2.7E+2 @14.1 [70] PMMA SWCNT CHCl3 SP - 1.2 1.3 0.17 1E4@ 10 [71] PP MWCNT (Hyperion) - MM-TSE 1000 0.90 1.75 2 1E-1@ 5 [72] PP MWCNT - MM-R 500 0.9 1.75 1.5 1E0@ 5 [73] PP CB(Akzo Nobel) - MM-TSE - 0.9 1.8 2.8 1E2@ 15 [74] PP SG(Asbury) - MM-TSE 1.7 0.9 2.24 27.1 1.1E3
@80 [74] PP MWCNT - MM-TSE 1000 0.9 2.0 4.5 2.5E2 [74]
@15 PP Ag/MWCNT - MB/CM - 0.9 10.49/ 1.5 2E-2@
2 [75] PS MWCNT Toluene SP/US/CS 1000 1.05 1.75 0.8 0.9E+2
@15.6 [70] PS MWCNT (Kentucky U) DMF/ THF SP/US/MS/C M 100 1.04 0.6 0.01 1E0@ 0.07 [76] PS MWCNT MM-TSE/C M 500 0.95 1.75 - 1E-7@ 5 [7] PS CuNW CH2Cl2/ CH3OH SP/SC/CM - 1.04 8.96 2.1 1E4@ 19.8 [4] PS CuNW CH2Cl2 SP/US/CM 71 1.04 8.96 4.1 1E-3@ 21 [66]
PS CuNW - MM-TSE 51 1.04 8.96 11.6 1E-6@
15 [77] PS AgNW Toluene SP/MS/CM 31 1.04 10.49 0.19 1E-1@
4.8 [78] PS Sn-Pb alloy - BM/CM - 1.04 8.57 71.1 1E0@
81.6 [79] PS Ni particle,
Bi/Sn alloy - MM-SSE - 1.04 - 78.2
1E4@ 89.3 [80] PU MWCNT,Nan ocyl - MM-TSE/C M 150 1.29 1.75 0.13 1E0@ 1 [81] PU MWCNT THF SP/MS/CS 1.29 1.75 1.0 2E3@ 15 [82] P(VDF
-TrFE) NiNW Acetone
SP/SC/MS/C
M 250 1.8 8.91 3.6
1E2@ 28.6 [83] A Matrix: HDPE: High density polyethylene, MXD6: Poly(m-xylene adipamide), PA12: Polyamide 12, PAN: Polyacrylonitrile, PBT: Polybutylene terephthalate, PCL: Polycaprolactones, PDMS: Polydimethylsiloxane, PEEK: Poly(ether ether ketone), PHBV: Polyhydroxybutyrate, PMMA: Polymethyl methacrylate, PP: Polypropylene, PS: Polystyrene, P(VDF-TrFE): Poly(vinylidene difluoride)-trifluoroethylene, PU: Polyurethane.
B Dispersion: MM-TSE: Melt mixing with twin screw extruder, SP: solution processing, SC: sonication, MS: mechanical stirring, CS; Casting, US: ultrasonication, MM-R: melt mixing in rheometer, MB: mixed in Brabender, CM: compression molding; BM: mixing in ball mill, MM-SSE: melt mixing with single screw extruder
wt% = 𝑣𝑜𝑙%×𝜌𝑓
𝑣𝑜𝑙%×𝜌𝑓+𝜌𝑚×(1−𝑣𝑜𝑙%) (1.4)
Maximum conductivities of 10,000 S m-1 have been reported for PMMA containing 10 wt% SOCl2 treated SWCNT [71], of 2000 S m-1 for PU with 15 wt% MWCNT [82] and of 10,000 S
m-1 for PS with 19.8 wt% CuNW [4]. The percolation thresholds found for the above mentioned systems were 0.17 wt%, 1 wt% and 2.1 wt% respectively (see Table 1.2).
A power law fit [84], as given in Eq. (1.5), derived from the percolation theory is often used to fit the conductivity (σ) of a polymer filled with conductive particles to the volume fraction (φ)
of the particles above the percolation threshold:
𝜍 = 𝜍0(𝜑 − 𝜑𝑐)𝑡 (1.5)
where σ0 is a constant usually assigned to the plateau conductivity of the fully loaded composite
and the exponent (t) fits the data and is used to interpret the mechanism of network formation. Generally, t is about 1.1-1.3 for a 2D network system, while a higher value, in the range from 1.6 to 2.0, is obtained when the fillers form a 3D network [85].
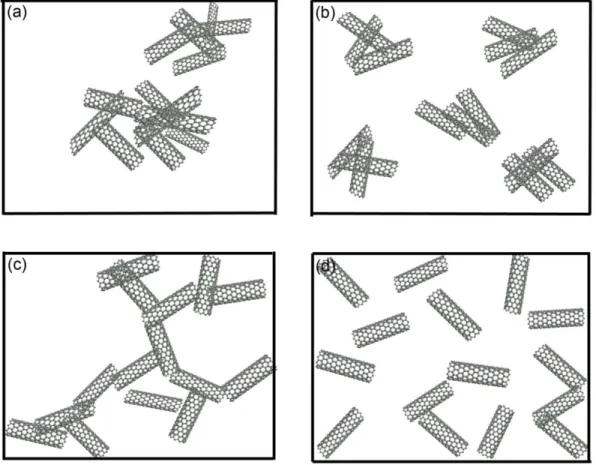
Figure 1.3 Schematic sketches showing the effect of a 1D filler on the conductivity of polymer composite. (a) No conductivity. Bad distribution and dispersion, (b) No conductivity. Good distribution; Bad dispersion, (c) Conductivity. Bad distribution;
For the electrically conductive nanocomposite, it is important to reduce the percolation threshold to make those composites economically feasible since the nanofillers are much more expensive than the polymer matrix. Building a conductive network within an insulative matrix at low concentration does not necessarily require a well distributed filler, but a well dispersed filler [57]. Figure 1.3 shows the ability of 1D fibers in percolating a 2D plane based on different dispersion and distribution scenarios. Figure 1.3 (a) and (b) show that the poor dispersion of the fibers prohibits network formation, while Figure 1.3 (d) shows that the perfect distribution of well dispersed fibers increases the gap between the fibers. Only the preferential distribution, Figure 1.3 (c), of well dispersed fibers forms a conductive 2D network.
1.2.2 Effect of filler type
1.2.2.1 Properties of graphene
Pristine graphene is a 2D honeycomb carbon lattice, where the sp2 hybridized carbon atoms are arranged in a hexagonal fashion in mono-layer. Graphene can be produced in many ways such as mechanical exfoliation [86] and chemical vapor deposition (CVD) [87], and exfoliation of graphite intercalation compounds [88]. Mechanical exfoliation approaches are suitable to maintain the graphene structure, while they are limited by their low production rate. The CVD processes are suitable for large-scale production of mono- or few-layer graphene films. However, the chemical treatment inevitably generates structural defects [79] which disrupt the electronic structure of graphene and change it to be semiconductive [89]. Besides, there are important chemical derivatives of graphene: graphene oxide (GO) and reduced graphene oxide (RGO), which can be synthesized in large quantities through chemical oxidation and exfoliation of graphite and subsequent reduction to graphene [27].
Pure graphene has many excellent properties such as high charge (i.e. electrons and holes) mobility (230,000 cm2 Vs-1) with 2.3% absorption of visible light, high thermal conductivity (3000 W mK-1), high strength (130 GPa), and high theoretical specific surface area (~ 2600 m2 g-1). The theoretical electrical conductivity is 5 × 10⁷ S m-1. However, due to the presence of oxidized functional group, as-fabricated GO is found to be insulating and the conductivity of RGO can vary from 5 to 50,000 S m-1 depending on the degree of reduction [61].
1.2.2.2 Properties of CNTs
CNTs, which were discovered by Iijima around twenty years ago [4], are hexagonal networks of carbon atoms in the shape of seamless cylinder like rolled graphene layers with each end capped with a hemisphere of the buckyball structure. The two main kinds of nanotubes are single-walled (SW) and multi-walled (MW) carbon nanotubes and they are shown in Figure 1.4. SWCNTs are individual cylinders of 1-2 nm in diameter [90]. MWCNTs can be regarded as a coaxial assembly of graphene cylinders, where weak van de Waals forces link the tubes together [91].
Similar to graphene, the strength of the sp2 carbon-carbon bonds gives CNTs amazing mechanical properties. Their tensile strength, approximately 100-600 GPa, is about ten times higher than that of current high-strength carbon fibers (30-33 GPa) [75], and their density is around 1.3 g cm-3, lower than the density of commercial carbon fibers (1.8-1.0 g cm-3) [59]. The electrical conductivity of CNTs along the tube is unique, ranging from high-conductivity metallic behavior to semiconducting with a large band gap [80], which is determined by its size and chirality. The contact resistance of different nanotubes sensitively varies with the nanotube chirality, the atomic structure in contact regions and externally applied pressure [92].
1.2.2.3 Properties of metallic nanowires
Metallic nanowires are another type of promising nanofillers for electrically conductive polymer nanocomposites. Metals featuring high electrical conductivity (107 S m-1
) such as copper, silver and nickel can also be produced as nanowires. Besides, their aspect ratios, structure, composition, and surface properties can be controlled by the conditions of their synthesis [49]. An important technique to fabricate metallic nanowires is the electrochemical method based on various templates, which include positive, negative, and soft templates [93].
Most of the metallic nanowires, fabricated with the template methods, exhibit the classical Ohm’s law behavior and are regarded as classical wires. However, they do possess unique physical properties such as small dimensions, high surface-to-volume ratio, and novel optical and magnetic properties. When the metal nanowires are shorter than a few tens of nm and thinner than a few nm, the conductance is quantized and the wire is referred to as a quantum wire [93].
1.2.2.4 Comparison of the nanofillers
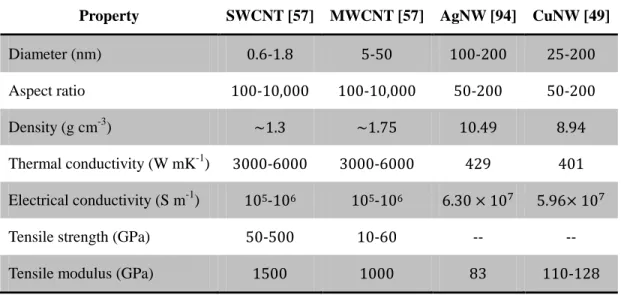
Table 1.3 shows different fillers and their typical properties. MWCNTs feature the lower price and similar properties to SWCNTs, so that MWCNTs are most widely used in different polymer matrices as listed in Table 1.2 The main advantage of the metallic nanowires is the fact that they are able to support high voltage and current intensity in current limiting devices [58]. However, the nanocomposites with CNTs and metallic nanowires exhibit similar φc values.
Table 1.3 Typical properties of 1D conductive nanofillers
Property SWCNT [57] MWCNT [57] AgNW [94] CuNW [49]
Diameter (nm) 0.6-1.8 5-50 100-200 25-200
Aspect ratio 100-10,000 100-10,000 50-200 50-200
Density (g cm-3) ~1.3 ~1.75 10.49 8.94
Thermal conductivity (W mK-1) 3000-6000 3000-6000 429 401 Electrical conductivity (S m-1) 105-106 105-106 6.30 × 10⁷ 5.96× 10⁷
Tensile strength (GPa) 50-500 10-60 -- -- Tensile modulus (GPa) 1500 1000 83 110-128
From Table 1.2, it is found that different filler types (SWCNT or MWCNT) in the same polymer matrix have no clear impact on the maximum conductivity. Chatterjee et al. found that the values of conductivity in graphene nanoplatelets composite were considerably lower comparing with CNT reinforced composites [60], most probably because commercial graphene nanoplatelets may contain some unreduced graphite oxide, which is non-conducting.
1.2.3 Effect of polymer type
The type of polymers has an obvious effect on the electrical conductivity of composites. A few polymers are intrinsically conductive such as polyaniline [95], polypyrrole [96], and poly(3,4-ethylenedioxythiophene) (PEDOT) [97], but generally they are not. In composite materials, the percolation threshold is affected by polymer surface tension, polarity and crystallinity. Higher polymer surface tension leads to lower filler-polymer interfacial tension. In this situation, the polymer matrix can easily wet the filler particles and thereby distribute them well [57], which increases the percolation threshold. Similarly, higher polymer polarity could lead to better interactions with the nanofillers, which means better distribution of the fillers and a higher percolation threshold.
Compared to amorphous polymer nanocomposite [76, 98, 99], semi-crystalline polymer systems can reach better conductivity and lower percolation thresholds [100-102]. This is a consequence of filler particles being ejected from the crystalline region during crystallization and concentrating in the amorphous region. This phenomenon is called the ―double-percolation threshold‖. For example, semi-crystalline polystyrene (PS) exhibited a four times large conductivity threshold compared to their amorphous counterparts [102].
1.2.4 Effect of processing method
Processing methods and conditions affect the filler distribution, dispersion, orientation and aspect ratio. The aim of optimum processing conditions is to achieve low percolation threshold and enhance composites properties, including electrical conductivity, which means that the nanofillers should be well dispersed without a reduction of their aspect ratio. Good distribution may not be required to form a conductive network at low filler loading (Figure 1.3) [57]. However, to achieve high mechanical properties, uniform filler distribution is necessary. The most popular methods to prepare thermoplastic nanocomposites are melt mixing and solution
processing as observed in Table 1.2.
1.2.4.1 Melt mixing
Melt mixing is a favorable method for composites preparation because of its simplicity and the wide availability of processing equipment in the polymer industry, which can lead to commercialized products using existing infrastructure. Moreover, the absence of solvent makes it an economically and environmentally sound method. The most common processing techniques are extrusion, internal mixing, injection molding and blow molding [103]. However, in order to obtain the desired dispersion, a high-shear mixing condition is required, which often lead to a decrease in the nanofillers aspect ratio, and degradation of various properties [103]. One of the strategies used to facilitate nanofiller dispersion in a polymer matrix without resorting to destructive shear mixing conditions is grafting the nanofiller before melt compounding. For example, CNTs dispersion in a PMMA matrix was enhanced by first coating CNTs with poly(vinylidene fluoride) (PVDF) before melt mixing [104].
Traditional melt mixing methods can require large quantities of materials (on the order of kg). This is not economical for preparing nanocomposite at the laboratory scale. Thus a miniature twin-screw extruder (or micro-compounder) has been successfully developed to prepare
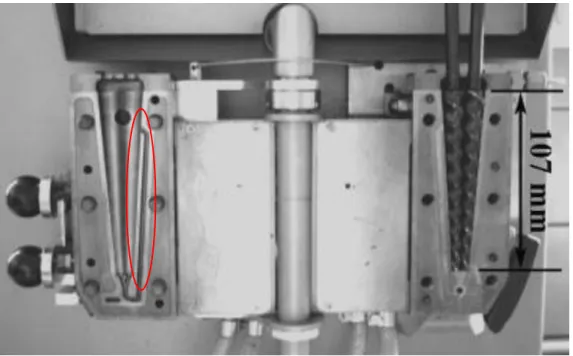
thermoplastic nanocomposites from small quantities [77, 105]. There are several companies that provide the micro-compounder including DSM (Heerlen, Netherlands), DACA Instruments (Goleta, CA, USA) and Haake Instruments Inc. (Paramus, NJ, USA). The micro-compounders from different companies all comprise a conical twin-screw extruder with a bypass as shown in the ellipse of Figure 1.5, which allows the melt composite to recirculate so that the material can be mixed for a certain period of time.
The re-circulating channel of micro compounders is helpful to increase the dispersion [59]. Lin et al. prepared PS/copper nanowire composite melt mixed in two DSM micro-compounders, with capacities of 5 and 15 mL (DSM5 and DSM15) [77]. They found that the electrical percolation threshold for the nanocomposite prepared from DSM5 was lower than that from DSM15, but was similar to that of nanocomposites prepared in solution. Villmow et al. investigated the effect of twin-screw extrusion conditions on the dispersion of MWCNTs in a PLA matrix and found that the high rotation speed combined with a screw profile containing mainly mixing elements were highly efficient to disperse the MWCNT [66].
1.2.4.2 Solution processing
Due to the high viscosity and the possible thermal and mechanical degradation of the polymer while using the melt mixing method, solution processing has been also widely used to prepare polymer composites on a laboratory scale. However, this method may be not desirable at the industrial scale because of the necessity to handle large amounts of solvents. Generally, the solution processing includes three steps, (1) dispersing the nanofillers in an appropriate solvent, (2) mixing the nanofillers suspension with a polymer in the same solvent or in a mixed solvent, and (3) evaporating the composite solution [18, 61, 66]. Depending on the evaporating procedure, the composite can be recovered as a thin film, a fiber or a powdery material. In order to achieve excellent dispersion of nanofillers, the selection of the right solvent to dissolve the polymer and to disperse the nanofiller is critical. Besides, some processing aids have been utilized to enhance the dispersion and/or alignment of nanofillers such as sonication [61], ultrasonication [18], magnetic fields [28], and surfactants [106], functionalization and grafting of nanofillers [66, 107]. The interaction between functionalized CNT and solvent allows for a better dispersion. Rizvi et al. prepared a carboxylated MWCNT/PLA composite by the solution casting method using two different solvents, chloroform and 1,4-dioxane [68]. The electrical percolation
threshold of the nanocomposite prepared in 1,4-dioxane was found to be lower than that prepared in chloroform, which was due to the chemical interactions between the carboxylated MWCNT and 1,4-dioxane. Moreover, a homogeneous dispersion of carboxylated MWCNT was successfully achieved in polyurethane (PU) matrix due to hydrogen bonds between C=O group of the PU chain and COOH groups of the MWCNT [108].
1.3 Fabrication of 3D nanocomposite microstructures
1.3.1 Microfabrication techniques
Multifunctional 3D micro-devices have been extensively explored for applications in electronic devices, chemical and biological sensors [109], catalysis and electrocatalysis, energy devices [110], microwave absorption and EMI shielding [7], electrorheological fluids and biomedicine [111]. In order to fabricate two- and three-dimensional microstructures for those applications, several fabrication techniques have been developed such as electrospinning [60], stereolithography [112] and ink direct-write technique [113].
Electrospinning has been actively exploited as a valuable and versatile method for generating long polymer fiber with a diameter ranging from tens of nanometers to several micrometers [114]. By allowing the process for some time, a porous scaffold is formed on the collector. To achieve a fibrous scaffold with oriented fibers, a rotating drum, disk, or parallel electrodes may be used [28]. PLA has been electro-spun into different forms of ultrafine fibers and used as carriers for bioactive agents [115]. PLA nanocomposite fibers containing nanofillers such as silver nanoparticles have also been successfully produced using the electrospinning technique [60].
Stereolithography is a solid freeform technique that was introduced in the late 1980s [112]. Commercially available stereolithography setups can build objects at an accuracy of ~ 20 μm, and micro-sized structures with sub-micron resolution had been fabricated in laboratory [116]. Its working principle is based on spatially controlled solidification of a liquid photo-polymerisable resin. Using a computer-controlled laser beam or a digital light projector with a computer-driven building stage, a solid, 3D object can be constructed in a layer-by-layer fashion [117]. Poly-DL-lactide (DLLA) networks can be formed by photo-initiated radical polymerization of PLA oligomers end-functionalized with an unsaturated moiety such as a methacrylate-, acrylate-
or fumarate- groups. One of these PLA type has been developed and used to fabricate 3D porous scaffolds using stereolithography, which has excellent mechanical properties and very good biocompatibility with cells [117].
1.3.2 Direct-write technique
The direct-write technique is a method for precisely assembling periodic arrays. This technique employs a computer-controlled translation stage, which moves a pattern-generating device, that is an ink-deposition nozzle, to create materials with controlled architecture and composition [113]. As shown in Figure 1.6, the fugitive ink is contained in a syringe and is
Figure 1.6 Schematic illustration of the fabrication of a 3D scaffold by the direct-write method: (a) deposition of fugitive ink; (b) ink layers after deposition; (c) optical image of a 104-layer scaffold assembled from the binary organic ink deposited through a 200 μm nozzle [10].
extruded through a micronozzle by applying pressure. In this example, a 3D scaffold consisting of a 104-layer structure of parallel cylindrical rods with an inter-rod separation distance of 1.25 mm has been fabricated, as shown in Figure 1.6c [10]. The technique can be applied to a wide range of materials that can be processed as inks, including concentrated colloidal [118], fugitive organic [119], and polyelectrolyte inks [120]. 3D periodic architectures with filamentary features ranging from hundreds of micrometers to sub-micrometer in size have been fabricated using these inks, and have various applications such as functional composites [118], microfluidic networks [119], and tissue engineering scaffolds [121].
Thermoplastic polymers can also be used as the ink to fabricate 3D structures when it is molten [19]. Bouchaar et al. designed an ink-fused direct-write system for thermoplastic
Figure 1.7 Schematic illustration of a direct-write assembly module for thermoplastic polymers [122].
materials as shown in Figure 1.7 [122]. During this approach, a PLA/nanoclay nanocomposite has been fed into the metallic syringe and fused at high temperature. Then the molten nanocomposite is deposited on the substrate and quickly become a solid filament at room temperature. The resolution of this system is limited by the high viscosity of the melt polymer. The diameter of the smallest filament fabricated with the PLA nanocomposite was 250 μm. The ink-fused direct-write system is a powerful technique to fabricate complex structures like microfilaments, microfilms, and micro-scaffolds from thermoplastic polymers (Figure 1.8). However, the high temperature may lead to thermal degradation of the polymer and affect the mechanical properties. In addition, the system presented in Figure 1.7 needs to be upgraded to a design with better sealing capacity, easier handling and cleaning.
1.4 CNT-based nanocomposites for sensing applications
There has been an explosion of interest in the development of a new species of intelligent materials termed ―conductive polymer nanocomposites (CPCs)‖ [1-3], which can benefit Figure 1.8 Perspective views of 3D scaffolds made by the ink-fused direct-write technique: (a) and
(c) are optical microscopy images, (b) and (d) are SEM images [122].
(a) (b)
multifunctional properties such as high mechanical strength and stiffness, thermal and electrical conductivity at relatively low CNT loading. CPCs have been extensively used for various sensors based on the polymer reaction to environmental changes which affects the electrically conductive particle network [45, 92, 123]. External stimuli such as temperature shift [124], mechanical deformation [125], and the presence of gases and vapors [126] or solvents [127] can lead to measurable resistance changes of the CPCs.
As shown in Figure 1.9a-c, various designs of CPCs sensors containing CNT have been reported, including partially embedded CNTs in a polymer matrix [129], CNT arranged coating on polymer surfaces or fibers [130], and fully dispersed CNTs in a polymer matrix [127, 131, 132]. Due to its cost efficiency and tailored processing, the sensory CPCs with fully embedded CNTs are preferred. Various shapes and sizes (Figure 1.9d) were fabricated using different techniques. Thermosetting CPCs sensors are fabricated by either spin coating on substrates or slip casting [133], while thermoplastic based sensors are mostly processed using melt processing
Figure 1.9 Different sensory CPC designs and CNT arrangements. (a) Partially embedded CNTs in polymer, (b) a polymer substrate covered with CNTs, and (c) full embedded CNTs in polymer. (d) Possible sensory CPC shapes (fibers, compression-molded plate, cylinder, and £2 coin for size
comparison) [128].
(a) (b) (c)
![Table 1.1 Physical and mechanical properties of selected thermoplastic polymers [25].](https://thumb-eu.123doks.com/thumbv2/123doknet/2332251.31980/23.918.120.813.761.1013/table-physical-mechanical-properties-selected-thermoplastic-polymers.webp)
![Figure 1.1 Solubility window of PLA in various organic solvents in the Hansen space. Solvent type: polar aprotic (◈), polar protic and non polar (×) [46]](https://thumb-eu.123doks.com/thumbv2/123doknet/2332251.31980/27.918.183.742.113.524/figure-solubility-various-organic-solvents-hansen-solvent-aprotic.webp)
![Figure 1.4 Conceptual diagram of SWCNT (a) and MWCNT (b) [77].](https://thumb-eu.123doks.com/thumbv2/123doknet/2332251.31980/34.918.207.713.699.1027/figure-conceptual-diagram-of-swcnt-and-mwcnt.webp)
![Figure 1.7 Schematic illustration of a direct-write assembly module for thermoplastic polymers [122]](https://thumb-eu.123doks.com/thumbv2/123doknet/2332251.31980/41.918.184.733.485.987/figure-schematic-illustration-direct-assembly-module-thermoplastic-polymers.webp)