HAL Id: hal-00331888
https://hal.archives-ouvertes.fr/hal-00331888
Submitted on 19 Oct 2008HAL is a multi-disciplinary open access archive for the deposit and dissemination of sci-entific research documents, whether they are pub-lished or not. The documents may come from teaching and research institutions in France or abroad, or from public or private research centers.
L’archive ouverte pluridisciplinaire HAL, est destinée au dépôt et à la diffusion de documents scientifiques de niveau recherche, publiés ou non, émanant des établissements d’enseignement et de recherche français ou étrangers, des laboratoires publics ou privés.
using field and laboratory approaches
Marc Metian, Paco Bustamante, Richard Cosson, Laetitia Hédouin, Michel
Warnau
To cite this version:
Marc Metian, Paco Bustamante, Richard Cosson, Laetitia Hédouin, Michel Warnau. Investigation of Ag in the king scallop Pecten maximus using field and laboratory approaches. Journal of Exper-imental Marine Biology and Ecology, Elsevier, 2008, 367, pp.53-60. �10.1016/j.jembe.2008.08.019�. �hal-00331888�
Investigation of Ag in the king scallop Pecten maximus
1
using field and laboratory approaches
2 3
Marc Metiana,b, Paco Bustamanteb, Richard P. Cossonc, Laetitia Hédouina,b, Michel Warnaua* 4
5
a
International Atomic Energy Agency – Marine Environment Laboratories (IAEA-MEL), 4 6
Quai Antoine Ier, MC-98000 Principality of Monaco 7
b
Littoral Environnement et Sociétés (LIENSs), UMR 6250, CNRS-Université de La Rochelle, 8
2 rue Olympe de Gouges, F-17042 La Rochelle Cedex 01, France 9
c
Université de Nantes, Laboratoire de Biologie Marine, ISOMer, BP 92208, F-44322 Nantes 10
Cedex 3, France 11
12 13
*Corresponding author: Dr. Michel Warnau 14
Present address: 15
LIENSs, UMR 6250, CNRS-Université de La Rochelle 16
2 rue Olympe de Gouges 17
F-17042 La Rochelle Cedex 01 (France) 18
E-mail: warnaumichel@yahoo.com 19
20 21
Abstract 22
23
The bioaccumulation, tissue and subcellular distributions of Ag were investigated in the 24
king scallop Pecten maximus from the Bay of Seine fishery area (France) in laboratory and in 25
field conditions. Experimental investigations with the radiotracer 110mAg showed that the 26
scallop readily concentrated Ag when exposed via seawater and to a much lower extent when 27
exposed via sediment. Retention of the metal incorporated via all tested contamination 28
pathways was shown to be very strong, but the assimilation efficiency of Ag ingested with 29
food was found to be tightly depending on the phytoplankton strain used to feed the scallops 30
(74 and 33% with Skeletonema costatum and Isochrysis galbana, respectively). The uptake 31
and depuration kinetic parameters determined in the laboratory experiments were used to run 32
a global bioaccumulation model. The latter indicated that the major uptake pathway of Ag in 33
P. maximus was strongly depending on the food quality. Indeed, when fed the diatom S. 34
costatum which was characterised by a high affinity for Ag (high distribution constant Kdf)
35
the relative contribution of the feeding pathway reached 98% of the global Ag 36
bioaccumulation. In contrast, when fed I. galbana which displayed a lower Kdf than S.
37
costatum, dietary Ag was retained to a lesser extent by P. maximus, and seawater appeared as 38
the major contributing uptake pathway. In wild scallops collected from reference and 39
contaminated sites, Ag was mainly concentrated in the digestive gland and secondarily in the 40
gills, and was mainly found associated with the insoluble subcellular fraction in all the scallop 41
tissues. 42
43
Keywords: Metal; bioaccumulation; exposure pathway; relative contribution; bivalves; 44
Pectinid. 45
1. Introduction 46
47
Inputs of Ag in the marine environment through sewage sludge from the coastal cities is 48
of environmental concern (Sañudo-Wilhelmy and Flegal, 1992; Luoma et al., 1995), 49
especially as this metal is well known to be one of the most toxic elements (e.g., Warnau et 50
al., 1996b; Ratte, 1999). Once in the marine environment, Ag tends to accumulate in the 51
sediments and to concentrate in benthic deposit- and filter-feeders (Bryan, 1985; Luoma et al., 52
1995). In bivalves, Ag concentrations were shown to be closely related to the contamination 53
degree of their environment (e.g., Young and Jan, 1979; Bustamante and Miramand, 2005) 54
and the occurrence of Ag in these organisms may therefore be used as a valuable proxy of 55
urban contamination (Sañudo-Wilhelmy and Flegal, 1992; Luoma et al., 1995). 56
Among filter-feeders, the Pectinidae are known to accumulate very high concentrations of 57
Ag (e.g., Brooks and Rumsby, 1965; Bryan, 1973; Bustamante and Miramand, 2005; Metian 58
et al., 2008). This accumulation is especially strong in the digestive gland, in which Ag 59
concentrations are generally above 60 µg g-1 dry wt, without apparent toxic effects (Brooks 60
and Rumsby, 1965; Bryan, 1973; Bustamante and Miramand, 2005). It is well documented in 61
bivalves that Ag is detoxified via binding with thiol groups and is then precipitated in the 62
connective tissues, particularly in the digestive system (e.g., Berthet et al., 1992). Ag is also 63
known to display high affinity for metallothioneins (MTs). As these proteins have been 64
reported to occur in high concentrations in Pectinidae (e.g., Viarengo et al., 1993; Ponzano et 65
al., 2001), MTs could also contribute significantly to Ag detoxification in this group. 66
Overall, although Ag bioaccumulation has been investigated in several bivalves (e.g., 67
Wang et al., 1996; Reinfelder et al., 1997), little information is available on Ag 68
bioaccumulation and detoxification processes in Pectinidae. In particular, uptake and 69
depuration kinetics of Ag are only documented for one species (the variegated scallop 70
Chlamys varia) exposed via seawater (Metayer et al., 1990). In the latter study, the Ag 71
exposure concentrations were very high (1 to 1,000 µg l-1) and far higher than concentrations 72
actually found in marine waters, even in heavily contaminated areas (Ratte, 1999; Gorsuch et 73
al., 2003). Furthermore, such elevated Ag concentrations resulted in toxic effects in marine 74
bivalves (e.g., Eisler, 1996). Nevertheless, C. varia displayed a strong retention capacity for 75
Ag in its tissues (Bustamante and Miramand 2005), where it was stored as Ag sulphide 76
(Martoja et al., 1989). 77
The present work investigated the processes governing Ag bioaccumulation in the king 78
scallop Pecten maximus, through both field and laboratory approaches. As a first step, Ag 79
bioaccumulation was assessed in controlled laboratory conditions during experimental 80
exposures via seawater, food or sediment, using the 110mAg γ-emitting radiotracer. This 81
approach allowed determining the uptake and depuration kinetic parameters of Ag as well as 82
its tissue and subcellular distributions for each contamination pathway. The parameters were 83
then used to feed a global bioaccumulation model in order to delineate the relative 84
contribution of the three different pathways of exposure. In a complementary field study, wild 85
scallops were collected from a Ag-clean site and a Ag-contaminated site and analysed for 86
their concentrations, and tissue and subcellular distributions in Ag and MTs. Results from 87
both field and laboratory studies were then combined in order to better understand the 88
bioaccumulation of Ag in P. maximus as well as to further assess whether P. maximus could 89
be used as a reliable bioindicator species of marine Ag contamination. 90
91
2. Materials and methods 92
93
2.1. Laboratory experiments 94
95
King scallops (Pecten maximus) were collected on the Atlantic coast of France (Bay of 96
Seine) and acclimated for 3 weeks to laboratory conditions. During this period, scallops were 97
fed daily a microalgal diet (5 . 104 cells ml-1) composed of the Bacillariophyceae Skeletonema 98
costatum and the Prymnesiophyceae Isochrysis galbana. 99
Thirteen individuals (mean weight: 208 ± 46 g) were placed in a 50-l aquarium and 100
exposed for 7 d to 0.4 kBq l-1110mAg dissolved in filtered (0.45 µm) seawater, according to 101
the methodology described in Warnau et al. (1996c, 1999). At each daily renewal of seawater 102
and spike, the scallops were fed briefly (30 min) S. costatum and I. galbana (5 . 104 cells ml-1) 103
in clean seawater. At the end of this period, 4 scallops were dissected and the remaining 104
scallops were placed in non contaminated, flowing seawater to follow Ag depuration for 36 d. 105
During the depuration period, scallops were fed daily S. costatum and I. galbana (5 . 104 cells 106
ml-1). 107
Fourteen scallops (mean weight: 118 ± 5 g) were placed in a 50-l aquarium and exposed 108
for 13 d under flowing seawater to sediment previously spiked with 110mAg (31 Bq 110mAg g-1 109
wet wt) according to the method described in Danis et al. (2005) and adapted as in Metian et 110
al. (2007). After 13 d, 4 individuals were dissected, and the remaining individuals were placed 111
in depuration conditions for 49 d (clean sediment under flowing seawater, daily feeding on S. 112
costatum and I. galbana at 5 . 104 cells ml-1). The spiked sediment was mainly composed 113
(95.8%) of grain which size ranged from 76 to 302 µm; its dry/wet wt ratio was 0.80. At the 114
end of the 49-d depuration period, 4 scallops were dissected. 115
Eighteen scallops (mean weight: 170 ± 69 g) were placed in a 50-l aquarium and exposed 116
to radiolabelled food (phytoplankton; 5 . 104 cells ml-1) of contrasting nature in order to 117
encompass the complexity of the phytoplankton diet of scallops (Mikulich and Tsikhon-118
Lukamina, 1981; Shumway et al., 1987). In this respect, one culture of S. costatum (Si-walled 119
diatom) and one of I. galbana (naked flagellate) were previously exposed during their 120
exponential growth phase to 5 and 4 kBq 110mAg l-1 for 10 and 7 d, respectively, and then 121
separated from the spiked seawater (1-µm filtration) according to the method described in 122
Metian et al. (2007). Nine scallops were fed S. costatum and 9 were fed I. galbana. After a 2-123
h feeding on one or the other phytoplankton strain (pulse-chase feeding method, Warnau et 124
al., 1996c; Metian et al., 2007), all scallops were whole-body γ-counted (see below, end of 125
this section) and then placed in non contaminated, flowing seawater conditions, with daily 126
feeding on S. costatum and I. galbana (5 . 104 cells ml-1). Four scallops were dissected after 127
21 d (S. costatum) or 16 d (I. galbana). 128
Preliminary feeding experiments were also carried out in order to assess the ingestion rate 129
(IR) of both phytoplankton strains by P. maximus. In this respect, four batches of three 130
scallops were each placed in a 20-l aquarium (constantly aerated) supplied with 5 . 104 cells 131
ml-1. In each aquarium, three samples of seawater (5 ml) were collected at t0 and after 30 and
132
60 min. The cell density was counted in each sample under a light microscope, using a Thoma 133
cell, and the difference between final and initial cell densities was converted to IR (g g-1 d-1). 134
During the three experiments (seawater, food and sediment), samples of water and/or 135
sediment were collected twice a day during both exposure and depuration phases and 136
radioanalysed in order to check for any possible variation in 110mAg activity in the 137
microcosms (exposure phases) or for any possible 110mAg recycling via seawater (exposure 138
phase via sediment and depuration phase for the three pathways). Data obtained during the 139
exposure periods were used to determine the time-integrated activity (Rodriguez y Baena et 140
al., 2006) and to calculate the concentration (seawater exposure) and transfer (sediment 141
exposure) factors (see Metian et al., 2007). 142
In the three experiments (seawater, sediment and food), the dissected scallops were used 143
to determine the distribution of 110mAg among the different body compartments (shell, 144
digestive gland, kidneys, gills, gonad, mantle, intestine, adductor muscle and the remaining 145
soft tissues). In all experiments, the distribution of 110mAg between the soluble and insoluble 146
subcellular fractions was also determined in the digestive gland, according to the method 147
described by Bustamante and Miramand (2005). Briefly, a part of the gland was homogenized 148
individually with a mortar and pestle on ice with 10 ml of 0.02M Tris–HCl buffer at pH 8.6. 149
The homogenates were then centrifuged at 30,000 g for 1 h at 4°C in a Sorvall RC28S 150
ultracentrifuge to separate particle-free supernatant (cytosol; i.e., the soluble fraction) from 151
the pellet (i.e., the insoluble fraction). Aliquots of the homogenates, cytosols, and pellets were 152
radioanalysed using a γ spectrometer (see here below). 153
Biokinetic experiments were carried out using a high-specific activity 110mAg radiotracer 154
purchased from Isotope Product Lab, Germany (110mAg as AgNO3, T½ = 249.8 d).
155
Radioactivity in live scallops that were radioanalysed daily during uptake and depuration 156
experiments and in dissected and centrifuged samples were counted using a high-resolution γ -157
spectrometry system consisting of four coaxial Germanium (N- or P-type) detectors (EGNC 158
33-195-R, Canberra® and Eurysis®) connected to a multi-channel analyzer and a computer 159
equipped with a spectra analysis software (Interwinner® 6). 160
The radioactivity was determined by comparison with standards of known activity and of 161
appropriate geometry. Measurements were corrected for counting efficiency and physical 162
radioactive decay. The counting time was adjusted to obtain a propagated counting error less 163
than 5% (Warnau et al., 1999). 164
165
2.2. Field study 166
167
Ten P. maximus were collected by SCUBA diving in 2 different locations the Bay of 168
Seine in July 2004: a site near the estuary (49°35’0” N ; 0°10’0” W) which is known to be 169
contaminated by chemicals, and a reference site (49°33’0” N ; 1°0’0” W) located far from the 170
Seine river mouth in the western part of the Bay (Gilliers et al., 2006). 171
Scallops were frozen on board (-20°C) and dissected immediately upon return to the 172
laboratory in order to separate the digestive gland, gills, kidneys, gonad and adductor muscle; 173
the other tissues and organs constituted the remaining soft tissues. All dissected tissue 174
samples were freeze-dried and grounded to powder. Two aliquots (ca. 150 mg dry wt) of each 175
tissue were treated as described above to separate the soluble and insoluble subcellular 176
fractions according to the method of Bustamante and Miramand (2005). 177
Metallothionein-like protein (MT) concentrations were determined in heat-treated 178
supernatants by differential pulse polarography, which allows quantifying the cysteinic 179
residues (Thompson and Cosson, 1984; Temara et al., 1997). Polarographic measurements 180
were carried out with a PARC Model 174A analyzer and a PARC EG&G Model 303 static 181
mercury drop electrode (SMDE). Standard quantification of MTs was based on rabbit liver 182
metallothionein (Sigma, M-7641) by the standard addition method. MT concentrations in 183
scallop tissues were expressed as µg g-1 dry wt. 184
In addition, Ag was analysed in supernatants and pellets after acidic digestion with 4:1 185
(v:v) ultrapure 65% HNO3 and 70% HClO4 at 80°C for 2 d. The acids were then evaporated
186
until dryness and the residues were dissolved in 0.3 N ultrapure 65% HNO3. Metal analyses
187
were carried out using an atomic absorption spectrophotometer Hitachi Z-5000 with Zeeman 188
background correction. Reference tissues, dogfish liver (DOLT-3, NRCC) and lobster 189
hepatopancreas (TORT-2, NRCC) were treated and analysed in the same way as the samples. 190
Results were in good agreement with the Ag certified values: recoveries ranged from 93 to 191
106% (n = 10). Detection limit was 0.005 µg Ag g-1 dry wt. Ag concentrations in scallop 192
tissues were expressed as µg g-1 dry wt. 193
194
2.3. Data analysis 195
196
Uptake and depuration kinetics of the different exposure experiments were fitted using the 197
kinetic models and statistical methods as described by Warnau et al. (1996a,c) and Metian et 198
al. (2007). 199
The relative contribution of each uptake pathway was determined using the global 200
bioaccumulation model originally proposed by Thomann (1981) and Landrum et al. (1992),
201
and further used and developed by other authors (e.g., Thomann et al., 1995; Wang et al.,
202
1996; Reinfelder et al., 1998; Metian et al., JEMBE or MEPS), in which three different uptake 203
pathways (seawater, food and sediment) were considered. In this model, the introduction of 204
the term A0l allowed considering only the fraction of the metal that was actually incorporated
205
by the organisms exposed via seawater, sediment and food. The metal concentrations in 206
sediment and food were calculated using their distribution coefficients (Kd and Kdf,
207
respectively). The concentration in sediment, Cs (Bq g -1
wet wt) was determined according to 208 the relation: 209 210 Cs = Cw Kd (eq.1) 211 212
where Cw is the concentration of the radiotracer in experimental spiked seawater (Bq l-1) and
213
Kd the Ag distribution coefficient in sediment according to IAEA (2004).
214
The concentration in the phytoplankton strains, Cf (Bq g-1 wet wt) was determined
215
according to the relation: 216
217
Cf = Cw Kdf (eq.2)
218 219
where Kdf is the Ag distribution coefficient in the phytoplankton strain (S. costatum or I.
220
galbana) that was measured in our experiments. 221
Total Ag concentration in the organisms (i.e. the sum of each concentration resulting from 222
the uptake through the different pathways) was defined as: 223
224
Ct = Cw,ss +Cs,ss +Cf,ss (eq.3)
225
Supprimé : developed by Landrum et al. (1992) and reviewed by Thomann et al. (1995) and Wang et al. (1996)
226
where Cw,ss, Cs,ss and Cf,ss are the steady-state metal concentrations (Bq g-1) in scallops
227
resulting from uptake via seawater, sediment and food, respectively. The latter were computed 228
according to the relations: 229
230
Cw,ss = (A0l,w ku,w Cw) / ke,w (eq.4)
231 232
Cs,ss = (A0l,s ku,s Cs) / ke,s (eq.5)
233 234
Cf,ss = (AE IR Cf) / ke,f (eq.6)
235 236
where A0l is the metal fraction (%) strongly retained in scallop tissues, ku is the uptake arte
237
constant (d-1), ke is the depuration rate constant (d-1), AE is the metal assimilation efficiency
238
from food (i.e., A0l,f ; %), and IR is the ingestion rate (gg-1d-1), and where w, s, and f
239
subscripts refer to seawater, sediment and food as exposure source, respectively. 240
The relative contributions of the three pathways (dissolved, sediment and food) were then 241
assessed according to the following relations: 242 243 % seawater = Cw,ss / (Cf,ss + Cs,ss + Cw,ss) (eq.7) 244 245 % sediment = Cs,ss / (Cf,ss + Cs,ss + Cw,ss) (eq.8) 246 247 % food = Cf,ss / (Cf,ss + Cs,ss + Cw,ss). (eq.9) 248 249
In the field study, one-way ANOVA was used to test for differences among Ag and MT 250
concentration data using the corresponding routines in the software Statistica® 6.1. Level of 251
significance for the statistical analyses was always set at α = 0.05%. 252 253 3. Results 254 255 3.1. Laboratory experiments 256 257
3.1.1 Exposure via seawater 258
259
The whole-body uptake kinetics of 110mAg in P. maximus were best fitted by a first-order 260
saturation exponential equation (R2 = 0.71). The kinetics and the estimates of its parameters 261
and associated statistics are shown in Figure 1a. Although the steady-state was not reached 262
during the time course of the experiment, the concentration factor at steady-state could be 263
estimated with reasonable precision (CFss = 801 ± 164). After 7 d of exposure, the measured
264
CF7d was 620 ± 210 in the whole-body individuals, 3,740 ± 1,020 in the whole soft parts,
265
56,600 ± 13,400 in the digestive gland and 4,440 ± 3,110 in the gills (data not shown). At the 266
end of the uptake period, 110mAg was mainly located in the soft tissues (98 ± 2% of the total 267
110m
Ag content), among which the digestive gland contained the major part of the tracer (71 ± 268
7%), followed by the gills (13 ± 7%) (Fig. 2). 269
During the 36-d depuration period following seawater exposure, the whole-body 270
depuration kinetics of 110mAg was best described by a bi-exponential equation (R2 = 0.22; Fig. 271
1a). The results showed that the major part of 110mAg was efficiently incorporated (A0l = 82%)
272
and strongly retained in the tissues of P. maximus (biological half-life not significantly 273
different from infinite). At the end of the depuration period, the body distribution of 110mAg 274
indicated that the digestive gland stored the main part of the total body 110mAg (80 ± 8%), as 275
previously observed at the end of the uptake phase (71 ± 7%) (Fig. 2). 276
277 278
3.1.2. Exposure via the sediment 279
280
The whole-body uptake kinetics of 110mAg bound to sediments were best fitted by a first 281
order saturation exponential equation (R2 = 0.81) that reached a steady-state equilibrium after 282
ca. 10 d of exposure (Figure 1b). TF13d in toto and in the whole soft parts were 0.22 ± 0.07
283
and 0.69 ± 0.19, respectively. Among the different organs and tissues, the highest TF13d was
284
found for the digestive gland (11.8 ± 4.9), which contained 65 ± 13% of the whole-body 285
110m
Ag activity (Fig. 2). 286
The whole-body depuration kinetics after exposure via spiked sediment were best 287
described by a mono-exponential equation (R2 = 0.64; Fig. 2). The results indicated that 90% 288
of 110mAg previously bioaccumulated were efficiently retained, with a biological half-life of 289
40 d. At the end of the 31-d depuration period, the body distribution of 110mAg clearly showed 290
that the major part of the metal (ca. 66 ± 8%) was distributed in the digestive gland, the latter 291
proportion being not significantly different to that observed at the end of the exposure period 292
(Fig. 2). 293
294
3.1.3. Exposure via the food 295
296
Prior to feeding the scallops with one out of the two selected diets (Skeletonema costatum 297
or Isochrysis galbana strain), the phytoplankton cultures were exposed to 110mAg for 7 and 10 298
d, respectively. At the end of the exposure period, the distribution coefficient between 299
phytoplankton and water (Kdf) was determined in order to assess the efficiency of their
300
affinity for Ag. Kdf was 6.86 105 for S. costatum and 4.43 104 for I. galbana.
In addition, the preliminary assessment of the ingestion rate (IR) of phytoplankton 302
indicated that P. maximus ingested both S. costatum and I. galbana with similar (p = 0.01) 303
rates, i.e. IR = 0.0404 gg-1 d-1. 304
Following the pulse-chase feeding using either S. costatum or I. galbana as food, the 305
whole-body depuration kinetics of 110mAg were best fitted using a bi-exponential equation (R2 306
= 0.46 for S. costatum and 0.93 for I. galbana) (Fig. 1c). The assimilation efficiency (AE) of 307
110m
Ag ingested with food was higher when scallops were fed S. costatum than I. galbana (i.e. 308
AE = 72 vs. 33%). Furthermore, when ingested with S. costatum, the tracer was much 309
strongly retained in P. maximus tissues (Tb½l not different from infinite; Fig. 1c1) than when
310
ingested with I. galbana (Tb½l = 11d; Fig. 1c2). 110mAg was mainly distributed in the digestive
311
gland (> 93%) with both food sources (Fig. 2). 312
313
3.1.4. Subcellular distribution 314
315
For all three exposure modes, 110mAg was always mainly associated with the insoluble 316
subcellular fraction of the digestive gland cells (84 to 98%; see Fig. 2). 317
318
3.1.5. Global bioaccumulation model 319
320
In order to assess the relative contribution of each uptake pathway to the global Ag 321
accumulation in P. maximus, the different kinetic parameters obtained for the three exposure 322
modes to Ag (seawater, food, and sediment) were used to feed a global bioaccumulation 323
model (see section 2.3.) along with other parameters such as the distribution coefficient of Ag 324
in sediment (Kd = 2 104; IAEA, 2004), the Ag Kdf in phytoplankton strains (Kdf = 6.86 105 for
325
S. costatum and 4.43 104 for I. galbana; present study) and the ingestion rate of phytoplankton 326
in scallops (IR = 0.0404 g g-1d-1 for both strains; present study). 327
Results of the computations are shown in Figure 3. Most interestingly, the phytoplankton 328
strain used as food source strongly influenced the modelling results. In fact, the latter food 329
source was actually driving the outcomes of the modelling and the computations were thus 330
performed considering one or the other phytoplankton strain. With S. costatum, the feeding 331
pathway was by far the major contributor (98%) to the global bioaccumulation of Ag in P. 332
maximus (Fig. 3a), whereas seawater was the main contributor (63%) followed by sediment 333
(28%) when the scallops were fed I. galbana (Fig. 3b). 334
335
3.2. Field study 336
337
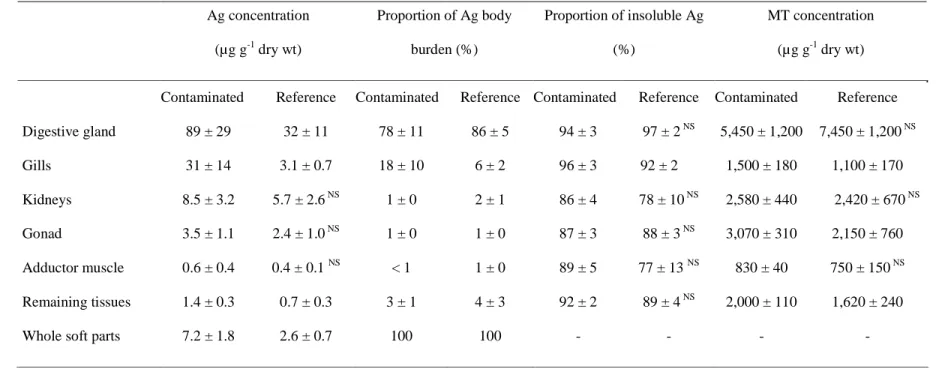
Concentrations of Ag in the tissues and organs of P. maximus collected from the two 338
sampling sites are given in Table 1. Scallops from the contaminated zone showed 339
significantly higher (p = 0.004) Ag concentrations in their whole soft tissues than that from 340
the reference site. Such a difference was also significant for the digestive gland (p = 0.004), 341
the gills (p = 0.0001) and the remaining tissues (p = 0.004). In both sites, the highest Ag 342
concentrations and loads were found in the digestive gland and the lowest in the gonad and 343
the adductor muscle (Table 1). 344
In all the tissues and organs analysed, Ag was mainly associated with the insoluble 345
subcellular fraction, which contained from 77% (adductor muscle) up to 97% (digestive 346
gland) of the metal (Table 1). Interestingly, the subcellular distribution of Ag was not 347
significantly different between the two sites for all organs and tissues but the gills (p = 0.01) 348
(Table 1). 349
The concentrations in metallothionein-like proteins varied from 750 µg g-1 dry wt in the 350
adductor muscle up to 7,450 µg g-1 dry wt in the digestive gland (Table 1). The concentrations 351
were only significantly different between the two sites for the gills (p = 0.007), gonad (p = 352
0.041) and remaining tissues (p = 0.013), with the contaminated site showing the highest 353 values. 354 355 356 4. Discussion 357 358
Important Ag releases in the Bay of Seine occur through the Seine River which is one of 359
the most heavily contaminated rivers in Europe (Roux et al., 2001). The average Ag 360
concentrations measured in this study in the whole soft tissues of Pecten maximus from the 361
Bay of Seine ranged from 2.6 to 7.2 µg g-1 dry wt). The digestive gland, gills and remaining 362
tissues of the scallops collected in the vicinity of the estuary (i.e. the contaminated site) 363
displayed Ag concentrations that were two to ten times higher than those from the reference 364
site (Table 1). This spatial variation of Ag concentrations in scallop tissues has already been 365
reported in other species such as Chlamys varia, which was therefore considered as a good 366
biomonitor species for this metal (Bustamante and Miramand, 2005) and thus for urban 367
contamination. Indeed, Ag is generally considered as a reliable proxy for domestic inputs in 368
coastal waters due to Ag-enrichment in the sewage sludge from coastal cities (e.g., Sañudo-369
Wilhelmy and Flegal, 1992; Luoma et al., 1995; Andren and Bober, 2002). 370
Data on Ag concentrations have been reported for several scallop species such as Hinnites 371
giganteus (Young and Jan, 1979), C. varia (Bustamante and Miramand, 2005), 372
Comptopallium radula (Metian et al., 2008), and P. maximus (Segar et al., 1971; Bryan, 373
1973). The highest Ag concentrations were generally found in the digestive gland of these 374
scallop species. 375
The digestive gland of the scallops collected at the reference and contaminated sites of the 376
Bay of Seine displayed mean Ag concentrations of 32 and 89 µg g-1 dry wet, respectively. In 377
the contaminated site, these digestive gland concentrations were rather elevated in comparison 378
to data from the literature for P. maximus. Indeed, mean values previously reported were 8.9 379
and 13.6 µg g1 dry wt from the Irish Sea and from the English Channel, respectively (Segar et 380
al., 1971; Bryan, 1973). However, in other scallop species, values ranged from 30 to 77 µ g g1 381
dry wt (Bryan, 1973; Mauri et al., 1990; Bustamante and Miramand, 2004). 382
The gills of P. maximus from the contaminated site displayed very high Ag concentrations 383
viz. similar to those measured in the digestive gland from the reference site. This strongly 384
suggests that an important incorporation of the metal occurred through the dissolved pathway. 385
Indeed, this organ is well-known to play a key role in dissolved metal accumulation in marine 386
filter-feeders (Rainbow, 1990). This assumption is well supported by our laboratory 387
experiments showing that P. maximus efficiently concentrated waterborne Ag (CF7d > 3,700
388
in the whole soft parts). Uptake of dissolved Ag might occur in all the soft parts in direct 389
contact with seawater, particularly at sites with high permeability such as the gills (Rainbow, 390
1990). However, in our experiments, most of the radiotracer (> 70%) was found in the 391
digestive gland, which showed very high CF (> 56,000), even after a short exposure time of 7 392
d. This strongly suggests that translocation of the metal occurred from the tissues in direct 393
contact with seawater (gills) towards the digestive gland, where the metal would have been 394
detoxificated and stored. Interestingly, although uptake of Ag bound to sediment was weak 395
(TF13d in whole soft parts = 0.69 ± 0.19), most of the metal was found in the digestive gland
396
after 13 d of exposure (65 ± 13%). TFs in scallop tissues were far lower (by approximately 3 397
orders of magnitude) than CFs calculated from seawater exposure, indicating that sediment-398
bound Ag is poorly bioavailable to P. maximus. This is consistent with results reported for 399
other bivalve species, for example in oysters of the genus Crassostrea (Abbe and Sanders, 400
1990, Ettajani et al., 1992). 401
The major role of the digestive gland in Ag bioaccumulation and detoxification was 402
especially evidenced by results of the trophic transfer experiments. When scallops were fed S. 403
costatum and I. galbana, their digestive gland contained most of the metal remaining at the 404
end of the depuration period (90 and 70%, respectively). However, both the assimilation 405
efficiency (AE, %) and the retention capacity (Tb½, d) of the metal strongly depended on the
406
phytoplankton strain used as food source, i.e. 72% and 268 d for S. costatum and 33% and 11 407
d, for I. galbana. Elevated AEs of Ag ingested with S. costatum could be due to the storage of 408
the metal under bioavailable forms in the cytoplasm of the phytoplankton cells (Reinfelder 409
and Fisher, 1991; Wang et al., 1996; Reinfelder et al. 1997). However, the gut residence time 410
that appears to be longer for S. costatum than for I. galbana (see the much faster initial 411
decrease in depuration kinetics after feeding on I. galbana; Fig. 1c) could also influence the 412
metal assimilation efficiency (Wang and Fisher, 1996). 413
Seawater, sediment and food exposures all resulted in important Ag bioaccumulation in 414
the digestive gland of P. maximus, in which the metal was always associated mainly with 415
insoluble subcellular compounds whatever the exposure pathway, i.e. from 84 to 98% of the 416
total Ag (see Fig. 2). In wild scallops from the Bay of Seine, Ag was similarly mainly 417
associated with the insoluble subcellular fraction of the digestive gland cells of P. maximus 418
collected in both the reference site and the contaminated one. No clear relationships were 419
observed between Ag concentrations or subcellular distribution and MT concentrations (see 420
Table 1). In particular, distribution of Ag in the subcellular soluble fraction (where MTs are 421
located; Thompson and Cosson, 1984) was much higher (2 to 7 times) in adductor muscle 422
than in digestive gland, although the muscular MT content was one order of magnitude lower 423
than in digestive gland. This would suggest that, if any, the MTs are only slightly contributing 424
to Ag sequestration and subcellular distribution in scallop tissues, which is in agreement with 425
previously observations indicating that, in the digestive gland of bivalves, Ag was associated 426
with lysosomes and partially combined with mineral or organic sulphurs within the 427
connective tissues (Bryan, 1973; Ballan-Dufrançais et al., 1985; Berthet et al., 1992). 428
In the natural environment, the three contamination pathways studied here occur and 429
contribute simultaneously to the global bioaccumulation of the metal in the organisms. 430
Through the use of the kinetic parameters that we obtained experimentally, along with 431
published Kd for sediments (IAEA, 2004) and Kdf and IR that we measured, the delineation of
432
the relative contribution of the three exposure pathways has been assessed, using the model 433
developed by Landrum (1992) that we adapted to take into account the three uptake routes. 434
The results showed that food quality played a major role in determining the major route(s) of 435
Ag accumulation in P. maximus (Figure 3). With a Si-walled diatom (S. costatum) as food 436
source, the dietary pathway was the main pathway of Ag uptake (98%) whereas when 437
scallops were fed a naked flagellate (I. galbana), the major contribution of the metal came 438
from seawater (63%) and secondarily from sediment (28%). The difference in the outcomes 439
of the two runs of the model are due to the higher Kdf, AE and Tb½ characterising Ag ingested
440
with S. costatum. The information available in the literature regarding diet composition of 441
scallops in the wild is scarce. It mainly reports that the diet of wild scallops is complex and 442
can display quite large variations both in space and time (e.g., Mikulich and Tsikhon-443
Lukamina, 1981; Shumway et al., 1987; Grant and Cranford, 1991). Hence, without proper 444
characterisation of this diet, it still appears rather premature to use the modelling approach to 445
explain the observations from the field. Nevertheless, the bioaccumulation model that we used 446
here allowed considering the sediment pathway separately for the first time. Sediment was 447
expected to be an important pathway of contamination for P. maximus, since: 1) it is living at 448
the seawater-sediment interface and thus can accumulate sediment-bound metals either 449
directly by contact with the mantle and tentacles when deployed (filtering posture) or 450
indirectly after desorption and release to the seawater or porewater, 2) it filters and ingests 451
metal-rich particles from both the water column and the sediment surface (Shumway et al., 452
1987) and 3) sediment generally displays metal concentrations that are several orders of 453
magnitude higher than those reported in seawater (e.g., Luoma, 1989). However, the model 454
clearly showed that sediment had a minor contribution in Ag bioaccumulation in P. maximus. 455
Acknowledgements 457
458
The IAEA is grateful for the support provided to its Marine Environment Laboratories by 459
the Government of the Principality of Monaco. This work was supported by the IAEA, GIP 460
Seine-Aval and LIENSs (CNRS-Université de la Rochelle). MW is an Honorary Senior 461
Research Associate of the National Fund for Scientific Research (NFSR, Belgium) and holds 462
a 2008 Invited Expert position at LIENSs, supported by the Conseil Régional de Poitou-463
Charentes. We thank B. Ernande, J. Morin and E. Foucher (IFREMER, Port en Bessin) and P. 464
Morinière from the Aquarium de La Rochelle for their help in scallop collection. 465
466
References 467
468
Abbe, G.R., Sanders, J.G., 1990. Pathways of silver uptake and accumulation by the 469
American oyster (Crassostrea virginica) in Chesapeake Bay. Estuar. Coast. Mar. Sci. 31, 470
113-123. 471
Andren, A.W., Bober, T.W., 2002. Silver in the environment: transport, fate and effects. 472
SETAC Press, Pensacola. 473
Ballan-Dufrançais, C., Jeantet, A.Y., Feghali, C., Halpern, S., 1985. Physiological features of 474
heavy metal storage in bivalve digestive cells and amoebocytes: EPMA and factor 475
analysis of correspondences. Biol. Cell. 53, 283-292. 476
Berthet, B., Amiard, J.-C., Amiard-Triquet, C., Martoja, R., Jeantet, A.Y., 1992. 477
Bioaccumulation, toxicity and physico-chemical speciation of silver in bivalve molluscs: 478
ecotoxicological and health consequences. Sci. Total Environ. 125, 97-122. 479
Brooks, R.R., Rumsby, M.G., 1965. The biogeochemistry of trace element uptake by some 480
New Zealand bivalves. Limnol. Oceanogr. 10, 521-527. 481
Bryan, G.W., 1973. The occurrence and seasonal variation of trace metals in the scallops 482
Pecten maximus (L.) and Chlamys opercularis (L.). J. Mar. Biol. Assoc. UK 53, 145-16. 483
Bryan, G.W., 1985. Bioavailability and effects of heavy metals in marine deposits. In: 484
Ketchum, B.H., Capuzzo, J.M., Burt, W.V., Duedall, P.K., Kester, D.R. (Eds), Wastes in 485
the ocean, vol. 6, Nearshore Waste disposal. John Wiley & Sons, New York, pp. 42-79. 486
Bustamante, P., Miramand, P., 2004. Interspecific and geographical variations of trace 487
element concentrations in Pectinidae from European waters. Chemosphere 57, 1355-1362. 488
Bustamante, P., Miramand, P., 2005. Subcellular and body distributions of 17 trace elements 489
in the variegated scallop Chlamys varia from the French coast of the Bay of Biscay. Sci. 490
Total Environ. 337, 59-73. 491
Danis, B., Bustamante, P., Cotret, O., Teyssié, J.L., Fowler, S.W., Warnau, M., 2005. 492
Bioaccumulation of PCBs in the cuttlefish Sepia officinalis from sea water, sediment and 493
food pathways. Environ. Pollut. 134, 113-122. 494
Eisler, R., 1996. Silver hazards to fish, wildlife, and invertebrates: a synoptic review. 495
Contaminant Hazard Reviews n°32. USGS Patuxent Wildlife Research Center, Laurel. 496
Ettajani, H., Amiard-Triquet, C., Amiard J.-C., 1992. Etude expérimentale du transfert de 497
deux éléments traces (Ag, Cu) dans une chaîne trophique marine: Eau - Particules 498
(sédiment natural, microalgue) - Mollusques filtreurs (Crassostrea gigas Thunberg). 499
Water Air Soil Pollut. 65, 215-236. 500
Gilliers, C., Le Pape, O., Désaunay, Y., Morin, J., Guérault, D., Amara, R., 2006. Are growth 501
and density quantitative indicators of essential fish habitat quality? An application to the 502
common sole Solea solea nursery grounds. Estuar. Coast. Shelf Sci. 69, 96-106. 503
Gorsuch, J.W., Kramer, J.R., La Point, T.W. (Eds), 2003. Silver: environmental transport, 504
fate, and models: papers from Environmental Toxicology and Chemistry, 1983-2002. 505
SETAC Press, Pensacola. 506
Grant, J., Cranford, P.J., 1991. Carbon and nitrogen scope for growth as a function of diet in 507
the sea scallop Placopecten magellanicus. J. Mar. Biol. Assoc. UK 71, 437-450. 508
IAEA, 2004. Sediments distribution coefficients and concentration factors for biota in the 509
marine environment. International Atomic Energy Agency, Vienna. 510
Landrum, P.F., Lee, H., Lydy, M.J., 1992. Toxicokinetics in aquatic systems: model 511
comparisons and use in hazard assessment. Environ. Toxicol. Chem. 11, 1709-1725. 512
Luoma, S.N., 1989. Can we determine the biological availability of sediment-bound trace 513
elements? Hydrobiologia 176/177, 379-396. 514
Luoma, S.N., Bo, Y.B., Bryan, G.W., 1995. Fate, bioavailability and toxicity of silver in 515
estuarine environments. Mar. Pollut. Bull. 31, 44-54. 516
Martoja, M., Truchet, M., Berthet, B., 1989. Effets de la contamination expérimentale par 517
l'argent chez Chlamys varia L. (bivalve Pectinidé). Données quantitatives et histologiques 518
et microanalytiques. Ann. Inst. Oceanogr. Paris 65, 1-13. 519
Mauri, M., Orlando, E., Nigro, M., Regoli, F., 1990. Heavy metals in the Antarctic scallop 520
Adamussium colbecki. Mar. Ecol. Prog. Ser. 67, 27-33. 521
Metayer, C., Amiard-Triquet, C., Baud, J.P., 1990. Species-related variations of silver 522
bioaccumulation and toxicity to three marine bivalves. Water Res. 24, 995-100. 523
Metian, M., Bustamante, P., Hédouin, L., Warnau, M., 2008. Accumulation of trace elements 524
in the tropical scallop Comptopallium radula from coral reefs in New Caledonia. Environ. 525
Pollut. 152, 543-552. 526
Metian, M., Warnau, M., Oberhänsli, F., Teyssié, J.L., Bustamante, 2007. Interspecific 527
comparison of Cd bioaccumulation in European Pectinidae (Chlamys varia & Pecten 528
maximus). J. Exp. Mar. Biol. Ecol. 353: 58-67. 529
Mikulich, L.V., Tsikhon-Lukamina, A., 1981. Food of the scallop. Oceanology 21, 633–635. 530
Ponzano, E., Dondero, F., Bouquegneau, J.M., Sack, R., Hunziker, P., Viarengo, A., 2001. 531
Purification and biochemical characterization of a cadmium metallothionein from the 532
digestive gland of the Antarctic scallop Adamussium colbecki (Smith, 1902). Polar Biol. 533
24, 147-153. 534
Rainbow, PS, 1990. Heavy metal concentration in marine invertebrates. In: Furness, R.W., 535
Rainbow, P.S. (Eds), Heavy metals in the marine environment. CRC Press, Boca Raton, 536
pp. 67-79. 537
Ratte, H.T., 1999. Bioaccumulation and toxicity of silver compounds: a review. Environ. 538
Toxicol. Chem. 18, 89-108. 539
Reinfelder, J.R., Fisher, N.S., 1991. The assimilation of elements ingested by marine 540
copepods. Science 251, 794-796. 541
Reinfelder, J.R., Wang, W.-X., Luoma, S.N., Fisher, N.S., 1997. Assimilation efficiencies and 542
turnover rates of trace elements in marine bivalves: a comparison of oysters, clams and 543
mussels. Mar. Biol. 129, 443-452. 544
Rodriguez y Baena, A.M., Metian, M., Teyssié, J.L., De Broyer, C., Warnau, M., 2006. 545
Experimental evidence for 234Th bioaccumulation in three Antarctic crustaceans: Potential 546
implications for particle flux studies. Mar. Chem. 100, 354-365. 547
Roux, N., Chiffoleau, J.-F., Claisse, D., 2001. L'argent, le cobalt, le nickel et le vanadium 548
dans les mollusques du littoral français. In: RNO (Ed.), Surveillance du milieu marin, 549
travaux du RNO-Edition 2001. IFREMER, Nantes, pp. 11-20. 550
Sañudo-Wilhelmy, S.A., Flegal, R., 1992. Anthropogenic silver in the southern California 551
bight: a new tracer of sewage in coastal waters. Environ. Sci. Technol. 26, 2147-2151. 552
Segar, D.A., Collins, J.D., Riley, J.P., 1971. The distribution of the major and some minor 553
elements in marine animals. Part II. Molluscs. J. Mar. Biol. Assoc. UK 51, 131-136. 554
Shumway, S.E., Selvin, R., Schick, D.F., 1987. Food resources related to habitat in the scallop 555
Placopecten magellanicus (Gmelin, 1791): a qualitative study. J. Shellfish Res. 6, 89-95. 556
Temara, A., Warnau, M., Dubois, P, Langston, W.J., 1997. Quantification of metallothioneins 557
in the common asteroid Asterias rubens (Echinodermata) exposed experimentally or 558
naturally to cadmium. Aquat. Toxicol. 38, 17-34. 559
Thomann, R.V., Mahony, J.D., Mueller, R., 1995. Steady-state model of biota sediment 560
accumulation factor for metals in two marine bivalves. Environ. Toxicol. Chem. 14, 1989-561
1998. 562
Thompson, J.A.J., Cosson, R.P., 1984. An improved electrochemical method for the 563
quantification of metallothioneins in marine organisms. Mar. Environ. Res. 11, 137-152. 564
Viarengo, A., Canesi, L., Massu-Cotelli, A., Ponzano, E., Orunesu, M., 1993. Cu, Zn, Cd 565
content in different tissues of the Antarctic scallop Adamussium colbecki (Smith 1902), 566
role of metallothionein in the homeostasis and in the detoxification of heavy metals. Mar. 567
Environ. Res. 35, 216-217. 568
Wang, W.-X., Fisher, N.S., 1996. Assimilation of trace elements and carbon by the mussel 569
Mytilus edulis: effects of food composition. Limnol. Oceanogr. 41, 197-207. 570
Wang, W.-X., Fisher, N.S., Luoma, S.N., 1996. Kinetic determinations of trace element 571
bioaccumulation in the mussel Mytilus edulis. Mar. Ecol. Prog. Ser. 140, 91-113. 572
Warnau, M., Fowler, S.W., Teyssié, J.L., 1996a. Biokinetics of selected heavy metals and 573
radionuclides in two marine macrophytes: the seagrass Posidonia oceanica and the alga 574
Caulerpa taxifolia. Mar. Environ. Res. 41, 343-362. 575
Warnau, M., Iaccarino, M., De Biase, A., Temara, A., Jangoux, M., Dubois, P., Pagano, G., 576
1996b. Spermiotoxicity and embryotoxicity of heavy metals in the echinoid Paracentrotus 577
lividus. Environ. Toxicol. Chem. 15, 1931-1936. 578
Warnau, M., Teyssié, J.L., Fowler, S.W., 1996c. Biokinetics of selected heavy metals and 579
radionuclides in the common Mediterranean echinoid Paracentrotus lividus: sea water 580
and food exposures. Mar. Ecol. Prog. Ser. 141, 83-94. 581
Warnau, M., Fowler, S.W., Teyssié, J.L., 1999. Biokinetics of radiocobalt in the asteroid 582
Asterias rubens (Echinodermata): sea water and food exposures. Mar. Pollut. Bull. 39, 583
159-164. 584
Young, D.R., Jan, T.-K., 1979. Trace metal contamination of the rock scallop, Hinnites 585
giganteus, near a large Southern California municipal outfall. Fish. Bull. NOAA 76, 936-586
939. 587
Captions to Figures 588
589
Fig. 1. Uptake and depuration kinetics of 110mAgin Pecten maximus: (a) seawater pathway 590
(mean concentration factor ± SD, n = 13 and mean % remaining activity ± SD, n = 9), (b) 591
sediment pathway (mean transfer factor ± SD, n = 14 and mean % remaining activity ± SD, n 592
= 10), and (c) food pathway (mean % remaining activity ± SD, n = 9) via two phytoplankton 593
strains, (c1) Skeletonema costatum and (c2) Isochrysis galbana. 594
Uptake parameters. CFss: concentration factor at steady state; TFss: transfer factor at steady
595
state; ku: uptake rate constant (d -1
). 596
Depuration parameters (long-lived component). A0l: activity (%) lost according to the
long-597
lived component; kel: depuration rate constant (d-1); Tb½l: biological half-life (d), R²:
598
determination coefficient; *: parameters not significantly different (p > 0.05) from 0 (kel) or
599
from the infinite (Tb½l).
600 601
Fig. 2. 110mAg distribution (mean % ± SD; n = 4) among the different body compartments of 602
Pecten maximus exposed via: (a) seawater (end of uptake and depuration periods), (b) 603
sediment (end of uptake and depuration periods) and (c) the food (end of the depuration after 604
feeding on Skeletonema costatum -SKE- and Isochrysis galbana -ISO). 605
606
Fig. 3. Relative contribution of the different exposure pathways to global Ag bioaccumulation 607
in Pecten maximus when (a) Isochrysis galbana or (b) Skeletonema costatum are considered 608
as food source. 609
Table 1. Pecten maximus. Concentration (mean ± SD; µg g-1 dry wt; n = 10), tissue distribution (mean ± SD; %; n = 10), proportion of Ag 610
associated to insoluble compounds (mean ± SD;% ; n = 10) and metallothionein-like protein (MT) concentrations (mean ± SD; µg g-1 dry 611
wt; n = 10) in scallops from a contaminated and a reference sites in the Bay of Seine. 612 613 Ag concentration (µg g-1 dry wt) Proportion of Ag body burden (%) Proportion of insoluble Ag (%) MT concentration (µg g-1 dry wt)
Contaminated Reference Contaminated Reference Contaminated Reference Contaminated Reference
Digestive gland 89 ± 29 32 ± 11 78 ± 11 86 ± 5 94 ± 3 97 ± 2 NS 5,450 ± 1,200 7,450 ± 1,200 NS Gills 31 ± 14 3.1 ± 0.7 18 ± 10 6 ± 2 96 ± 3 92 ± 2 1,500 ± 180 1,100 ± 170 Kidneys 8.5 ± 3.2 5.7 ± 2.6 NS 1 ± 0 2 ± 1 86 ± 4 78 ± 10 NS 2,580 ± 440 2,420 ± 670 NS Gonad 3.5 ± 1.1 2.4 ± 1.0 NS 1 ± 0 1 ± 0 87 ± 3 88 ± 3 NS 3,070 ± 310 2,150 ± 760 Adductor muscle 0.6 ± 0.4 0.4 ± 0.1 NS < 1 1 ± 0 89 ± 5 77 ± 13 NS 830 ± 40 750 ± 150 NS Remaining tissues 1.4 ± 0.3 0.7 ± 0.3 3 ± 1 4 ± 3 92 ± 2 89 ± 4 NS 2,000 ± 110 1,620 ± 240
Whole soft parts 7.2 ± 1.8 2.6 ± 0.7 100 100 - - - -
NS: non significant difference between contaminated and reference sites (p > 0.05) 614
(a)
Seawater
pathway
C o n ce n tr at io n F ac to r 1 3 5 7 9 11 13 15 0 200 400 600 800 1000 R ema in in g A ct iv it y ( % ) 0 10 20 30 40 0 20 40 60 80 100 Time (d) Time (d) (b)Sediment
pathway
T ra n sf er F ac to r 1 3 5 7 9 11 13 15 0.00 0.05 0.10 0.15 0.20 0.25 0.30 R ema in in g A ct iv it y ( % ) 0 10 20 30 40 0 20 40 60 80 100 Time (d) Time (d) (c)Food
pathway
(c1) Skeletonema costatum (c2) Isochrysis galbana
R ema in in g A ct iv it y ( % ) 0 2 4 6 8 10 12 14 16 18 20 22 0 20 40 60 80 100 R ema in in g A ct iv it y ( % ) 0 2 4 6 8 10 12 14 16 18 20 22 0 20 40 60 80 100 Time (d) Time (d) Fig. 1 CFss= 801 ± 164 ku= 172 ± 26 d-1 R²= 0.71 85 ± 2 % 0.002 ± 0.002 d-1 A0l T b½ l R²= kel = = = 426 d NS 0.22 TFss= 0.21 ± 0.01 ku= 0.07 ± 0.01 d-1 R² = 0.81 90 ± 2 % 0.018 ± 0.002 d-1 40 ± 4 d 0.64 A0l T b½ l R² = kel = = = A0l = 72 ± 3 % T b½ l= 268 d NS R² = 0.46 kel = 0.003 ± 0.003 d-1 A0l = 33 ± 3 % T b½ l= 11 ± 3 d R²= 0.93 kel = 0.062 ± 0.016 d-1
0%
20%
40%
60%
80%
100%
uptake (7d)
loss (36d)
uptake (13d)
loss (31d)
loss ISO (16d)
loss SKE (21d)
S
ea
w
at
er
S
ed
im
en
t
F
o
o
d
Remaining tissues
Adductor muscle
Mantle
Foot
Gonad
Intestine
Kidneys
Gills
Digestive gland
Tissular distribution (%) Insoluble fraction
in digestive gland (%)
………… 92 ± 2
………… 84 ± 8
………… 97 ± 3
………… 94 ± 1
………… 98 ± 1
………… 93 ± 2
1 2 3 4 5 Fig. 2 6(b) S. costatum
Food Seawater Sediment
(a) I. galbana
(b) S. costatum
Food Seawater Sediment