HAL Id: hal-00965908
https://hal.archives-ouvertes.fr/hal-00965908
Submitted on 25 Mar 2014HAL is a multi-disciplinary open access
archive for the deposit and dissemination of sci-entific research documents, whether they are pub-lished or not. The documents may come from teaching and research institutions in France or abroad, or from public or private research centers.
L’archive ouverte pluridisciplinaire HAL, est destinée au dépôt et à la diffusion de documents scientifiques de niveau recherche, publiés ou non, émanant des établissements d’enseignement et de recherche français ou étrangers, des laboratoires publics ou privés.
Modeling of the multiscale dispersion of nanoparticles in
a hematite coating
Enguerrand Couka, François Willot, Dominique Jeulin, Mona Ben Achour,
Anthony Chesnaud, Alain Thorel
To cite this version:
Enguerrand Couka, François Willot, Dominique Jeulin, Mona Ben Achour, Anthony Chesnaud, et al.. Modeling of the multiscale dispersion of nanoparticles in a hematite coating. Journal of Nanoscience and Nanotechnology, American Scientific Publishers, 2015, 15 (5), pp. 3515-3521(7). �10.1166/jnn.2015.9855�. �hal-00965908�
Modeling of the multiscale dispersion of nanoparticles in a hematite coating
E. Couka
1, F. Willot
1, D. Jeulin
1, M. Ben Achour
2, A. Chesnaud
2, A. Thorel
21Center for Mathematical Morphology, Mines ParisTech, 77300 Fontainebleau, France 2Centre for Materials, Mines ParisTech, 10 rue Henri-Auguste Desbruères, 91003 Evry, France.
Images of a hematite-based epoxy coating are obtained by scanning electron microscopy (SEM). At the scale of a few micrometers, they show aggregates of hematite nano-particles organized along thin curved channels. We first segment the images and analyze them using mathematical morphology. The heterogeneous dispersion of particles is quantified using the correlation function and the granulom-etry of the embedding (epoxy) phase. Second, a two-scales, 3D random microstructure model with exclusion zones is proposed to simulate the spatial distribution of particles. This simple model is parametrized by four geometrical parameters related to the exclusion zones solely. The microstruc-ture is numerically optimized, in the space of morphological parameters, on the granulometry of the embedding epoxy phase and on the microstructure correlation function, by standard gradient-descent methods. Excellent agreement is found between the SEM images and our optimized model. Finally, the size of the representative volume element associated to the optimized microstructure model is compared with that of the SEM images.
Keywords: Microstructure optimization; Random media; Nanomaterials; Granulometry; Coating
1. Introduction
Hematite nanoparticles of various aspherical shapes have been synthesized and characterized for use in optical materials [1, 2] or for magnetic properties [3], ranging from pseudo-cubic [4] to cigar-like hematite particles [5]. At a higher length scale, the dispersion of hematite particles is most often heterogeneous [6]. However, the mul-tiscale distribution of nanoparticles, embedded in a resin, has not been studied to the same extent. Some microstructure models have been proposed in other contexts. Jean et al. [7] devised a multi-scale Boolean models to represent the dispersion of carbon black in rubber. Azzimonti et al. [8] introduced deposit models to simulate the disper-sion of nanoparticles in optical materials. Such models are important to predict the behavior of nanomaterials. The multiscale dispersion strongly influences their effective (i.e. macroscopic) prop-erties. For linear conducting materials, numerical computations have shown that the presence of ag-gregates of highly-conducting inclusions increase the overall properties as compared to more ho-mogeneous dispersions [9]. In nanomaterials, the typical length scales of the particles’s spatial dis-tribution is often much larger than the inclusions themselves but of the same order as wavelength of
light. Accordingly, taking dispersion into account is especially important for predicting the optical properties of composites [10].
This work is devoted to the numerical model-ing of the spatial distribution of nanoparticles of hematite in a epoxy matrix. We present the ma-terial and segment greylevel SEM microstructure images in Sec. (2). In Sec. (3) we extract the corre-lation function and granulometry of the nanopar-ticles and of the epoxy. In Sec. (4) we intro-duce a simple two-scales microstructure model to represent the microstructure. The parameters of our model are optimized according to correlation function and granulometry criteria, as defined in Sec. (3). Results are presented in Sec. (5). We conclude in Sec. (6).
2. Hematite nanocubes coating
2.1. Dispersion of nanoparticlesIn this work, we consider Fe2O3 iron oxide
(hematite) nanoparticles embedded in a epoxy resin. The hematite particles, shown at high reso-lution in Fig. (1), were specifically synthesized to resemble cubes [11].
The hematite nanoparticles were blended in an epoxy resin with a concentration of 10% in mass. The nanoparticles and resin were first mixed
to-gether in a mortar until the resulting paint be-comes homogeneous. Using a bar coater tech-nology, the mixture was then spread onto a thick and flexible shrink-wrap support in order to ob-tain a thin coating. For that purpose, an Elcome-ter 4340 motorised film applicator was used. This versatile, rugged and precise manufacturing pro-cess ensures a smooth, reproducible and consis-tent application of coatings, such as paint, varnish, cosmetics, glue and ceramics, without any ridge associated with such a technique. The bar coater is indeed equipped with a highly-engineered alu-minium table, much smoother than a glass sup-port, and heating element, if suited. It was accu-rately calibrated using a coordinate measuring ma-chine to reach a high level of flatness. The average variation of coating thickness on the Elcometer ta-ble is about±2.3 µm while it is equal to ±12.0 µm on glass of some low-cost tables. During the de-position, the roller translates towards the coating direction but does not spin round. The deposition speed may be set up from 0.5 to 10 cm per second and coating as thin as 5 µm may be fabricated. In this work, 150 µm thick coatings were fabricated. As seen in Fig. (1), the particles shape are sim-ilar to dice with rounded edges and corners.
The length of the diagonal of the cubes’s faces, measured from the SEM images, is about 300 nm. The SEM image in Fig. (1a) shows the spatial dis-persion of nanoparticles at higher length scales. Hematite particles aggregate around “empty re-gions” almost entirely made of epoxy. Around those areas, they form curved “channels” (sur-faces in 3D) and some clusters of particles in regions where the channels join. Along chan-nels, Hematite particles are quite closely packed as shown in Fig. (1b). Clearly, the dispersion ex-hibits a multi-scale microstructure with at least two scales: the particles average length and the typical size of the channels.
The rest of this work is devoted to the analy-sis and modelling of the nanoparticles spatial ar-rangements. The formation of the channels and their physical interpretation, beyond the scope of this work, is not investigated.
2.2. Image segmentation
Hereafter, we focus on 4 randomly-selected SEM images of 950× 950 pixels, representing a region
(a) (b)
Fig. 1: Nanocubes of hematite (bright) in a epoxy resin (dark) (a); same material with scale magnified 10 times (b).
of area 30 µm×30 µm. The images’s resolution is 31 nm per pixel. We segment them according to a three-steps process illustrated in Fig. (2). We first apply a gaussian filter to erase noise and smoothen the background. Second, we separate nanopar-ticles from the resin by maximization of the in-terclass variance [12], an automatic segmentation method that does not need any parameter. Third, we apply an alternate sequential filter (Fig. 2). As seen in Fig. (1), SEM images show nanoparticles that are slightly beneath the plane of observation as smaller, darker particles. To eliminate these, we remove inclusions with an area smaller than 10 pixels (about 10× 10 nm2). The final result is shown in Fig. 2 (right). Fig. (3) shows two out of the four segmented images. We measure a sur-face fraction close to f0 = 9.4± 0.5% on the four
images.
(a) (b) (c)
Fig. 2: Segmentation of SEM images (enlargement): original grayscale image (a), noise-filtering and thresh-olding (b), removing of small inclusions (c).
3. Morphological measurements
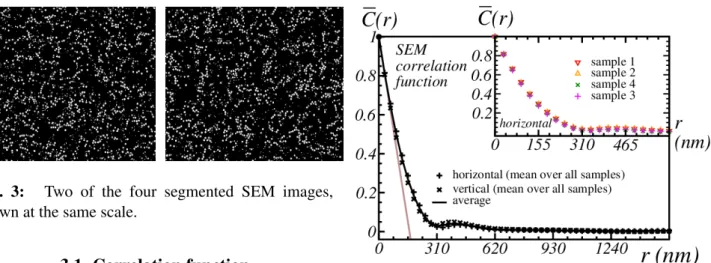
In this section, we use correlation functions and granulometry distributions to quantify the disper-sion of nanoparticles in the resin.Fig. 3: Two of the four segmented SEM images, shown at the same scale.
3.1. Correlation function
We define the covariance function as the probabil-ity:
C(r) = P{x ∈ H, x + r ∈ H}, (1) whereH is the union of hematite nanoparticles in the microstructure, and x is a point. At large dis-tances|r| ≫ 1 the two events x ∈ H and x+r ∈ H become uncorrelated and C(r = ∞) ≈ C(0)2.
Thus, we define the normalized covariance, or cor-relation function, as:
C(r) = C(r)− C(0)
2
C(0) [1− C(0)]. (2) Taking vectors r = re1 (r ≥ 0) aligned with the
horizontal axis e1, we observe nearly identical
cor-relation functions for each sample, as shown in the inset of Fig. (4). We also observe little difference along the vertical and horizontal axis, shown in Fig. (4) as well, so that the microstructure is al-most isotropic as far as correlation functions are concerned. Hereafter, we note C(r) the correlation function C(r) irrespective of the orientation of the vector r. The average over samples and over the horizontal and vertical directions of the correla-tion funccorrela-tions is referred to hereafter as “correla-tion of the SEM images”.
In Fig. (4), the tangent slope at the origin r = 0, shown in brown, cuts the abscissa at r ≈ 155 nm. This length is to be interpreted as the mean chord length of nanoparticles. It is consistent with the length of the diagonal of the nanocubes faces, of about 300 nm, measured from Fig. (1).
3.2. Granulometry
We define the cumulative granulometry by open-ings of the epoxy phase as the conditional
proba-Fig. 4: Symbols: mean over all samples of the cor-relation functions C(r) of segmented SEM images in the horizontal and vertical directions. Black solid line: mean over the two directions (brown: tangent at r = 0, see text). Inset: correlation function C(r) for r≤ 62 nm in the horizontal direction, for each sample.
bility:
G(s) = P{x ∈ E} − P{x ∈ E(S ; s)}
P{x ∈ E} (3)
where x is a point in the image, E is the epoxy phase (complementary of H) and E(S ; s) is the morphological opening of E by the structural el-ement S dilated by size s. We use the first and second neighbors, i.e. a square of 3 × 3 pixels, as structural element S whereas s take on values that are multiples of the pixel size. The granulom-etry defined above is a measure of the cumulative size distribution inE. We compute G(s) indepen-dently for each of the 4 samples. The resulting curves, shown in Fig. (5) are close to each other, except at large sizes s > 700 nm. The granulome-try of sample 2 is slightly higher than the others in this domain. We hereafter neglect these variations and take the mean of all four curves, referred to as “granulometry of the SEM images” (Fig. 5).
We emphasize our use of the epoxy phase E rather than H in the granulometry. The for-mer only is sensible to the spatial dispersion of nanoparticles. Indeed, the granulometry of the nanoparticles is zero for sizes larger than 4 vox-els and contains little information (not shown). By contrast, the granulometry G(s) is non null for s ≤ s0with s0 ≈ 2.5 µm. The value s0 is an
esti-mate of the maximum diameter of regions without hematite. Similarly, the granulometry G(s) gives
the mean diameter of these regions, estimated to 1.05 µm.
Fig. 5: Cumulative granulometry G(s) of the com-plementary of SEM images (symbols) as a function of the size s in nanometers. Solid line: average over all 4 samples. Inset: granulometry distribution function dG(s)/ds
.
4. Microstructure model
We now introduce a random 3D microstructure model to represent the nanoparticles dispersion in the epoxy. In our model, we assume that all nanoparticles are identical (perfect) cubes with uniformly-oriented random orientations. This simplification allows us to focus on the model-ing of the spatial dispersion of particles, which is our main interest. More evolved models involving size or shape distributions of particles are straight-forward extensions of this work. Regions without hematite particles (or with little of them) will be hereafter referred to as “exclusion zones” in our model, which is described according to the three steps below.
First, we generate exclusion zones by a set of hard-core spheres, determined by the spheres volume fraction f , their diameter a and a repul-sion distance ∆. When generating sphere centers, points closer to ∆ from another point are skipped. We add spheres until the volume fraction f of ex-clusion zones is obtained. Accordingly, a portion of exclusion zones intersect whenever ∆ < a.
In a second step, we place nanocubes accord-ing to a deposit model that simulates an isotropic packing of hematite particles [13]. The total
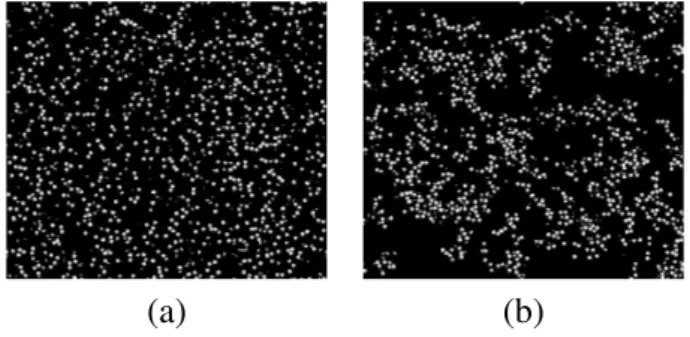
(a) (b)
Fig. 6: 2D cut of a realization of the two-scale mi-crostructure model (a); same image with exclusion zones shown in yellow (b).
(a) (b)
Fig. 7: Effect of the size of exclusion zones on the microstructure model: a = 310 nm (a), 1860 nm (b) with other parameters fixed to f = 10%, f′= ∆ =0.
number of nanocubes is determined as a random variable following Poisson’s law. Their average number is deduced from the volume fraction of nanocubes, measured from SEM images. We start by inserting the fraction 1− f′ of nanocubes
ly-ing outside exclusion zones. The center of each nanocube is, initially, generated randomly in the domain, and moved in a random, isotropically-distributed direction until a certain criterion is met. There are two possibilities. If the cube ini-tially cuts a previously-inserted nanocube, or an exclusion zone, we move it and insert it as soon as it is entirely out of the exclusion zones and of other nanocubes. Conversely, if the cube initially does not cut a previously-inserted nanocube nor an exclusion zone, we move it until it touches ei-ther one. We insert it at the last position before the intersection occurred.
In a third step, the fraction f′ of cubes lying inside exclusion zones are inserted. We use a sim-ilar packing method: if the cube center is inside an exclusion zone and the cube does not cut a previously-inserted nanocube, it is moved in a
ran-(a)
(b)
Fig. 8: Effect of the volume fraction f of exclusion zones on the correlation function (a) and granulometry (b) with other parameters fixed.
dom direction until it touches a nanocube or its center is out of exclusion zones. Conversely, if the cube initially is out of an exclusion zone or in-tersects an already-inserted cube, we move it until its center is inside an exclusion zone and the cube does not intersect any other cube.
We emphasize that nanoparticles never intersect each other, but, instead, are “packed” together. An example of the generation of a microstructure with ∆ = f′ = 0 is shown in Fig. (6). Exclu-sion zones are represented in yellow (right), the final microstructure is shown left. Examples of microstructures with ∆ = f′ = 0, and exclusion zones volume fraction f = 10% are shown in Fig. (7) with small (left) and large (right) exclu-sion zones diameters a.
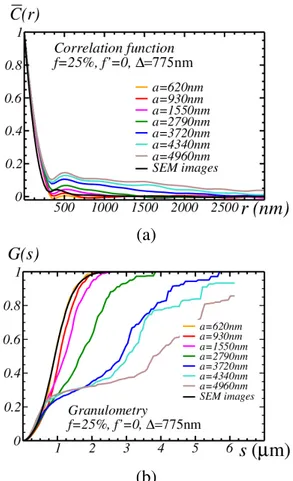
As predicted, the volume fraction f of exclud-ing zones has an important effect on the granu-lometry as shown in Fig. 8 (bottom) for f′ = 0, a =1550 nm and ∆ = 775 nm. When a is small, this effect is less (not shown). For the same val-ues of the three parameters f′ = 0, a = 1550 nm
(a)
(b)
Fig. 9: Effect of the diameter a of exclusion zones on the correlation function (a) and granulometry (b) with other parameters fixed.
and ∆ = 775 nm, the effect of f on the granulom-etry is small. A similar strong effect of the diam-eter a is observed on the granulometry but also, as expected, on the correlation function (Fig. 9). This effect occurres whether at high or low vol-ume fractions f (not shown).
The included volume fraction f′ and the repul-sion distance ∆ have little influence on the cor-relation (not shown). The former predictably in-fluences the granulometry, whereas the repulsion distance ∆ only marginally changes it (Fig. 10).
5. Microstruture optimization and
representative volume element
We hereafter optimize the microstructure model parameters by minimizing η1 R hdr h CM(r)− CSEM(r)i2+ η 2 R hds h GM(s)− GSEM(s)i2 (4) where the correlation function CM(r) and
mi-(a)
(b)
Fig. 10: Effect of the volume fraction f′ of hematite in exclusion zones (a) and of the hardcore parameter ∆(b) on the granulometry, with the other 3 parameters fixed.
crostructure models whereas CM(r) and GM(s)
re-fer to the known SEM correlation functions and granulometry, resp. The criterion above allows us to optimize on both the correlation function and on the granulometry. Both quantities are com-prised between 0 and 1. The weights η1 > 0
and η2 > 0 are used to favor one over the other.
Hereafter we make the arbitrary choice η1 = 1,
η2= 1− f0≈ 0.91.
We use the standard gradient descent and Levenberg-Marquardt methods [14]. The latter has been successfully used for optimizing multi-scale microstructure models [7]. Numerical op-timization is undertaken on 3D microstructures containing 800× 800 × 200 voxels. Random 2D cuts normal to the third axis, containing 800× 800 pixels, are used to compute criterion (4). Based on the results of Sec. (3), we use f = 40%, a = 2.48 µm, f′ = 10% and ∆ = 310 nm as ini-tial point. Both methods converge to a local min-imum. The method of Levenberg-Marquadt takes
(a) (b)
Fig. 11: Optimized numerical microstructure (a) and one segmented SEM image sample (b) observed at the same scale. Each image represents a square of size 24.8 µm with resolution 31 nm per pixel. The pa-rameters of the optimized model are f = 25%, a = 1862 nm, f′=20%, ∆ = 620 nm.
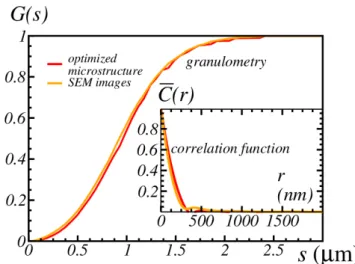
Fig. 12: Granulometry of the optimized numerical mi-crostructure and of SEM images. Inset: correlation function.
more time at each iteration than the standard gra-dient descent, but uses about 4 times less iterations to converge to a given precision. We also find that both method converges to the same (local) opti-mum with parameters: f = 25%, a = 1.862 µm, f′ = 20%, ∆ = 0.62 µm. A 2D cut of the
opti-mized model is represented in Fig. (11) and com-pared to a segmented SEM image.
The model reproduces the arrangements of nanoparticles along curved channels (necklaces) seen in SEM images.
The granulometry and correlation functions of the optimized microstructure model and of the SEM images are shown in Fig. (12). In terms of these two criteria, the optimized model is very
close to the SEM images.
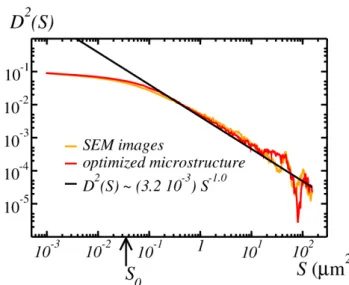
Fig. 13: Variance D2(S ) of the apparent surface frac-tion of nanoparticles computed over a domain of sur-face area S : comparison between SEM images and op-timized microstructure model. Solid black line: fit of the variance D2(S ) for S ≫ S0. Black arrow: integral range S0.
Finally, as a complementary examination, we compute the representative volume element (RVE) related to the nanoparticules dispersion. Let D2(S ) be the variance of the surface fraction of nanoparticles measured over independent 2D domains of area S in the material. For large ar-eas S , the following asymptotic behavior is recov-ered [15]:
D2(S )∼ f0(1− f0)S0
S , S ≫ S0 (5)
where S0is the integral range and f0 ≈ 10% is the
surface fraction of nanoparticles (Sec. 2.2). The integral range S0is determined by the covariance
C(r) [16]. The quantity D(S ) gives the confidence interval for the estimation of the surface fraction of nanoparticles on N domains of area S [17]. The absolute error of such estimate is:
ǫabs =
2D(S ) √
N (6)
To compute numerically D2(S ), we divide one SEM image into n × n non-overlapping squares of area S and compute the surface fraction of nanoparticles over each subdomain. We approx-imate D2(S ) as the variance of the obtained set of
surface fractions. The same computation is un-dertaken along a random 2D cut of our optimized microstructure model. The two curves are repre-sented in Fig. (13). Overall, the standard deviation function of our optimized model is close to that of the SEM images, although this quantity is not (explicitly) involved in criterion (4). A region of interest S > 1.50 µm2 is selected. Powerlaw fits
on the SEM and optimized models give D2(S ) ∼
3.14 10−3S−0.96 and D2(S ) ∼ 3.58 10−3S−0.97, re-spectively, consistently with Eq. (5). The for-mer is represented in Fig. 13 (solid black line). From this fit, we deduce the integral range S0 ≈
3.52 10−2 µm2. At the scale of the SEM images
(S = 153 µm2) the absolute error in Eq. (5) is
ǫabs ≈ 1.1% so that f0 ≈ 9.4 ± 1.1%.
6. Conclusion
The spatial dispersion of hematite nanoparticles in a epoxy resin is accurately modeled by a two-scales microstructure made of spherical “ex-clusion zones” containing few hematite parti-cles. Use of the granulometry of the embed-ding (epoxy) phase as criterion is crucial to de-scribe the spatial dispersion of particles. The model’s parameters are efficiently optimized using either standard gradient method or the Levenberg-Marquardt method.
Parametrized microstructure models are a first step towards designing materials with improved physical properties. 3D microstructure models are conveniently coupled with Fourier numeri-cal methods [18] for solving PDEs on images of complex materials, without meshing. These tools predict the electric [18], elastic [9] or opti-cal [8] responses of composites. Applied to the present work, these methods should allow one to determine how the peculiar multiscale disper-sion of nanoparticles affects the material’s over-all properties. In previous numerical investiga-tions [9], multiscale dispersions have been shown to strongly influence the physical properties of inclusion-matrix coatings.
Acknowledgement This study was made with the support of A.N.R. (Agence Nationale de la Recherche) under grant 20284 (LIMA project).
References
[1] M. Spuch-Calvar, J. Pérez-Juste, L. M. Liz-Marzán, Hematite spindles with optical functionalities: Growth of gold nanoshells and assembly of gold nanorods, J. of Col-loid and Interface Science 310, pp. 297–301 (2007).
[2] Y. Xu, S. Yang, G. Zhang, Y. Sun, D. Gao, Y. Sun, Uniform hematite α − Fe2O3
nanoparticles: Morphology, size-controlled hydrothermal synthesis and formation mech-anism, Materials Letters 65 pp. 1911–1914 (2011).
[3] M. Tadic, N. Citakovic, M. Panjan, B. Stano-jevic, D. Markovic, Ð. de Jovanovic, V. Spasojevic, Synthesis, morphology and mi-crostructure of pomegranate-like hematite (α− Fe2O3) superstructure with high
coer-civity, J. of Alloys and Compounds 543 (5), pp. 118–124 (2012).
[4] G.-S. Park, D. Shindo, Y. Waseda, T. Sugimoto, Internal Structure Analysis of Monodispersed Pseudocubic Hematite Par-ticles by Electron Microscopy, J. of Col-loid and interface Science 177, pp. 198–207 (1996).
[5] S. Manickavasagam, C. Saltiel, H. Giesche, Characterization of colloidal hematite parti-cle shape and dispersion behavior, J. of Col-loid and Interface Science 280, pp. 417–430 (2004).
[6] X. Huang, J. Guan, Z. Xiao, G. Tong, F. Mou, X. Fan, Flower-like porous hematite nanoarchitectures achieved by complexation-mediated oxidation-hydrolysis reaction, J. of Colloid and Interface Science 357, pp. 36–45 (2007).
[7] A. Jean, D. Jeulin, S. Forest, S. Cantour-net, F. N’Guyen, A multiscale microstructure model of carbon black distribution in rub-ber, J. of Microscopy 241 (3), pp. 243–260 (2011).
[8] D. F. Azzimonti, F. Willot, D. Jeulin, Optical properties of deposit models for paints: full-fields FFT computations and representative volume element, J. of Modern Optics 60 (7), pp. 1–10 (2013).
[9] F. Willot, D. Jeulin, Elastic and electrical behavior of some random multiscale
highly-contrasted composites, Int. J. for Multiscale Computational Engineering 9 (3), pp. 305– 326 (2011).
[10] D. Jeulin, Random structures in physics, in M. Bilodeau, F. Meyer and M.Schmitt, eds., Space structure and Randomness 183, Lecture Notes in Statistics, pp. 183–219, Springer New-York (2005).
[11] M. Ben Achour, A. Chesnaud, A. Thorel, J.-F. Hochepied, L. Lajaunie, F. Willot, E. Couka, A. Paljic, Dielectric properties of hematite nanoparticles with various mor-phologies, unpublished.
[12] N. Otsu, A threshold selection method from gray-level histograms, IEEE Trans. Sys. Man. Cyber. 9, pp. 62–66 (1979).
[13] F. Willot, L. Gillibert, D. Jeulin, Microstructure-induced hotspots in the thermal and elastic responses of granular media, Int. J. of Solids and Structures 50 (10), pp. 1699–1709 (2013).
[14] W. H. Press, B. P. Flannery, S. A. Teukol-sky, W. T. Vetterling, Numerical Recipes Third Edition: The art of scientific comput-ing, Cambridge Universtity Press (2007). [15] G. Matheron, The Theory of Regionalized
Variables and its Applications, Paris School of Mines Publications (1971).
[16] T. Kanit, S. Forest, I. Galliet, V. Mounoury, D. Jeulin, Determination of the size of the representative volume element for random composites: statistical and numerical ap-proach. Int. J. of Solids and Structures 40 (13), pp. 3647-3679 (2003).
[17] T. Kanit, F. N’Guyen, S. Forest, D. Jeulin, M. Reed, S. Singleton, Apparent and ef-fective physical properties of heterogeneous materials: representativity of samples of two materials from food industry. Computer Methods in Applied Mechanics and Engi-neering (33) 195, pp. 3960–3982 (2006). [18] F. Willot, B. Abdallah, Y.-P. Pellegrini,
Fourier-based schemes with modified Green operator for computing the electrical re-sponse of heterogeneous media with ac-curate local fields. to appear in Int. J. for Numerical Methods in Engineering (doi 10.1002/nme.4641). ArXiv preprint: 1307.1015.