THE USE OF VARIOUS GAS CHROMATOGRAPHY AND MASS SPECTROMETRY
TECHNIQUES FOR HUMAN BIOMONITORING STUDIES
Patterson, DG Jr.1, Welch, SM1, Focant J-F2, Turner, WE1
1Division of Laboratory Science, National Center for Environmental Health, Centers for Disease Control and
Prevention, 4770 Buford Highway, NE, Atlanta, Georgia 30341; 2Mass Spectrometry Laboratory, University of
Liege, Allee de la Chimie 3, B-6c Sart-Tilman, B-4000 Liege, Belgium
Introduction
At the Centers for Disease Control and Prevention (CDC), the demand for high quality laboratory measurements for environmental contaminants in human populations has steadily increased during the past two decades. These measurements in human matrices (internal-dose) reduce misclassification and greatly increase the probability of finding an association (if any really exists) between exposure to a chemical and any potential human health effects. . Because of the limited amount of matrix that is usually available from epidemiological studies, we have been concentrating on developing comprehensive analytical methods for measuring many chemical compounds classes in a single human sample. At the same time background levels of PCDDs and related pollutants in serum have declined to the point that their measurement has become increasingly difficult, and the sample size required for quantification
has become quite large.1 Reducing the sample size required for these analyses by increasing the sensitivity of the
method is thus an area of considerable interest.
It has been known for some time that thermal modulation can enhance the sensitivity of gas chromatographic
measurements by increasing the signal-to-noise ratio.2 As the most sensitive gas chromatographic detector for
measurements of polychlorinated dibenzo-p-dioxins (PCDDs) and related persistent organic pollutants (POPs) is the magnetic sector mass spectrometer, it is to be expected that thermal modulation coupled with a magnetic sector mass spectrometer will result in the ultimate attainable sensitivity for measurement of these compounds. In 1996 and 1998, high resolution mass spectrometry (HRMS) was coupled with comprehensive two-dimensional gas chromatography (GCxGC) for the measurement of PCDDs and related compounds in addition to other environmental
contaminants.3,4 These two reports used painted modulators and a rotating heated arm modulator to achieve the
comprehensive two-dimensional separation. In the last few years advances have been made in the design of devices for thermal modulation in gas chromatography, in particular the use of cryogenic trapping. A gas chromatograph equipped with a cryogenic modulator coupled to a high resolution mass spectrometer results in attogram (ag) detection of PCDDs in standards and serum samples.
Materials and Methods
Standards
Standards were from Cambridge Isotope Laboratories (Andover, MA, USA) and were diluted with nonane to the following concentrations (in fg/µL) of 2,3,7,8-tetrachlorodibenzo-p-dioxin (2378D) and
1,2,3,7,8-tetrachlorodibenzo-p-dioxin (12378D): 20, 10, 5, 2.5, 1.25, 0.625, 0.313, 0.157.
Sample preparation
Serum samples were aliquots of 10g of the National Institute of Science and Technology human serum Standard Reference Material 1589a. Samples were reconstituted in 20 µl of nonane and diluted to the following approximate concentrations (assuming 70% recovery) of 2378D (in fg/µL): 6.5, 1.625, 1.3, 1.1, 0.813, 0.650, 0.540, 0.406, 0.325,
0.203, 0.162. Serum samples were prepared according to the procedure reported by Turner et al5. Samples were
spiked with 13C
12-labled internal standards followed by C18 solid phase extraction (SPE) and a multi-column
automated cleanup and enrichment procedure using a Fluid Management Systems Power-Prep/6. An analytical run consisted of one method blank, nine unknown samples, and two quality control samples. PCDDs/PCDFs/cPCBs were eluted from the AX-21 carbon columns in the reverse direction with toluene. One µL of dodecane “keeper” was added to the eluants and solvent evaporated to about 350 µL using a Zymark TurboVap II. Residual toluene was transferred to silanized auto sampler vials and evaporated to one µL. Prior to analysis by high-resolution gas chromatography and high-resolution mass spectrometry (HRGC/HRMS), vials were reconstituted with five µL of
13C-labeled external standard in nonane.
932
Sample preparation and analysis
Mass Spectrometry
A Leap Technology GC Pal auto sampler was used to make two µL injections into an Agilent 6890 gas
chromatograph (GC). The GC was operated in the splitless injection mode with a flow of 1 mL/min He through a DB-5ms column (30 m x 0.25 mm x 0.25 µm film). Selected congeners were quantified by isotope-dilution mass spectrometry using selected ion monitoring (SIM) at 10,000 resolving power (10 % valley) on a Thermo Finnigan
MAT 95 XP (5kV) magnetic sector field mass spectrometer operated in the electron impact (EI) mode at 40eV8.
Two HRMS quantification schemes were employed: one for measuring TCDD only in one multiple ion detection (MID) group; and another for TCDD in one of six MID groups used for measuring all seventeen 2,3,7,8-substituted PCDDs/PCDFs and four cPCBs . Additional HRGC/HRMS analyses were performed on the new ThermoElectron DFS high resolution mass spectrometer.
GCxGC-HRMS analysis
The gas chromatograph was an Agilent 6890N operated in splitless mode and the mass spectrometer was a MAT95XP (ThermoElectron, Bremen Germany). The column was a DB-5 with dimensions 7 m x 0.1 mm i.d. x 0.10 µm film thickness. The modulation device was the loop modulator from Zoex Corporation, which utilizes liquid nitrogen as the cryogen and consists of one cold jet and one hot jet with 2 loops of column passing the jets,
effectively creating a quadruple jet or dual-stage system.6 The modulator was positioned approximately 75 cm from
the end of the column. The modulation period for the maximum sensitivity enhancement was either 6 or 9 s and the hot jet pulse time was 800 ms. For resolution of all congeners of a given class, faster modulation cycles were employed. Data analysis and visualization was performed using ThermoElectron XCalibur and GC Image software. Quantification was performed using GC Image.
Results and Discussion
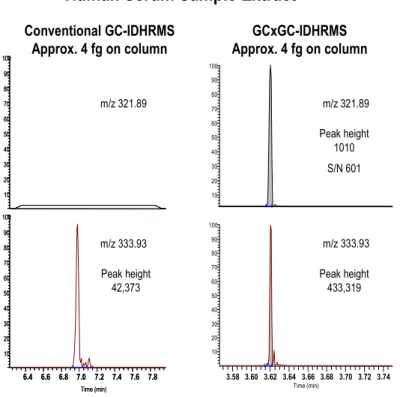
The sensitivity for the measurement of 2,3,7,8-TCDD by various GC and MS techniques is outlined in Table 1. A comparison for the MAT95XP and the new DFS HRMS is given in Figure 1. The increase in sensitivity for the new instrument is obvious. For sensitivity enhancement by GC with thermal modulation, the largest increase is obtained when the entire peak of interest is trapped and remobilized in one event or “slice”. For this reason, relatively long modulation times were used. Peak widths under the conditions used were in the 300 to 400 ms range when measured at peak base (200-250 ms at half-height). Figure 2 is a 3D plot of the m/z 322 (321.8936) ion of 2378-TCDD resulting from an injection of a standard containing 313 ag (S/N 400). Figure 3 is the m/z 320 and 322 traces resulting from the injection of the NIST SRM 1589a human serum extract which is equivalent to approximately 540 ag of 2378-TCDD, assuming a 70% recovery, displaying a signal-to-noise ratio of 474 to 1, using a +/-4 sigma definition. The obvious advantage of using the GCxGC approach compared to the conventional GC technique can be seen in Figure 4. A human serum sample extract representing approximately 4 fg of 2378-TCDD on-column is non-detected by the GC-IDHRMS method while the same extract measured by the GCxGC-IDHRMS method produced a peak with a signal-to-noise ratio of 601 (see Figure 4). It should be noted that the C-13 labelled internal standard signal was an order of magnitude larger using the GCxGC method (Figure 4).
Table 1. Sensitivity for 2,3,7,8-TCDD Using Various Combinations of Gas Chromatography Coupled With Mass Spectrometry.
TECHNIQUE SAMPLE AMOUNT ON_COLUMN S/N (4 sigma)
_____________________________________________________________________________________________ GC-MAT95XP HRMS Standard 20 fg 43 GC-DFS HRMS Standard 20 fg 604 GCxGC-MAT95XP HRMS Standard 1 fg 1420 GCxGC-MAT95XP HRMS Standard 313 ag 400 GCxGC-MAT95XP HRMS Serum 540 ag 474 GCxGC-MAT95XP HRMS Serum 325 ag 161
GCxGC-MAT95XP HRMS Serum 223 ag PeCDD 188
GCxGC-TOFMS Standard 0.5 pg 6
933
Sample preparation and analysis
References
1. Turner, W., Welch, S., DiPietro, E. Cash, T. McClure, C., Needham, L. Patterson, D .(2004) Organohal. Comp. 66 (2004) 262-269.
2. Liu, Z. and Phillips, J.B. (1994) J. Microcol. Sep. 6: 229-235
3. Patterson, D.G., Barr, J.B., DiPietro, E.S., Grainger, J., Green, V.E., Lapeza, C.R., Maggio, V.L., Sirimanne, S. And Turner, W.E. (1996) Organohal. Comp. 27:309-314.
4. Grainger, J., Dimandja, J.-M., Green, V., Liu, Z. and Patterson, D. (1998) Organohal. Comp. 35:28A-28D. 5. Turner, W.E, DiPietro, E.S., Cash, T.P., McClure,, P.C., Patterson, D.G. and Shirkan H. (1994) Organohal.
Comp. 19:31-35.
6. Ledford, E.B., TerMaat, J.R. and Billesbach, C.A. Technical Note KT030606-1 Zoex Corporation, Lincoln, Nebraska, USA. 5.5 6 .0 6.5 7 .0 7 .5 8.0 8 .5 9.0 9 .5 1 0.0 10 .5 1 1.0 11 .5 1 2.0 12 .5 Tim e (m in ) 0 5 10 15 20 25 30 35 40 45 50 55 60 65 70 75 80 85 90 95 10 0 Re la tiv e A bu nda nce 1 1 .1 5 12 .3 1 9 .7 1 9 .5 9 1 0 .95 10 .5 8 1 1.2 3 9.7 4 1 2 .02 7 .55 6 .97 9 .9 5 8 .8 3 5.7 2 7 .1 47 .3 5 5 .6 3 6 .0 76 .196.4 16 .6 46 .9 4 7 .9 28 .168.3 58 .5 78.78 8.8 8 9 .3 19 .5 0 1 0.2 41 0 .51 1 0 .7 4 1 1 .5 5 11 .9 5 1 2 .3 4 5 .5 1 5 . 5 6 . 0 6 . 5 7 . 0 7 . 5 8 . 0 8 . 5 9 . 0 9 . 5 1 0 . 0 1 0 . 5 1 1 . 0 1 1 . 5 1 2 . 0 1 2 . 5 1 3 . 0 1 3 . 5 1 4 . 0 1 4 . 5 T i m e ( m i n ) 0 5 1 0 1 5 2 0 2 5 3 0 3 5 4 0 4 5 5 0 5 5 6 0 6 5 7 0 7 5 8 0 8 5 9 0 9 5 1 0 0 R ela tiv e A bu nda nc e 1 3 . 3 4 1 3 . 1 4 1 2 . 5 2 1 3 . 5 6 1 1 . 2 2 1 2 . 2 5 1 4 . 7 3 6 . 5 56 . 8 1 7 . 3 4 8 . 0 4 8 . 4 8 9 . 0 89 . 2 3 9 . 6 0 1 0 . 1 91 0 . 5 0 1 1 . 4 7 1 3 . 0 9 1 4 . 1 6 5 . 2 35 . 5 2 6 . 2 6 6 . 4 3 7 . 9 9 1 1 . 0 9 20 fg TCDD std by GC-IDHRMS MAT95XP DFS S/N 607 S/N 43
Figure 1. Comparison of MAT95XP HRMS and the New DFS HRMS for Sensitivity
Figure 2. Plot showing signal at m/z 322 resulting from an injection of standard containing 313 ag of 2378D.
934
Sample preparation and analysis
Figure 3 (a) (b)
Plots showing signal at m/z 320(a) and 322(b) resulting from an injection of NIST SRM human serum extract equivalent to approximately 540 ag, assuming 70% recovery.
m/z 333.93
m/z 321.89 m/z 321.89
m/z 333.93
Human Serum Sample Extract
Conventional GC-IDHRMS Approx. 4 fg on column GCxGC-IDHRMS Approx. 4 fg on column Peak height 42,373 Peak height 433,319 3.58 3.60 3.62 3.64 3.66 3.68 3.70 3.72 3.74 Time (min) 10 20 30 40 50 60 70 80 90 100 10 20 30 40 50 60 70 80 90 100 -Peak height 1010 S/N 601 6.4 6.6 6.8 7.0 7.2 7.4 7.6 7.8 Time (min) 10 20 30 40 50 60 70 80 90 100 10 20 30 40 50 60 70 80 90 100 6.4 6.6 6.8 7.0 7.2 7.4 7.6 7.8 Time (min) 10 20 30 40 50 60 70 80 90 100 10 20 30 40 50 60 70 80 90 100
Figure 4. Comparison of conventional GC-IDHRMS and GCxGC-IDHRMS for a human serum sample extract.