O
pen
A
rchive
T
OULOUSE
A
rchive
O
uverte (
OATAO
)
OATAO is an open access repository that collects the work of Toulouse researchers and
makes it freely available over the web where possible.
This is an author-deposited version published in :
http://oatao.univ-toulouse.fr/
Eprints ID : 12341
The contribution was presented at WAINA 2013
Official URL:
http://dx.doi.org/10.1109/WAINA.2013.128
To cite this version :
Nakano, Tatsuhiko and Arakawa, Yukata and Tagashira,
Shigeaki and Fukuda, Akira and Dhaou, Riadh Proposal and Implementation of
Encounter Data Transmission with Ultrasonic Sensor-based Active Wakeup
Mechanism for Energy Efficient Sparse Wireless Sensor Network. (2013) In: 27th
International Workshop on Heterogeneous Wireless Networks (WAINA 2013), 25
March 2013 - 28 March 2013 (Barcelona, Spain).
Any correspondance concerning this service should be sent to the repository
administrator:
[email protected]
Proposal and Implementation of Encounter Data Transmission
with Ultrasonic Sensor-Based Active Wakeup Mechanism
for Energy Efficient Sparse Wireless Sensor Network
Tatsuhiko NakanoGraduate School of Information Science and
Electrical Engineering, Kyushu University
Fukuoka, Japan.
E-Mail: [email protected]
Yutaka Arakawa
Faculty of Information Science and Electrical Engineering,
Kyushu University Fukuoka, Japan. E-Mail: [email protected] Shigeaki Tagashira Faculty of Informatics, Kansai University Osaka, Japan. E-Mail: [email protected] Akira Fukuda
Faculty of Information Science and Electrical Engineering,
Kyushu University Fukuoka, Japan. E-Mail: [email protected] Riadh Dhaou University of Toulouse, IRIT-ENSEEIHT, 2 rue Charles Camichel, 31071
Toulouse, France.
Abstract—In this paper, we propose and implement en-counter data transmission with an ultrasonic sensor-based active wakeup mechanism for sparse wireless sensor net-works (SWSNs), in which sensors are placed sparsely and each sensor is unable to communicate directly. We suppose that an active wakeup mechanism will be more suitable than a low-duty-cycle mechanism for SWSNs, since the collecting node moves around randomly in the sensing field. However, it was not clear whether the collecting node can communicate with the sensor in the short passing-through period. In this paper, we propose to use an ultrasonic sensor for waking up the communication function. We also succeed in developing a real-world sensor node that wakes up only when it detects the closing of the collecting node. We evaluate the detection ratio and the average communication duration of our system in a real-world agricultural application. As a result, we confirm that our system can provide stable communication between the collecting node and the sensor for at least 20 s at 10 kmph and for 10 s at 20 kmph.
Keywords-wireless sensor network, WSN, sparse, data mule, message ferry, opportunistic communication, ultra-sonic, energy harvest, energy-saving
I. INTRODUCTION
Recently many studies have been conducted on the application of the information and communication tech-nology(ICT) in agriculture. In traditional agriculture, skill depends on the farmer’s hunches and experience, which makes the decision-making process error-prone and inef-ficient. In ICT-based agriculture, the collection, accumu-lation, and analysis of environmental data can improve the agricultural efficiency, and this data is useful for increasing productivity. In this paper, we focus on the field-sensing technology for the collection and accumu-lation of environmental data, which is the foundation of ICT-based agriculture. The environmental data collected includes temperature, humidity, amount of solar radiation, amount of rainfall, wind direction, and wind speed.
In field sensing, there are two important problems: a power supply for the scattered sensor nodes and data collection from them. It is impossible to lay cables for a power supply in a large farm because of the prohibitive cost. Therefore, the solution is for each sensor to have a rechargeable battery. To decrease the management cost of charging, sensors should work semipermanently with inde-pendent and continual charging by the energy-harvesting
technology. In future work, we plan to implement energy-harvesting in each sensor. However, in this experiment, each node is operated by the battery power.
A sensor network is defined as a network in which sensor nodes are installed in close proximity to each other [1][2]. Besides, each sensor node can communicate with some nodes directly and communicate with any node indi-rectly by multi-hop communication. This gives each sensor node in a wireless sensor network a communication route to the sink node. Many studies of energy-saving multi-hop communication [3][4][5] have also been conducted on reducing the energy consumption of each sensor node. We assume that several sensor nodes may not have a communication route to the sink node in the agriculture sensing area because the sensing environmental data does not drastically change over a short distance. This means that one can distribute the nodes sparsely. In fact, we placed only six sensor nodes sparsely in a vast tea farm
spread over more than 350,000 m2. The average distance
between the sensor nodes is more than 400 meters. In such a sparse wireless sensor network(SWSN), multi-hop transmission is not feasible.
Data collection methods in SWSNs include cable lay-ing, which is, however, expensive. Another method is to have humans collect the sensing environmental data of each alienated node directly. However, the disadvantage of this method is that it is inefficient in terms of management. Another data collection technique involves the use of a cellular telephony network, without using near field com-munication. Although this is very useful, it is not always usable. The fourth method is opportunistic data collection (ODC), realized by using moving relay-dedicated nodes called collecting nodes.
In our studies, we focus on ODC. In this system, the collecting node gathers the sensing environmental data of sensor nodes automatically in patrols. This communication protocol can be defined as the encounter data transmission (EDT) protocol. Some architectures have been proposed such as EDT, data mobile ubiquitous LAN extensions (Data MULE) [6], message ferry [7] or opportunistic communication [8].
Figure 1 shows the wireless sensor network architecture of Data MULE. The nodes that comprise Data MULE are
divided into three layers. The layer that concentrates all environmental data is called the access points (AP). The mobile layer of collecting nodes is called MULEs, which has the same meaning as a “collecting node.” The third layer is called Sensors. All the sensor nodes are included in Sensors. Each moving object that transports the collecting node is called a MULE, and all cars, humans, and animals in the network can be thought of as MULEs. Each MULE has an irregular and random migration route. The route shown in Figure 1 is a simple example. Additionally, groups of nodes that can communicate with each other may make up a cluster. The representative node of the cluster tries to transmit by Data MULE [9]. One of the most important issues in Data MULE is how to reduce the energy consumption of each sensor, without missing the collecting nodes.
Figure 1. Data MULE network architecture.
The most general way to save the energy of sensor nodes is low-duty-cycle wakeup (LDC), in which a sensor node is woken up periodically by a timer. LDC can be defined as a passive mechanism. The other wakeup method, called active wakeup (AW), is for the device to wake up when it detects a certain signal.
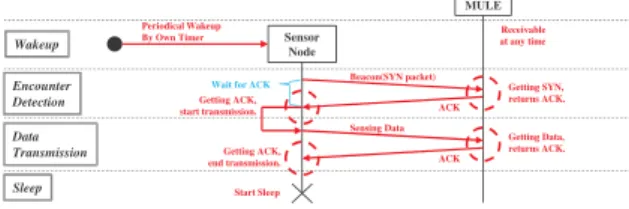
There are representative examples of LDC-based Data MULE [10][11]. The sequence is as follows. First, the sensor node wakes up periodically. Second, upon an encounter detection, the sensor node determines whether an encounter with a collecting node (MULE) has occurred by using beacons. Finally, upon a data transmission, if the encounter occurs, the sensor node transmits the accumu-lated sensing data. The sequence of the EDT is shown in Figure 2. In the LDC-based sensor node, energy saving is attained to some extent; however, it has the following glaring disadvantage: the wakeup cycle is fixed. Even if an encounter is not essential, wakeup occurs. Therefore, non-essential energy consumption occurs, and Figure 3 indicates the waste. It shows that the LDC-based encounter detection mechanism has room for improvement in terms of energy consumption, especially when a collecting node rounds a field randomly.
Wait for ACK
Periodical Wakeup By Own Timer
ACK Receivable at any time
Wakeup SensorNode
MULE Beacon(SYN packet) Encounter Detection Data Transmission ACK Sensing Data Getting SYN, returns ACK. Getting Data, returns ACK. Getting ACK, start transmission. Start Sleep Getting ACK, end transmission. Sleep
Figure 2. Sequence of LDC-based Data MULE.
In this paper, we propose AW-based EDT, which is suitable for SWSNs with a sparse collecting node. First, we describe some external devices capable of detecting an encounter that can be used to implement the substrate for AW. Then, we select the ultrasonic sensor. Finally, we
Active Sleep MULE No MULE Energy Consumption [mA] Time[s] Beacons Sleep Encounter Detection Data Transmission Wakeup
Minimum Essential Energy Non-Essential
Encounter Detections
Figure 3. Problem with LDC-based Data MULE.
perform an experiment to evaluate the operability of the AW-based EDT in a real-world tea farm. We select an ul-trasonic sensor because of its low energy consumption and low cost. Comparing motion sensors, RF receivers, and RFID, we find that the latter two are more suitable in terms of energy consumption. However, we finally decided on the ultrasonic motion sensor because of its cost advantage. Another motion sensor that we considered was the infrared sensor, whose object detection accuracy is comparable to that of the ultrasonic sensor. Each motion sensor has its own directional view. The detection view of the ultrasonic sensor is constructed by ultrasonic transmission, whereas the detection view of the infrared sensor is constructed by infrared radiation. In terms of outdoor operation, ultrasonic waves do not receive much noise, but infrared radiation is likely to receive more noise, depending on the amount of sunlight present. Therefore, we decide that the ultrasonic sensor is the best choice.
In the field experiment, we evaluate the occurrence rate of data transmission, the average communication duration, and the stability of the communication channel. We use a car as a MULE, and the collecting node is placed in the MULE. When the sensor node placed beside the road de-tects the closing of the MULE, the transmission is begun. Moreover, we assume that the deployment angle of the ultrasonic sensor influences the average communication duration and the stability of the communication channel. The results of the AW-based EDT experiment using the ultrasonic sensor are as follows. The stable communication duration is approximately 20 s at 10 kmph, and it is approximately 10 s at 20 kmph. These results are almost similar to the earlier simulation results. They indicate that the AW-based EDT is achievable.
We propose AW-based EDT for energy saving; how-ever, we do not evaluate the energy consumption in this study. This is because that the data transmission may be affected negatively since the wakeup operation does not finish immediately. In the conventional mechanism, because wakeup occurs before encounter detection, this is not a problem. However, in the proposed mechanism, wakeup occurs after encounter detection. In the EDT, because wakeup consumes some time, data transmission can not start immediately. This delay may be less than 1 s; however, it may have a negative effect in momentary transmissions such as EDT. Therefore, we put off the evaluation of energy consumption, and we instead evaluate the operability. However, we estimate it approximately. We assume that the communication duration is 10 s, and a conventional LED-based system can establish a data transmission of 10 s. The LDC cycle is 12 s, the encounter detection consumes 1 s, and sleep consumes the remaining 11 s. Both the conventional system and the proposed system are implemented with Arduino Uno R3, Arduino XBee Shield, XBee PRO, and an ultrasonic sensor. As regards the estimation of energy consumption in these 12
s, the conventional system consumes 380 mAs, whereas the proposed system consumes 330 mAs. This means that the energy consumption of the proposed mechanism is less than that of the conventional mechanism, although the ultrasonic sensor consumes more energy than the other devices that can detect the approach of a MULE.
The second section describes the details of the real-world tea farm experiment, which is the assumed envi-ronment in our proposed mechanism. The third section discusses some devices for detecting an encounter. The fourth section indicates the proposed mechanism, and the fifth section describes the field experiment and the evaluation.
II. FIELD SENSING EXPERIMENT ON A REAL-WORLD
TEA FARM
Our proposed wireless sensor network has been de-ployed in a real-world tea farm. We expect that tea-farming know-how can be quantified by analyzing the results of field sensing. One of the critical problems in tea farming is that a sprout of tea is likely to be damaged by frost in terms of quality. The common solutions to this problem are to turn on the frost-preventing fans in advance and to sprinkle water on the tea in advance. The prediction of the starting time of frost attachment to tea can be made by analyzing the sensing environmental data accumulated in advance by field sensing. As Field sensing helps quantify agricultural techniques by collecting field environmental data such as weather, temperature, humidity, atmosphere, amount of solar radiation, hours of daylight, amount of rainfall, amount of snow cover, wind power, wind direction, acidity of soil, and frost injury. The aggregate of these environmental data helps in visualization of past environmental changes. We fabricate some sensor nodes and install them in the real-world tea farm. Figure 4 shows the structure of the real-world sensor nodes, each of which has five environmental sensors for environmental data acquisition. There are three temperature sensors, a solar radiation magnitude sensor, and a humidity sensor. Two of the three temperature sensors are at 1 m and 5 m from the ground, and the third sensor is under the ground. The differences between the environmental data recorded by these three sensors help in predicting frost occurrence. The other sensors supplement the analysis.
Temperature Sensor
Battery Sensor Node
Amount of Solar Radiation Sensor
Figure 4. Structure of a real-world sensor node.
Each sensor node is powered by a car battery. However, it will work on energy harvesting (EH) in future. EH will harvest ambient power such as solar, wind, vibration, and radio wave. The car battery needs to be charged regularly by the farmers; however, EH does not need to be managed in this manner. Therefore, in such an SWSN, EH is more
suitable and more efficient in terms of the management cost. In any case, the sensor node must save as much power as possible. Therefore, it is important for the sensor node to have a mechanism to save power.
III. SUBSTRATE FORACTIVEWAKEUP
A. Internal Composition of EH Sensor Node
Before devices that can detect the closing of MULE are described in detail, it is necessary to consider the design of the sensor node system. The design is important in terms of how to save power at the sensor node. In both Figures 5 and 6, a sensor node has four parts: a substrate for sensing with various environmental sensors, a substrate for active wakeup, environmental sensors, and a substrate for EH. The substrate for EH is independent of the others, and it works even in the energy-saving mode. It does not require power because it works using its own generated power. Therefore, this substrate does not need energy reduction. Because environmental sensors are woken up by the substrate for sensing in any case, they, too, do not need energy saving. We focus on the relationship between the substrate for sensing with various environmental sensors and the substrate for AW with detection of the approach of a MULE.
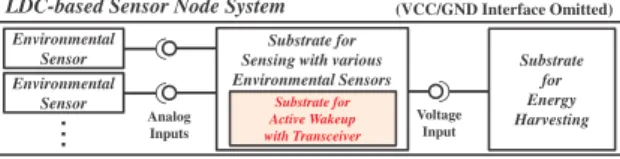
1) LDC-Based Sensor Node: Figure 5 indicates the
design of an LDC-based sensor node. The substrate for AW is on the substrate for sensing. Generally, a system is likely to be divided into subsystems based on the energy consumption in order to maximize the operating efficiency in terms of energy consumption. However, in an LDC-based sensor node, the substrate for sensing and the substrate for AW can not be easily separated because the design is complex. Moreover, because the substrate for AW uses a transceiver, which consumes a considerable amount of energy in encounter detection, this type of node is not capable to maximize energy reduction.
Substrate for Sensing with various Environmental Sensors Substrate for Active Wakeup with Transceiver Substrate for Energy Harvesting Voltage Input Analog Inputs
LDC-based Sensor Node System (VCC/GND Interface Omitted)
Environmental Sensor Environmental
Sensor
䞉䞉䞉
Figure 5. Design of an LDC-based sensor node.
2) AW-Based Sensor Node: The design of an
AW-based sensor node can be divided simply in a substrate for sensing and a substrate for AW, because the substrate for AW uses a low-energy device that can detect of the approach of a MULE. Figure 6 shows the AW-based sensor node’s internal composition. The substrate for AW is located outside the substrate for sensing, and they are connected through an external interrupt port through which the substrate for AW wakes up the substrate for sensing. The substrate for sensing can be put to sleep efficiently, and it can be woken up by an external input when necessary. The substrate for AW consumes less energy; therefore, the AW-based sensor node enables large energy saving.
B. Implementation of Substrate for Active Wakeup
The AW-based sensor node is equipped with a motion sensor, an RF receiver, or RFID as a device that can detect the approach of a MULE. They are located on the substrate for AW. A comparison between these devices is now presented.
Substrate for Active Wakeup Substrate for Energy Harvesting Voltage Input External Interrupt Port (Wakeup-able)
AW-based Sensor Node System (VCC/GND Interface Omitted)
Substrate for Sensing with various Environmental Sensors Analog Inputs Environmental Sensor Environmental Sensor
䞉䞉䞉
Figure 6. Design of an AW-based sensor node.
1) Substrate for Active Wakeup with Motion Sensor: A
motion sensor is one that has its own directional view that can detect spatial changes. For example, the sensor can detect a vehicular encounter, but can not detect smaller changes, for example, passing bees. The motion sensor includes an ultrasonic sensor or an infrared sensor. These sensors can detect the approach of a vehicle (MULE) by receiving reflective waves such as ultrasonic waves or infrared rays.
Figure 7 shows the substrate for AW with a motion sensor. The motion sensor serves as both a wave transmit-ter and a wave receiver. During an encountransmit-ter, the waves emitted continually for encounter detection are reflected on the side surface of the MULE. When the motion sensor receives the reflected waves, the substrate for AW can detect an encounter. Moreover, it must continually emit detection waves in order not to miss the approach of the MULE. Therefore, the motion sensor consumes more energy than the other detection devices. If motion sensors are used, it is necessary to be careful to not exceed the energy limit of the system.
Most motion sensors use waves for detecting objects. However, the waves are more likely to get diffused by some factors. For example, ultrasonic waves are subject to attack by wind, and they also reflect diffusely on non smooth surfaces. Infrared sensors are likely to receive waves diffused by sunlight. This is especially evident outdoors. In view of these disadvantages, the ultrasonic sensor is slightly superior to the infrared sensor.
MULE Wakeup Signal (External Input) Reflected Waves Detective Waves << Sleep >> Substrate for Sensing with Environmental Sensors Substrate for AW with Motion Sensor
When the received distance is under a threshold, the substrate for AW sends a wakeup
signal.
Figure 7. Motion-sensor-based encounter detection.
2) Substrate for Active Wakeup with RF Receiver:
An RF receiver is a device that enables remote wakeup control with a wireless signal. Recently, it has sometimes been called an ”ultra low power wakeup module.” Figure 8 shows the internal composition of an AW-based sensor node with an RF receiver. First, the collecting node in the MULE emits beacons continually. Next, an RF receiver receives them at the moment an encounter is initiated, and the substrate for AW determines an encounter occurrence. Finally, the substrate for AW transmits a digital signal to wake up the substrate for sensing with various environ-mental sensors.
Because the MULE is assumed to enjoy uninterrupted power, it can supply power to the collecting node con-tinually, and the collecting node is able to output beacons
infinitely. Besides, the RF receiver can solve the direction-ality problem that occurs in motion sensors and RFID. Because the function of this device is only to receive radio waves, it can work with very little energy. Non-directionality and much smaller energy consumption are valuable advantages of this setup. Unfortunately, however, products for the RF receiver are not easily available, which makes it difficult to implement the substrate for AW with an RF receiver. antenna MULE Wakeup Signal (External Input) Substrate for AW with RF Receiver Beacons << Sleep >> Substrate for Sensing with Environmental Sensors
Figure 8. RF-receiver-based encounter detection.
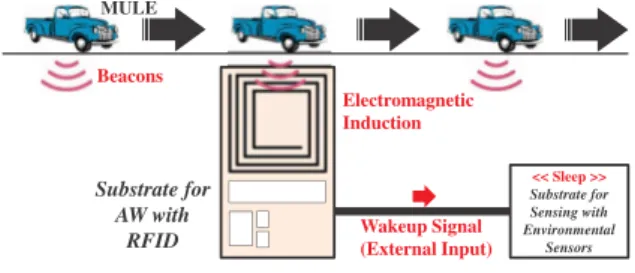
3) Substrate for Active Wakeup with RFID: Radio
frequency identification (RFID) is a mechanism used to identify objects using individual information built into the object. It is often used as an electronic tag. There are two types of RFID tags: an active RFID tag and a passive RFID tag. Active tags have a built-in battery and can emit electric waves farther. However, they are also very expensive. The passive tag does not have a built-in battery. It generates operating power by electromagnetic induction with the electric waves by itself. Although it is much cheaper than the active tag, it has the disadvantages of directionality and difficulty in responding accurately to movement.
Figure 9 shows an example of EDT execution using a passive RFID tag.
MULE Wakeup Signal (External Input) Substrate for AW with RFID Electromagnetic Induction Beacons << Sleep >> Substrate for Sensing with Environmental Sensors
Figure 9. RFID-based encounter detection.
C. Comparison between AW-Controlling Sensors
Table I compares the aforementioned devices with re-spect to energy consumption, operative range, and dis-advantages. The most important factor for selecting a sensor is the energy consumption, and in this regard, RFID is the best and the RF receiver is also good; motion sensors are worse. However, their cost is a disadvantage of RFID and the RF receiver. Both RFID and the RF receiver are expensive, and most of these devices are in the experimental stage.
Among motion sensors, the ultrasonic sensor is much the same as the infrared sensor in terms of the capability of outside usage. However, the infrared sensor’s performance is likely to suffer in sunlight. Therefore, we decided that the ultrasonic sensor is the most suitable sensor for outdoor EDT.
Detection Method Energy Consumption[µA] Operative Range Disadvantages
Ultrasonic Sensor O(104) Close Noise. High energy consumption.
Infrared sensor O(104) Close Directional view.
RF receiver O(101) Close Large cost.
Active RFID 0 (Built-in battery) Medium Large cost. Battery replacement. Passive RFID 0 Closer Large cost. Directivity.
Table I
COMPARISON BETWEENAW-CONTROLLING SENSORS.
IV. PROPOSEDMECHANISM
In this section, we explain our proposed AW-based EDT using the ultrasonic sensor.We assume that the internal composition of the sensor node features an AW-based design, and we describe in detail how to construct an EDT with an ultrasonic sensor in a real-world situation.
A. AW-Based Sensor Node with an Ultrasonic Sensor
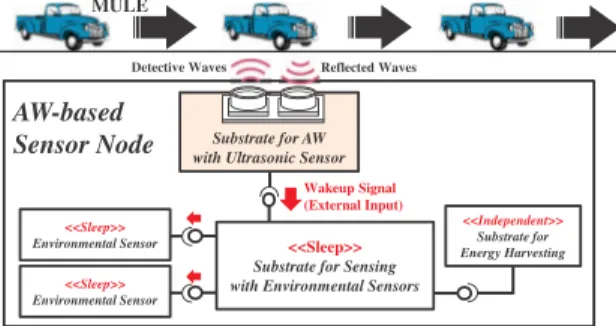
The schematic of an AW-based sensor node with an ultrasonic sensor is shown in Figure 10. The substrate for AW with an ultrasonic sensor transmits a digital signal to the substrate for sensing with various environmental sensors through its external interrupt port if an encounter occurs. Environmental sensors are controlled by only the substrate for sensing, and they are woken up when the sub-strate for sensing wakes up. The subsub-strate for EH works independently, and it uses its own generating energy.
Substrate for AW with Ultrasonic Sensor
<<Sleep>> Substrate for Sensing with Environmental Sensors
<<Independent>> Substrate for Energy Harvesting <<Sleep>> Environmental Sensor AW-based Sensor Node Reflected Waves Detective Waves Wakeup Signal (External Input) MULE <<Sleep>> Environmental Sensor
Figure 10. Schematic of an AW sensor node with an ultrasonic sensor.
B. Encounter Detection with Ultrasonic Sensor
We now describe the detection cycle and the detection threshold of the ultrasonic sensor. These elements consid-erably affect the detection accuracy. In order to detect the approach of a MULE with a high degree of accuracy, it is important that reasonable values be selected for these parameters.
Every ultrasonic sensor has a predetermined detection cycle (e.g., 100 ms). In order to lengthen this cycle, the micro-controller can be adjusted in such a way as to set a buffer between the ultrasonic sensor and the micro-controller. However, to shorten the cycle, it is necessary to select another ultrasonic sensor having a shorter cycle. We now consider the energy consumption of the ultrasonic sensor. If the detection is executed using its own maximum cycle of 100 ms, the energy consumption is maximum, and the accuracy of detection is also the highest. If the ultrasonic sensor works in a low duty cycle as above, the energy consumption is less, but the accuracy becomes worse.
The detection threshold is one of the most important parameters. An ultrasonic sensor returns the distance from
the surface reflecting the ultrasonic waves. If no surface is in view, it returns the maximum length of the de-tectable view. In principle, if the threshold is closer to the maximum range, the sensor can detect the approach of a MULE with a higher rate. However, some factors result in diffused waves, causing mistaken detection. First, wind effects disturb the detection accuracy. This noise can be removed by a low-pass filter. However, depending on the strength of the noise, the true value is also likely to be removed. Second, it is more likely to occur when the MULE moves faster, because the number of ultrasonic detections is fewer. Finally, the diffuse reflection of ultra-sonic waves also generates noise. This commonly occurs if the reflecting surface is not smooth. In this paper, the reflecting surface is assumed to be the side of a car, so the diffuse reflection is less. However, the detection cycle and the detection threshold values have to be decided carefully after each test.
C. Sequence to Establish a Communication Channel
The sequence of steps involved in establishing a com-munication channel is as follows. The substrate for AW with an ultrasonic sensor is assumed to detect the approach of a MULE continually in the energy-saving mode. This is because only the substrate for AW is active even when the AW-based sensor node is in the sleep mode. First, the ultrasonic sensor obtains the distance for each cycle. Seconds the substrate for AW checks whether the value is over the threshold for encounter detection. Third, if the threshold is exceeded, the substrate for AW wakes up the substrate for sensing with various environmental sensors by sending a digital signal through the external interrupt port. Fourth, after wakeup, the active sensor node emits an SYN packet to the collecting node in the MULE. The collecting node can always receive any packet because the MULE is assumed to have an inexhaustible power source. If the collecting node receives the SYN packet, it transmits an ACK packet to the sensor node. Finally, if the sensor node receives the ACK packet, then the communication channel between the sensor node and the collecting node is established, and the sensor node starts transmitting sensing data.
D. Energy Saving in Sensor Node
The substrate for sensing with various environmental sensors and the environmental sensors can sleep in order to save energy. The substrate for sensing sleeps by itself, and the sensors are put to sleep by the control from the substrate for sensing. The EH system is an independent system generating electric energy from ambient power; therefore, this system can work without an external power supply. The energy consumption of the AW-based sensor node system depends only on how the energy consumption of the substrate for AW with an ultrasonic sensor is reduced.
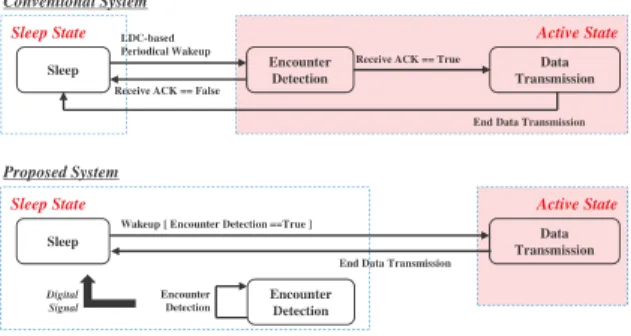
Figure 11 shows the difference between the conven-tional LDC-based mechanism and the proposed AW-based
mechanism. The active state is one in which the system-wide energy consumption is large. Although the con-ventional mechanism has two active states, the proposed mechanism has only one active state. Additionally, Figure 12 indicates the time shifts of these two mechanisms. Since the sensor node cyclically wakes up in the con-ventional LDC-based mechanism, much energy is wasted on non-essential encounter detection. However, in the AW-based mechanism, the substrate for AW with the ultrasonic sensor can work independently, and the other system can sleep to save energy. The AW-based sensor node enables wakeup opportunistically by itself, so it can achieve bet-ter efficiency. The time shift of the proposed AW-based mechanism runs with much less energy consumption.
Conventional System Sleep Encounter Detection LDC-based Periodical Wakeup Data Transmission Receive ACK == True
Receive ACK == False
End Data Transmission
Proposed System Active State Sleep State Sleep Encounter Detection Data Transmission End Data Transmission
Active State Sleep State
Wakeup [ Encounter Detection ==True ]
Encounter Detection Digital
Signal
Figure 11. Comparison of state machines.
Conventional System Energy Consumption [mA] Time[s] Time[s] Data Transmission Encounter Detection Minimum Essential Current Periodical Consumption Evenly Smaller Consumption Proposed System Energy Consumption [mA] Non-Essential Encounter Detections
Continual and Small Encounter Detections
Figure 12. Comparison of time shift of energy consumption.
E. Problem of Delay on Wakeup
The proposed AW-based mechanism has a problem in that the state change from sleep to wakeup causes delays. In the conventional mechanism, the sensor node is ready to transmit before a detection; however, in the proposed mechanism, the sensor node starts preparing a transmis-sion only after detection. The transmistransmis-sion is assumed to be at the moment of passing. In such a condition, near field communication cannot be used. Therefore, the delay may affect the performance of EDT, and the transmission may fail.
V. EXPERIMENT FOROPERABILITYEVALUATION
In this section, we evaluate our proposed system with a field experiment using the proposed AW-based sensor node. The AW-based system aims to reduce energy con-sumption significantly, and our proposed system shares this objective; however, in this study, we do not evaluate this point because the evaluation of both the operability
of the proposed mechanism and the impact of the delay problem are more significant issues. The result of the experiment is evaluated by comparison with the earlier simulation’s results.
A. Experimental Environment
1) Field Information: Figure 13 shows the field
infor-mation that was analyzed by the earlier survey of the real-world experimental field. There are two elements: one is a car (MULE), and the other is a sensor node. The MULE has a collecting node. The MULE moves in the direction of the arrow. In its resting state, transmission with the MULE is stable up to a 20 m distance between the sensor node and the collecting node. Unstable transmission is also possible up to 40 m. These values may be changed by natural factors such as wind, rain, and snow.
20.0m 40.0m
* These values may be changed somewhat by wind, temperature, humidity, etc. 20.0m Communicable Area 40.0m Stable Area Sensor Node Collecting Node MULE
Figure 13. Field information including transmission limit.
2) Geometric Definition: Figure 14 shows a geometric
diagram of the detectable area. There are three constants and two variables. One of the constants is 5.8 m, the
road width; and another constant is 30◦ to the left and
right from the direction of the ultrasonic sensor front on the sensor’s view. The third constant is at 6.0 m, the reachable range of the sensor. One of the variables is θ, the deployment angle of the ultrasonic sensor, and the other variable is v, the velocity of the MULE.
Figure 14. Geometric definition of the detection field.
The reason why the deployment angle must be consid-ered is shown in Figure 15, where there are two diagrams of the encounter detection. The difference of the angular degree causes the difference in the transmission start points. When the angle is 60◦, the detection occurs earlier, and the duration of the data transmission may be longer. The unit of v is kilometers per hour [kmph].
The velocity of the MULE affects the number of values over the threshold during each encounter. If the velocity is higher, the number of detections is fewer. Conversely, if the MULE moves slowly, the number of detections is greater. More data would help one judge whether a detection is correct or not.
Finally, the range of the ultrasonic sensor is defined as u. When any MULE is not in the range, the ultrasonic sen-sor returns 600 cm (u = 600) of the maximum detectable range.
Ultrasonic Sensor Ultrasonic View MULE MULE θ = 60 θ = 0 Difference between Detection Points Central Line Central Line Detection Point Detection Point Ultrasonic View
Figure 15. Difference of detection points.
B. Parameters on Evaluation
We evaluate our system on the basis of the following three parameters: the rate of encounter detection, the maximum communication duration, and the stability of the communication channel.
1) Rate of Encounter Detection: The rate of encounter
detection (RED) is a measure of how θ and v influence the encounter detection; especially, θ can cause diffused reflection.
2) Maximum Communication Duration:The maximum
communication duration (MCD) parameter is the duration from the start to the end of data transmission. The sim-ulation results indicate that MCD for v = 10 is less than 15 s or MCD for v = 20 is less than 8 s.
The data size of the sensing environmental data must be considered. The sensor node has five sensors for environmental data acquisition: three temperature sensors, a humidity sensor, and a solar radiation amount sensor. The data size of one sensing environmental data item per sensor is 4 KB. The sensor node obtains environmental data from them every 10 min. If we assume that data collection by EDT occurs once a week, the data size of the total sensing environmental data is less than 30 KB. In our implementation, data transmission is realized by the ZigBee protocol. The transmittable data size on ZigBee is up to 250 kbps, which means that approximately 1 s is required for the encounter transmission of sensing data.
3) Stability of Communication Channel: The stability
of the communication channel (SCC) parameter indicates how the communication channel is influenced by changes in the channel distance. Near field communication pro-tocols such as Wi-Fi, Bluetooth, and ZigBee are only assumed to operate under a fixed distance. Therefore, this evaluation is important for transmitting data stably.
C. Determination of Parameters
The two parameters of the threshold and the cycle must be determined to realize encounter detection.
1) Threshold for Encounter Detection: The threshold
of encounter detection is set at 400 cm (u = 400) as an average value. We conducted a preliminary survey, and the result indicates that u is 200 cm when the MULE is the closest to the sensor. On the other hand, when there is no MULE, u is 600 cm.
2) Cycle of Encounter Detection: The cycle of
en-counter detection is once per 100 ms of the predetermined cycle of the ultrasonic sensor because the detection sensi-tivity can be set to the maximum value.
D. Experimental Results
Summing up the evaluation of this experiment, we find that the results are quite similar to those obtained with the computer simulation. The results are promising enough to establish the operability of the EDT. The details are as follows.
1) Rate of Encounter Detection: u depends strongly
on θ and v, and when both θ and v are larger, u over the threshold could not measured at all, and the detection failed. However, when θ and v are smaller, the detection succeeded. In the actual operation, θ must be predetermined. Therefore, when θ is set to 0, RED can be maximized, and the transmission can definitely occur.
Figure 16 shows how u is influenced by the relative distance for v = 10. Figure 17 shows a similar variation for v = 20. In Figure 16, when θ is not 0, u is diffused because the ultrasonic waves are not reflected straight. Additionally, values of u below 200 cm return the closest condition, which seems to indicate the influence of the Doppler effect. In the Doppler effect, the frequency of the reflected waves is shifted by reflection on a moving surface. In Figure 17, the reason why u is not diffused is the strong influence of v. It is not enough to judge the diffused reflection in terms of the amount of data that the ultrasonic sensor obtains periodically.
0 100 200 300 400 500 600 700 -10 -9 -8 -7 -6 -4 -3 -2 -1 0 1 2 3 4 6 7 8 9 10 U lt ra so n ic S en so r V al u e [c m ]
Relative Distance with Ultrasonic Sensor [m]
0° 30° 60°
Figure 16. Change in the ultrasonic sensor’s value for v = 10 [kmph].
0 100 200 300 400 500 600 700 -10 -9 -8 -7 -6 -4 -3 -2 -1 0 1 2 3 4 6 7 8 9 10 U lt ra so n ic S en so r V al u e [c m ]
Relative Distance with Ultrasonic Sensor [m]
0° 30° 60°
Figure 17. Change in the ultrasonic sensor’s value for v = 20 [kmph].
In this experiment, since the threshold is set at 400 cm, the detection did not succeed when θ was 60 and v was 20. If the threshold is larger, the detection is more likely to succeed. At the same time, however, a non-essential transmission is more likely to occur.
We conclude that the best value of θ is 0. The ultrasonic sensor’s direction is perpendicular to the direction of motion of the MULE. In this case, both the amount of data and the duration of data transmission are adequate. Therefore, the ultrasonic sensor can work in a low duty cycle in order to save the operating energy of the encounter detection on the substrate for AW with an ultrasonic sensor.
We do not consider the influences of the following three factors. First, we do not evaluate the case for v ≥ 30 because it is dangerous to drive on the gravel road;
however, our assumption and simulation results indicate that the higher speed of the MULE causes encounters to be missed. However, the EDT is supposed to succeed at the velocity up to 100 kmph. Second, we do not also consider the reflecting surface area, which is fixed
at nearly 70,000 cm2. We do not investigate how the
surface area influences the detection; however, the larger surface area generally enables more sensitive detection. Finally, we do not consider the smoothness of the surface. Although it is smooth in this experiment, a non-smooth reflecting surface causes encounters to be missed.
2) Maximum Communication Duration: We observe a
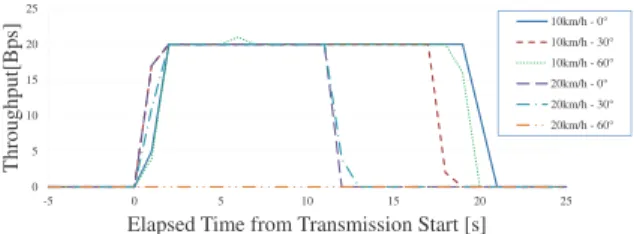
sufficiently large MCD to transmit the sensing environ-mental data. This assumption requires over 1 s per data transmission. However, in fact, the MCD is nearly 20 s for v = 10 and nearly 10 s for v = 20. These results are slightly longer than those obtained with the simulation. The cause appears to be environmental influences such as wind. These results are shown in Figure 18.
0 5 10 15 20 25 -5 0 5 10 15 20 25 T h ro u g h p u t[ B p s]
Elapsed Time from Transmission Start [s]
10km/h - 0° 10km/h - 30° 10km/h - 60° 20km/h - 0° 20km/h - 30° 20km/h - 60°
Figure 18. Transmittable time and throughput.
The communication duration of the conventional LDC mechanism depends on the wakeup timing. Therefore, the communication duration cannot be defined as a constant time. However, there is a trade-off between the rate of encounter detection and the reduction of energy consump-tion. In the worst-case timing, the communication duration is shorter, and data transmission is likely to fail. The proposed mechanism has a clear advantage in that it can obtain a constant time.
3) Stability of Communication Channel: The SCC is
adequate, and data transmission is mostly undisturbed. Rarely does a re transmission occur. This re transmission seems to be caused by changes in the relative distance.
VI. CONCLUSION
Encounter data transmission is used for data collection in a sparse wireless sensor network. However, the power supply problem necessitates energy saving during en-counter detection. This requirement is solved by suppress-ing the non-essential wakeup of the modules that consume more energy, such as the transceiver. The conventional low-duty-cycle mechanism has a limit beyond which it is impossible to reduce energy consumption further.
We have proposed the active wakeup-based mechanism for encounter data transmission using an ultrasonic sensor. In terms of cost, we decided to use an ultrasonic sensor as the active wakeup controller. Additionally, there were some gray areas in our proposal, so we evaluated it with a real-world field experiment. The results showed that encounter detection rarely fails, and the communication duration is adequate. In particular, it is nearly 20 s at 10 kmph and nearly 10 s at 20 kmph. Besides, the com-munication channel is stable. However, diffused reflection may occur at the ultrasonic return value. However, if the deployment angle of the ultrasonic sensor is perpendicular
to the direction of motion of a vehicle, this is not a problem.
In this study, energy consumption is not evaluated because the above concerns are more pressing. In future work, we will evaluate energy consumption rigorously, and we will also perform experiments with other devices that consume less energy than an ultrasonic sensor.
ACKNOWLEDGMENT
These research and experiment are aided from the Grants-in-Aid for Scientific Research (No.22700076 and No.22300025) of Japan Society for the Promotion of Science.
REFERENCES
[1] D. Estrin, L. Girod, G. Pottie, and M. Srivastava, “In-strumenting The World With Wireless Sensor Networks,” Proceedings of IEEE International Conference on Acoustics, Speech and Signal Processing (ICASSP ’01), vol.4, pp.2033-2036, 2001.
[2] I. F. Akyildiz, W. Su, Y. Sankarasubramaniam, and E. Cayirci, “Wireless sensor networks: a survey,” Computer Networks: The International Journal of Computer and Telecommunications Networking, v.38 n.4, pp.393-422, 2002.
[3] K. Martinez, J. K. Hart, and R. Ong, “Environmental Sensor Networks,” IEEE Computer, Vol.37, No.8, pp.50-56, 2004. [4] J. Burrell, T. Brooke, and R. Beckwith, “Vineyard
Com-puting: Sensor Networks in Agricultural Production,” IEEE Pervasive Computing Vol.3, No.1, pp.38-45, 2004. [5] P. Zhang, C. M. Sadler, S. A.Lyon, and M. Martonosi,
“Hardware Design Experiences in ZebraNet,” Proceedings of the 2nd international conference on Embedded networked sensor systems (SenSys’4), pp.227-238, 2004.
[6] R. C. Shah, S. Roy, S. Jain, and W. Brunette, “Data MULEs: modeling a three-tier architecture for sparse sensor net-works,” Sensor Network Protocols and Applications, pp.30-41, 2003.
[7] M. M. B. Tariq, M. Ammar, and E. Zegura, “Message ferry route design for sparse ad hoc networks with mobile nodes,” MobiHoc ’06 Proceedings of the 7th ACM international symposium on Mobile ad hoc networking and computing, pp.37-48, 2006.
[8] D. Hadaller, S. Keshav, T. Brecht, and S. Agarwal, “Ve-hicular opportunistic communication under the microscope,” Proceedings of the 5th international conference on Mobile systems, applications and services (MobiSys), pp.206-219, 2007.
[9] J. Lebrun, C. Chuah, D. Ghosal, and M. Zhang, “Knowledge-based opportunistic forwarding in vehicular wireless ad hoc networks,” Vehicular Technology Conference, vol.4, pp.2289-2293, 2005.
[10] G. Anastasi, M. Conti, E. Monaldi, and A. Passarella, “An Adaptive Data-transfer Protocol for Sensor Networks with Data Mules,” WoWMoM 2007:Proceedings of the 8th IEEE International Symposium on a World of Wireless, Mobile and Multimedia Networks, pp.1-8, 2007.
[11] X. Wu, K. N. Brown, and C. J. Sreenan, “SNIP: A Sensor Node-Initiated Probing mechanism for opportunistic data collection in sparse wireless sensor networks ,” Proceedings of Computer Communications Workshops (INFOCOM WK-SHPS), pp.726-731, 2011.
![Figure 16. Change in the ultrasonic sensor’s value for v = 10 [kmph].](https://thumb-eu.123doks.com/thumbv2/123doknet/3580673.104998/8.892.457.776.706.829/figure-change-ultrasonic-sensor-s-value-v-kmph.webp)