Preussilides A
−F, Bicyclic Polyketides from the Endophytic Fungus
Preussia similis with Antiproliferative Activity
Sara R. Noumeur,
†,‡,§Soleiman E. Helaly,
†,⊥Rolf Jansen,
†Marcus Gereke,
∥Theresia E. B. Stradal,
∥Daoud Harzallah,
‡and Marc Stadler
*
,††Department of Microbial Drugs, Helmholtz Centre for Infection Research and German Centre for Infection Research (DZIF), partner site Hannover/Braunschweig, Inhoffenstrasse 7, 38124 Braunschweig, Germany
‡Laboratory of Applied Microbiology, Department of Microbiology, Faculty of Natural and Life Sciences, University Sétif 1 Ferhat Abbas, 19000 Sétif, Algeria
§Department of Microbiology-Biochemistry, Faculty of Natural and Life Sciences, University of Batna 2, 05000 Batna, Algeria ⊥Department of Chemistry, Faculty of Science, Aswan University, 81528 Aswan, Egypt
∥Department of Cell Biology, Helmholtz Centre for Infection Research, Inhoffenstrasse 7, 38124 Braunschweig, Germany
*
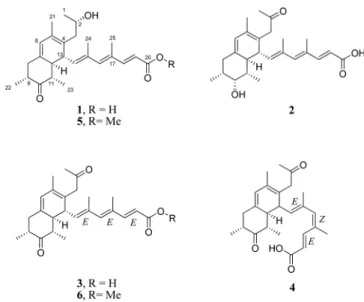
S Supporting InformationABSTRACT: Six novel bioactive bicyclic polyketides (1−6) were isolated from cultures of an endophytic fungus of the medicinal plant Globularia alypum collected in Batna, Algeria. The producer organism was identified as Preussia similis using morphological and molecular phylogenetic methods. The structures of metabolites 1−6, for which the trivial names preussilides A−F are proposed, were elucidated using a combination of spectral methods, including extensive 2D NMR spectroscopy, high-resolution mass spectrometry, and CD spectroscopy. Preussilides were tested for antimicrobial and antiproliferative effects, and, in particular, compounds 1 and 3 showed selective activities against eukaryotes. Subsequent studies on the influence of 1 and 3 on the morphology of human osteosarcoma cells (U2OS) suggest that these two polyketides might target an enzyme involved in coordination of the cell division cycle. Hence, they might, for instance, affect timing or spindle assembly mechanisms, leading to defects in chromosome segregation and/or spindle geometry.
T
he apparent increase in human diseases such as cancer and infections calls for new and beneficial therapeutic agents. Fungi are prolific sources of bioactive natural products,1and in particular the endophytic mycobiota may have developed an arsenal of unique secondary metabolites that has evolved during the symbiotic endophytes−plant relationship.2 The genus Preussia (Sporormiaceae, Pleosporales) comprises filamentous Ascomycota that live on animal dung, plant debris, soil, and wood3 or as endophytes.4−6 Modern taxonomic concepts of Preussia include the species of the genus Sporormiella, since the salient discriminatory morphological features by which these genera have been historically distinguished are now known to depend on culture conditions.6,7 Moreover, recent molecular phylogenetic studies have revealed that Preussia and Spor-ormiella do not form monophyletic clades, but rather their DNA sequences become intermingled in phylogenetic trees.6,8,9Both Preussia and Sporormiella are known to be prolific producers of bioactive polyketides, including depsidones.10−12 In particular, Preussia similis (Khan & Cain) Arenal13,14 was found to be a rich source of antifungal compounds, such as similins A and B15and preussomerin A.16From our collection of endophytic fungi isolated from the medicinal plant Globularia alypum Linn. (Plantaginaceae) collected in Batna, Algeria, P. similis DSM 104666 was selected for further study based on a phylogenetic preselection as outlined previously17,18 and screened in order to search for novel biologically active secondary metabolites. Herein we report the isolation, structure elucidation, absolute configuration, and biological activity of Received: January 21, 2017
Published: April 11, 2017
pubs.acs.org/jnp
© 2017 American Chemical Society and
preussilides A−F (1−6), six new bicyclic polyketides from the endophytic fungus P. similis DSM 104666. Furthermore, the morphological characteristics and the phylogenetic position of the producing organism are illustrated and discussed.
■
RESULTS AND DISCUSSIONThe main component of this compound family, preussilide A (1), was obtained as a pale yellow gum with an overall yield of 13 mg/L. High-resolution electrospray ionization mass spectrometric (HRESIMS) analysis of 1 indicated the
molecular formula C25H34O4(calcd for C25H35O4+, 399.2530) with 9 degrees of unsaturation. 1H, 13C, and 1H,13C HSQC NMR data indicated the presence of six methyls, two sp3 methylenes, five sp2 and five sp3 methines (including an oxygenated one), and seven sp2nonprotonated carbons (Table
1).1H,1H COSY and 1H,13C HMBC NMR data established a 4,6-dimethylhepta-2,4,6-trienoic acid substructure (A, inFigure 1), as they showed a COSY correlation between 18 and H-19 and HMBC correlations from H-18 to C-20 and C16, from H-16 to C-14 and C-18, from H3-25 to C-16, C-17, and C-18, and from H3-24 to C-14, C-15, and C-16. Furthermore, three COSY correlation sequences from H3-23 to H-12, H3-22 to H2 -8, and H3-1 to H2-3, together with a network of HMBC correlations, established a decalin derivative motif (B) as shown inFigure 1. The propan-2-ol group was connected to C-4 of the decalin moiety by HMBC correlations from H-2 to C-4 and from H-13 to C-3. Finally, a COSY correlation between H-14 and H-13 and HMBC correlations from H-14 to C-12 and C-4, from H-13 to C-15, and from H-12 to C-14 interconnected structure elements“A” and “B” via methine carbon C-13 of the decalin moiety to give the new polyketide preussilide A (1). The carbon skeleton of 1 resembles those of other fungal metabolites, such as the antarones from Penicillium antarcti-cum19and hamigerone from Hamigera avellenea.20
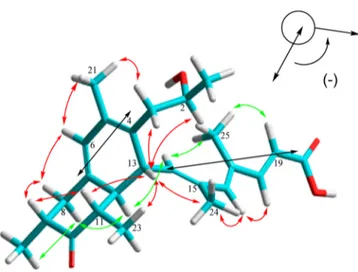
The relative configuration of preussilide A (1) was determined on the basis of 1H,1H ROESY data and vicinal coupling constants. NOE correlations (Figure 2) between the methine proton H-12 and the methyl H3-23, H-14, and H-8b revealed they are on the same face of the decalin unit. Table 1.1H and13C NMR Spectroscopic Data of Preussilide A (1) (700 MHz, Methanol-d4)a
pos δC, type δH(J in Hz) COSY ROESY HMBC
1 23.72, CH3 1.21, d (6.1) 2 2 > 3b 2, 3 2 68.08, CH 3.93, sxt (6.2) 1, 3 1 > 3a 1, 2, 3 3a 42.43, CH2 2.53,idd (7.3, 14) 3b, 2 21, 3b > 2 1, 13, 2 3b 1.96,ibr dd (5.8, 14) 3a, 2 3a > 13 1, 13, 2 4 127.97, C 5 127.96, C 6 124.53, CH 5.79, s 21 > 8a 12, 21, 8 7 137.61, C 8b 43.78, CH2 2.00,ibr t (12.0) 9, 8a 8a > 22, 12 22, 9, 6, 12, 10 8a 2.70, dd (11.9, 6.4) 8b, 9 8b, 6 > 9 22, 9, 6, 12, 10 9 50.04, CH 2.41,iddquin (0.9, 12.0, 6.4) 22, 8 22, 8a > 11 7, 10, 22, 8 10 214.71, C 11 50.02, CH 2.51,idq (12.5, 6.4) 23, 12 23 > 9 > 13 23, 12, 13, 10 12 52.02, CH 1.74, d (12.5) 11 8b 4, 6, 8, 10, 23, 13, 14 13 41.04, CH 3.31, br d (10.3) 14 24, 23, 12 > 3b, 2, 11 12, 11, 3, 15, 5, 7 14 137.99, CH 5.38, d (10.4) 13 25 4, 12, 24, 16 15 132.77, C 16 144.12, CH 6.23, br s 18 > 14 25, 24, 14, 18 17 133.48, C 18 151.55, CH 7.27, d (15.6) 19 16 25, 16, 20 19 118.74, CH 5.83, br d (15.6) 18 25 17, 20 20 171.63, C 21 18.66, CH3 1.84, s 6, 3a 4, 5, 6 22 15.35, CH3 1.06, d (6.4) 9 8b, 9 > 8a 8, 9, 10 23 12.03, CH3 1.12, d (6.4) 11 12, 11, 13 10, 11, 12 24 17.22, CH3 1.90, d (1.2) 13, 16 14, 15, 16 25 14.06, CH3 1.87, d (0.9) 19 > 14 16, 17, 18
aH-13 overlapped with solvent peak, J
H‑13value was obtained from the spectrum recorded in acetone;ioverlapping signals; > stepwise decreasing
intensity.
Furthermore, an NOE correlation between H-13 and H-11 and H3-24 indicated that H-13 and H-11 are on the face opposite H-12. This was supported by the absence of a coupling constant between H-12 and H-13 (J = 0 Hz), which suggests that the dihedral angle between H-12 and H-13 is approximately 90°. A coupling constant of J = 12.5 Hz between H-11 and H-12 supported their trans-orientation. In addition, H3-22 showed an NOE to H-8b, indicating that H3-22 is cofacial with H-12. Thus, the relative configuration of the decalin moiety was determined as shown inFigure 2, which is consistent with the reported configuration of antarones.19The geometry of the C18−C19 double bond of the 4,6-dimethylhepta-2,4,6-trienoic acid chain (structure element A) was determined from the coupling constant J18,19 = 15.6 Hz, indicating an E-configuration of this double bond. The trisubstituted double bondsΔ14,15 andΔ16,17were assigned as E-configured based on NOE correlations between H3-24 and H-13 and of H-14 and H-19 to the methyl H3-25 as well as the NOE between H-16 and H-18. This was supported by the13C NMR shifts for H3-24 and H3-25,δC17.2 and 14.1, respectively. The relatively upfield shifts confirm the cis-configuration of the methyl to the residue (R) at the trisubstituted double bonds and thus an E-configuration at Δ14,15andΔ16,17.
To determine the absolute configuration of preussilide A (1), Mosher esters of 1 were prepared of the secondary alcohol C-2. Analysis of the ΔδSR values of the MTPA esters revealed
negative values of −42 and −70 Hz of H3-1 and H3-21, respectively, while the ΔδSR values of H-3a, H-3b, and H-13 were +35, +42, and +49 Hz, respectively. Thus, the S-configuration was assigned at C-2.
The absolute configurations of the remaining stereogenic centers in 1 were assigned using CD spectroscopy. With the decaline-diene and the triene side chain, compound 1 has a bichromophoric system, which, according to the exciton chirality rule, can be used to elicit the absolute configuration of 1.21,22The ECD spectrum of 1 in EtOH showed a negative Cotton effect at λmax 302 nm (Δε = −15.01) and a positive Cotton effect at λmax265 nm (Δε = +8.80) (Figure 3) due to
the transition interaction between the two different chromo-phores. This evidence indicated a negative chirality (−) for 1. According to the excition chirality rule, the absolute R-configuration of C-13 was determined as shown inFigure 2. Consequently, the 3D structure of 1 was unambiguously determined as 2S, 9R, 11S, 12S, 13R. A model calculated with the pm3 method using HyperChem (ver. 8.0.10) showed the energy-minimized 3D structure of preussilide A (1) (Figure 2). In this structure the calculated torsion angle between H-12 and H-13 was 93° and thus fully supports the absence of their vicinal coupling.
Indicated by the positive HRESIMS ion cluster [M + H]+at m/z 399.2519 (calcd 399.2530) compound 2 was an isomer of 1 sharing the elemental formula C25H34O4. The 1H and 13C NMR spectra resembled those of 1 (Tables 2and3). However, the doublet signal for H3-1 in 1 was replaced by a singlet atδH 2.13 (δC29.4) assigned to a methyl ketone unit in 2. This was
Figure 1.Selected1H,1H COSY and1H,13C HMBC correlations of 1, 2, and 3.
Figure 2. Energy-minimized conformation of preussilide A (1) in solution [selected NOEs of 1 in front (red arrows) and in the rear (green arrows); the black arrows show the negative chirality in 1 based on ECD analysis].
Figure 3.ECD spectra of compounds 1−4 in ethanol.
supported by the downfield shift of the signals for H2-3 in 2 at δH2.89 and 3.45 (δH1.96 dd and 2.53 dd in 1). In contrast, a secondary alcohol was assigned to C-10 in 2 atδH3.59 andδC
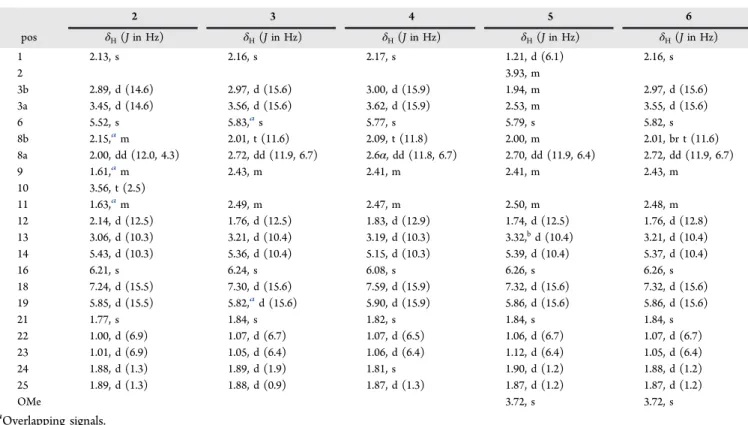
77.5, supported by upfield shifts of the carbon signals C-9 and C-11 atδC43.6 and 43.3, respectively (δC50.0 andδC50.1 in 1) and by relevant HMBC correlations. Thus, the planar Table 2.1H NMR Spectroscopic Data of Preussilides B−F (2−6) (700 MHz, Methanol-d
4) 2 3 4 5 6 pos δH(J in Hz) δH(J in Hz) δH(J in Hz) δH(J in Hz) δH(J in Hz) 1 2.13, s 2.16, s 2.17, s 1.21, d (6.1) 2.16, s 2 3.93, m 3b 2.89, d (14.6) 2.97, d (15.6) 3.00, d (15.9) 1.94, m 2.97, d (15.6) 3a 3.45, d (14.6) 3.56, d (15.6) 3.62, d (15.9) 2.53, m 3.55, d (15.6) 6 5.52, s 5.83,as 5.77, s 5.79, s 5.82, s 8b 2.15,am 2.01, t (11.6) 2.09, t (11.8) 2.00, m 2.01, br t (11.6) 8a 2.00, dd (12.0, 4.3) 2.72, dd (11.9, 6.7) 2.6α, dd (11.8, 6.7) 2.70, dd (11.9, 6.4) 2.72, dd (11.9, 6.7) 9 1.61,am 2.43, m 2.41, m 2.41, m 2.43, m 10 3.56, t (2.5) 11 1.63,am 2.49, m 2.47, m 2.50, m 2.48, m 12 2.14, d (12.5) 1.76, d (12.5) 1.83, d (12.9) 1.74, d (12.5) 1.76, d (12.8) 13 3.06, d (10.3) 3.21, d (10.4) 3.19, d (10.3) 3.32,bd (10.4) 3.21, d (10.4) 14 5.43, d (10.3) 5.36, d (10.4) 5.15, d (10.3) 5.39, d (10.4) 5.37, d (10.4) 16 6.21, s 6.24, s 6.08, s 6.26, s 6.26, s 18 7.24, d (15.5) 7.30, d (15.6) 7.59, d (15.9) 7.32, d (15.6) 7.32, d (15.6) 19 5.85, d (15.5) 5.82,ad (15.6) 5.90, d (15.9) 5.86, d (15.6) 5.86, d (15.6) 21 1.77, s 1.84, s 1.82, s 1.84, s 1.84, s 22 1.00, d (6.9) 1.07, d (6.7) 1.07, d (6.5) 1.06, d (6.7) 1.07, d (6.7) 23 1.01, d (6.9) 1.05, d (6.4) 1.06, d (6.4) 1.12, d (6.4) 1.05, d (6.4) 24 1.88, d (1.3) 1.89, d (1.9) 1.81, s 1.90, d (1.2) 1.88, d (1.2) 25 1.89, d (1.3) 1.88, d (0.9) 1.87, d (1.3) 1.87, d (1.2) 1.87, d (1.2) OMe 3.72, s 3.72, s aOverlapping signals.
Table 3.13C NMR Spectroscopic Data of Preussilides B−F (2−6) (175 MHz, Methanol-d4)
2 3 4 5 6
pos δC, type δC, type δC, type δC, type δC, type
1 29.4, CH3 29.8, CH3 29.8, CH3 23.7, CH3 29.8, CH3 2 209.9, C 209.3, C 209.7, C 68.1, CH 209.3, C 3 47.9, CH2 47.5, CH2 47.6, CH2 43.8, CH2 47.5, CH2 4 122.9, C 124.3, C 124.4, C 127.9, C 124.2, C 5 128.8, C 129.1, C 128.8, C 128.0, C 129.1, C 6 120.9, CH 124.1, CH 123.9, CH 124.5, CH 124.0, CH 7 143.9, C 139.0, C 139.0, C 137.6, C 139.0, C 8 39.5, CH2 43.6, CH2 43.7, CH2 42.4, CH2 43.6, CH2 9 43.6, CH 49.9, CH 49.9, CH 50.0, CH 49.9, CH 10 77.5, CH 214.4, C 214.7, C 214.7, C 214.4, C 11 43.3, CH 50.4, CH 50.4, CH 50.0, CH 50.4, CH 12 45.6, CH 51.7, CH 51.6, CH 52.0, CH 51.7, CH 13 39.2, CH 40.7, CH 40.8, CH 41.0, CH 40.7, CH 14 138.3, CH 136.9, CH 135.7, CH 138.3, CH 137.0, CH 15 132.2, C 133.5, C 133.2, C 132.7, C 133.5, C 16 143.7, CH 144.4, CH 140.3, CH 144.9, CH 144.7, CH 17 133.3, C 133.5, C 133.1, C 133.3, C 133.5, C 18 150.9, CH 152.1, CH 141.9, CH 152.1, CH 152.1, CH 19 119.7,bCH 118.0, CH 116.9, CH 117.1, CH 117.2, CH 20 172.5,bC 171.0, C 173.8, C 169.7, C 169.7, C 21 18.5, CH3 18.4, CH3 18.5, CH3 18.6, CH3 18.5, CH3 22 18.9, CH3 15.4, CH3 15.4, CH3 15.3, CH3 15.4, CH3 23 16.0, CH3 11.6, CH3 11.6, CH3 12.0, CH3 11.6, CH3 24 17.2, CH3 17.2, CH3 17.3, CH3 17.2, CH3 17.2, CH3 25 14.1, CH3 14.1, CH3 20.8,cCH3 14.0, CH3 14.0, CH3 OMe 52.1, CH3 52.1, CH3
aOverlapping signals.bSignals were assigned from HSQC and HMBC.cChemical shift value supports the different double-bond geometry in 4.
structure of 2 was assigned for preussilide B. Comprehensive analysis of ROESY data and coupling constant values indicated that the relative configuration of 2 is analogous to that of 1. Furthermore, NOE correlations between H-10 and its neighbors H-9 and H-11 together with the small J values (2.5 Hz) showed that all three were on the same face of the decalin moiety. Preussilide B (2) again showed a negative Cotton effect atλmax316 nm (Δε = −48.21) and a positive Cotton effect at λmax270 nm (Δε = +29.04). Thus, the ECD data of 2 indicated an absolute configuration analogous to that of 1, so that the absolute configuration of preussilide B (2) was unambiguously assigned as 9R, 10R, 11S, 12S, 13R.
Preussilide C (3) was obtained as a yellow gum. The molecular formula was determined as C25H32O4 by positive HRESIMS analysis. The molecular weight of 3 showed a difference of 2 Da less than that of 1 and 2, suggesting an additional double bond in 3. The NMR data of 3 were very similar to those of 1 and 2, except for the presence of two ketone carbonyl carbon signals atδC209.3 and 214.4 in the13C NMR spectrum (Table 3). In addition, the13C NMR spectrum lacked the carbon signal for the oxygenated methines C-2 and C-10 in 1 and 2, respectively. HMBC correlations confirmed the diketone planar structure of preussilide C (3) as shown in
Figure 1. Compound 3 showed a similar ECD spectrum to that of 1, with a negative Cotton effect at λmax 304 nm (Δε = −27.09) and a positive Cotton effect at λmax 265 nm (Δε = +13.96) (Figure 3). Thus, the absolute configuration of preussilide C (3) was deduced to be 9R, 11S, 12S, 13R.
Preussilide D (4) has the same molecular formula as preussilide C (3) (C25H32O4) and showed nearly identical NMR spectra, except that the resonances attributed to methine C-18 shifted fromδC152.1,δH7.30 in 3 toδC141.9,δH7.59 in 4. Furthermore, the methyl group C-25 signals were shifted fromδC14.1,δH1.89 in 3 toδC20.8,δH1.87, while methine C-16 was shifted fromδC144.4,δH6.24 in 3 toδC140.3,δH6.08, suggesting that the unsaturated side chain of 4 incorporates a stereochemical change relative to 3. The ROESY spectrum of 4 showed NOE correlations between H-16 and H3-25, indicating the Δ16,17 Z-configuration. This was supported by an NOE between H-14 and H-18. Furthermore, the13C NMR shift for H3-25 (δC20.8), which is downfield compared to H3-25 in all preussilides confirms the Z-configuration at Δ16,17. Conse-quently, the geometry of the double bonds in 4 was assigned as 14E, 16Z, 18E. The ECD data of 4 indicated the same absolute configuration of the decalin rings as for 3 (9R, 11S, 12S, 13R) (Figure 3).
Compounds 5 and 6 were identified as methylated derivatives of 1 and 3 with the molecular formulas of C26H36O4 and C26H34O4, respectively. The NMR spectra
showed additional methyl ester signals at δC52.1, δH 3.72 in both compounds, indicating the esterification of the C-20 carboxylic acid in 5 and 6. The ROESY and electronic circular dichroism (ECD) data of preussilide E (5) indicated the same absolute configuration as for 1 (2S, 9R, 11S, 12S, 13R) and the same absolute configuration for preussilide F (6) as that for 3 (9R, 11S, 12S, 13R). A culture broth from a small fermentation of the fungus was extracted with acetone, and contact with methanol was completely avoided in order to check the biogenetic origin of the methoxy groups in preussilides E (5) and F (6). The LCMS analysis provided an identical chromatogram showing the expected peaks for preussilides E (5) and F (6), which thus were confirmed as genuine metabolic products of the fungus.
The structurally closest related metabolites to preussilides are hamigerone, dihydrohamigerone,20 antarones,19 and two un-named “highly methylated polyketides”.23 The hamigerones were isolated from Hamigera avellanea, and antarones were obtained from Penicillium antarcticum, while the unnamed “highly methylated polyketides” were isolated from a yew-associated Penicillium species. Hamigerones were reported to have antifungal activity against the plant pathogens Pyricularia oryzae and Venturia inaequalis, while the “highly methylated polyketides” were active against Sclerotinia sclerotiorum. The antarones, however, were reported to be devoid of antimicro-bial and cytotoxic effects.
The antimicrobial activity profile of preussilides A−F (1−6) was determined. The MIC values against filamentous fungi showed that only compounds 1 and 3 exhibited mild antifungal activity, whereas remaining compounds 2, 4, 5, and 6 were inactive against the organisms tested (Supporting Information, Table S2). The MIC values of compounds 1 and 3 were determined against Mucor plumbeus as 150 and 37.5 μg/mL, respectively. Interestingly, the triene acid preussilide C (3) showed the strongest activity against Aspergillus f umigatus, with an MIC value of 8.3μg/mL, and was thus more potent than the positive control cycloheximide (MIC 33.3μg/mL), followed by preussilide A (1), with an MIC value of 35.5 μg/mL. Furthermore, in a standard disk assay, preussilides A (1) and C (3) inhibited the growth of the plant pathogen S. sclerotiorum, affording inhibition zones of ca. 28 and 29 mm, respectively, at 100μg/paper disk, as compared to the positive control nystatin (32 mm at 20μg/paper disk) after 5 days. No antibacterial or antiyeast activity (see Supporting Information) was observed with preussilides. No nematicidal activity at up to 100μg/mL against Caenorhabditis elegans and no phytotoxic effects in plant germination assays with Setaria italica and Lepidium sativum at 100μg/paper disk were observed.
Table 4. Cytotoxic Effect (IC50) of Preussilides A−F (1−6) against Different Normal and Cancer Cell Linesa
IC50[μM]
cell line 1 2 3 4 5 6 ref
mousefibroblasts L929 6.5 17.3 9.1 24.7 80.0 53.6 1.7× 10⁻³
HeLa cells KB3.1 6.0 11.3 2.5 17.4 23.0 51.2 6.1× 10⁻⁵
squamous carcinoma A431 20.3 35.1 10.1 17.9 55.8 >2437.5 7.3× 10⁻⁵
human lung carcinoma A549 60.3 70.3 22.9 47.9 41.2 >2437.5 1.5× 10⁻⁴
ovarian carcinoma SKOV-3 22.6 32.4 15.6 20.19 29.1 >2437.5 2.36× 10⁻⁵
human prostate cancer PC-3 47.7 60.2 18.4 45.4 41.2 >2437.5 2.5× 10⁻⁴
human breast adenocarcinoma MCF-7 24.3 22.1 7.3 15.4 55.8 >2437.5 1.5× 10⁻⁴
human osteosarcoma U2OS 7.03 >2511 6.8 >2523.7 >2425.6 22.2 1.04× 10⁻⁴
aReference: epothilone B.
Cytotoxicity Screening. To evaluate cytotoxicity of the six polyketides on viability of different mammalian cell lines, we performed MTT assays. The results showed that all compounds exhibit modest to very weak cytotoxicity (Table 4) with IC50 values ranging from 2.5 to 80.0μM. Only preussilides A (1) and C (3) showed IC50 values below 10 μM for the murine cells (L929) and cancer cell lines used (HeLa KB.3.1 and U2OS, in addition to MCF-7 for preussilide C only). However, their effect against the other cancer cell lines tended to lack activity. Moreover, all compounds caused nucleic fragmentation in the range of IC50 values in L929 cells (see Supporting
Information).
Effects on Cell Morphology. To further analyze alterations observed in standard-screening assays, the actin and microtubule cytoskeleton, as well as the nuclear lamina and
DNA of treated cells, were stained. Effects were most pronounced when using preussilides A (1) and C (3), and a more detailed analysis of their biological effects was conducted. Complementary results from the other compounds can be viewed in the Supporting Information. Immunofluorescence experiments revealed that the actin cytoskeleton was not affected by any of the tested compounds. In contrast to actin, the microtubule cytoskeleton showed significant alterations during mitosis with multipolar spindles (Figure 4B,C) in a significant amount of dividing cells. Whereas this can in principle occur in cancer cells such as U2OS, multipolar spindles were rare in control-treated U2OS, which mainly displayed normal bipolar mitotic spindles, and properly divided cells (Figure 4A). Moreover, in treated populations we observed numerous “inaccurate” cell divisions, giving birth to
Figure 4.Effects of preussilides A and C (1 and 3) on the morphology of human osteosarcoma cells (U2OS) The actin cytoskeleton is not altered upon treatment (B and C) as compared to controls (A). Antibody staining of microtubules (as indicated in the panels) uncovers multipolar and duplicated spindles in treated cell populations as compared to predominantly canonical bipolar spindles in mock-treated cells (DMSO-treated U2OS). Aberrantly sized cells with abnormal small nuclei are observed in treated cells (B, bottom panel). Note that small cells may originate from inaccurate cell division, e.g., due to spindle multiplication. Pseudocolored merge is shown in the far right of every panel. Scale bar is 20μm.
daughter cells with unequal cell and nuclear sizes (Figure 4B lower panel). Hence, this phenotype leads to unequal DNA distribution between the two new cells, while both daughter cells form a complete nucleus with intact nuclear lamina despite
the uneven size. The most significant effects were again observed in cells treated with preussilide C (3). Also, cells with fragmented nuclei were observed more frequently than in
Figure 5.Preussilide treatment induces generation of small cells with reduced nuclear size in the human osteosarcoma cell line U2OS. (A) FACS data of PI-stained preussilides and control-treated cells. Note the occurrence of small cells/particles with low DNA content in the treated populations (middle panel, 5μg/mL, 1.96% of cells; bottom panel, 10 μg/mL, 25.5% of cells) as compared to mock-treated (top panel, DMSO-treated, 0.19% of cells). When classifying cell cycle phases by analyzing the DNA content per cell/particle (right panel), this population fell into the sub-G1 window (outlined in red as compared to blue in the control). For a full panel on all compounds refer to theSupporting Information). (B) Cells treated with DMSO, 5 or 10μg/mL of compound 3, or 250 nM staurosporine and stained with fluorescent caspase 3/7 Green substrate were analyzed by FACS. Note that there is no increase in apoptosis as compared to the DMSO control (8%) upon preussilide treatment (5μg/mL 3.5% and 10 μg/mL 5.7%). In contrast, staurosporine induced significant programmed cell death (22.6%).
control populations, reminiscent of the screening result in L929 cells.
In complementary experiments, preussilide-treated cells were subjected to FACS. To do so, cells were either left untreated, mock-treated, or treated with 5 and 10 μg/mL of each compound, and prepared for flow cytometric analysis upon staining of DNA, tubulin, and lamin. DNA staining was used to classify cells according to cell cycle phases (G1, G2-M, S, and sub-G1). Strikingly,flow cytometry of cells treated with 5−10 μg/mL of preussilides A (1) and C (3) revealed the appearance of a significant population of sub-G1 cells/particles (Figure 5A andSupporting Information, Figure S4). While this population in most cases indicated programmed cell death/apoptosis, we conclude that this sub-G1 population represents those smaller cells observed before eventually being derived from inaccurate cell divisions (Figure 4). This conclusion is supported by the fact that no apoptotic figures were observed in fluorescence microscopy experiments that could explain this population. To verify that we here induce a specific phenotype other than apoptosis, we repeated treatments leading to the most significant sub-G1 populations and specifically stained for caspase activation, a hallmark of apoptosis. As a positive control, cells were treated with staurosporine to induce apoptosis. The result clearly showed the small cells represented in the sub-G1 population in FACS experiments were not apoptotic, i.e., do not show caspase 3/7 activation, whereas staurosporine clearly induced apoptosis in U2OS cells (Figure 5B). Noteworthy, preussilide C-treated cells in general, and preussilide C-treated sub-G1 cells in particular, displayed increased amounts of tubulin and lamin staining (see
Supporting Information), which also speaks against apoptosis that would otherwise lead to declining signals due to protein degradation.
Together, these data suggested that treatment with preussilides A (1) and C (3) had a profound effect on the cell cycle with multipolar spindles and inaccurate/unequal cell divisions, resulting in cells that cannot multiply further and die, explaining the loss of biomass observed in the cytotoxic screening. Some of these cells were abnormally small, as seen in immunofluorescence and as detected as a sub-G1 population in FACS. Apoptotic cell death appears not to be the predominant reason, as canonical apoptotic figures were rarely observed in immunofluorescence, and moreover, caspase 3/7 activation was at the detection level even after prolonged incubation with high concentrations of the most active preussilide C. Nonetheless, multipolar spindles were observed more frequently at concentrations as low as 0.25μg/mL, which is 10- to 20-fold below concentrations showing significant cytotoxicity. Thus, our data indicate that the mechanism of cell manipulation by preussilides A (1) and C (3) might target an enzyme involved in coordination of the cell division cycle. Hence, they might, for instance, affect timing or spindle assembly mechanisms, leading to defects in chromosome segregation and/or spindle geometry.
■
EXPERIMENTAL SECTIONGeneral Experimental Procedures. Optical rotations were determined with a PerkinElmer 241 MC polarimeter (using the sodium D line and a quartz cuvette with a 10 cm path length and 1 mL volume). UV/vis spectra were recorded on a Shimadzu UV/vis-2450 spectrophotometer using ethanol (UVASOL, Merck); CD spectra were recorded on a JASCO spectropolarimeter, model J-815. HPLC-DAD/MS analysis was performed using an amaZon speed ETD ion
trap mass spectrometer (Bruker Daltonics) in positive and negative ionization modes. The mass spectrometer was coupled to an Agilent 1260 series HPLC-UV system (Agilent Technologies) [column 2.1× 50 mm, 1.7μm, C18Acquity uPLC BEH (Waters), solvent A: H2O +
0.1% formic acid; solvent B: acetonitrile (ACN) + 0.1% formic acid, gradient: 5% B for 0.5 min, increasing to 100% B in 20 min, maintaining isocratic conditions at 100% B for 10 min,flow = 0.6 mL/ min, UV−vis detection 200−600 nm]. HRESIMS spectra were recorded on a maXis ESI TOF mass spectrometer (Bruker Daltonics) [scan range m/z 100−2500, rate 2 Hz, capillary voltage 4500 V, dry temperature 200 °C], coupled to an Agilent 1200 series HPLC-UV system [column 2.1 × 50 mm, 1.7 μm, C18 Acquity uPLC BEH
(Waters), solvent A: H2O + 0.1% formic acid; solvent B: ACN + 0.1%
formic acid, gradient: 5% B for 0.5 min, increasing to 100% B in 19.5 min, maintaining 100% B for 5 min, FR = 0.6 mL/min, UV−vis detection 200−600 nm]. The molecular formulas were calculated including the isotopic pattern (Smart Formula algorithm). Preparative HPLC purification was performed at room temperature on an Agilent 1100 series preparative HPLC system [ChemStation software (Rev. B.04.03 SP1); binary pump system; column: Kromasil RP C18, particle
size 7μm, dimensions 250 × 25 mm; mobile phase: ACN and water; flow rate 20 mL/min; diode-array UV detector; 226 fraction collector]. NMR spectra were recorded on a Bruker 500 MHz Avance III spectrometer with a BBFO (plus) SmartProbe (1H 500 MHz,13C 125
MHz) and a Bruker 700 MHz Avance III spectrometer with a 5 mm TCI cryoprobe (1H 700 MHz,13C 175 MHz), locked to the deuterium signal of the solvent. Data acquisition, processing, and spectral analysis were performed with standard Bruker software and ACD/NMR Spectrus. Chemical shifts are given in parts per million (ppm), and coupling constants in hertz (Hz). Spectra were measured in methanol-d4 and acetone-d6; chemical shifts were referenced to the solvent
signals.
Strain Origin and Identification. The endophytic fungus Preussia similis strain DSM 104666 was isolated from healthy roots of the medicinal plant shrubby globularia (Globularia alypum) collected from Ain Touta, Batna 05000 (Algeria), in June 2015, according to established protocols involving surface sterilization24,25After purifica-tion, the fungus was maintained in 10% glycerol in a deep freezer at −80 °C and on YMG slant tubes.26P. similis strain DSM 104666 has
been deposited at DSMZ (German Collection of Microorganisms and Cell Cultures, Braunschweig 38124, Germany). DNA from the fungal strain DSM 104666 was extracted using an EZ-10 Spin Column Genomic DNA Miniprep kit (Bio Basic Canada Inc., Markham, Ontario, Canada). Cell disruption and homogenization was performed using the homogenizer Precellys 24 (Bertin Technologies, France) at a speed of 6000 rpm for 40 s twice. The following primer combinations were used for amplification of three regions of the DNA template: ITS1F/ITS4 (5.8S gene region, the internal transcribed spacer 1 and 2, ITS),27LR0R and LR7 (part of large subunit, LSU),28and EF1-728F/ EF-986R (elongation factor (EF)-1α).29 The fungal strain that
produced the preussilides was identified as P. similis according to morphological and molecular phylogenetic methods (for more details, see theSupporting Information). The sequences used in this study were submitted to GenBank, and the accession numbers assigned to ITS, LSU, and EF-1α gene sequences are KY652380, KY652379, and KY660720, respectively.
Fermentation and Extraction. Twelve 1 L Erlenmeyer flasks containing 400 mL of ZM/2 medium (0.5% molasses, 0.5% oatmeal, 0.15% glucose, 0.4% sucrose, 0.4% mannitol, 0.05% edamine, 0.05% ammonium sulfate, 0.15% calcium carbonate, pH 7.2) were inoculated with small pieces from mature yeast-malt-glucose-agar (YMG) plates and incubated on a rotary shaker at 23°C and 140 rpm.17,30After 34 days, the free glucose was completely depleted as determined by commercial glucose test strips, and the cultures were harvested.26The mycelium was separated from the fermentation broth by vacuum filtration and extracted three times with acetone in an ultrasonic bath at 40°C for 30 min. The solvent was evaporated in vacuo until some aqueous phase remained, followed by three extractions with equal amounts of EtOAc and water. The solvent extract was dried over anhydrous sodium sulfate,filtered, and concentrated under vacuum to 1538
yield the mycelial crude extract. To prepare the crude extract from the supernatant, the culturefiltrate was treated with 2% adsorber resin Amberlite XAD-16N. After filtration, the XAD was extracted three times with acetone in an ultrasonic bath at 40°C for 30 min. The eluate was then treated as described above for the mycelial extract.
Isolation. The crude mycelial extract (850 mg) was subjected to flash chromatography (GRACE Reveleris X2 flash system) with silica gel (40 g) as stationary phase. The column was eluted with mixtures of solvents [solvent A: CH2Cl2, solvent B: CH2Cl2/acetone (80/20, v/v),
solvent C: CH2Cl2/acetone/MeOH (56/14/30, v/v/v)]. First
gradient (AB system) from 0% B to 12% B in 12 min and from 12% B to 20% B in 8 min, second gradient (BC system) from 20% B to 60% C in 20 min and 60% C to 100% C in 10 min and 100% C isocratic for 10 min,flow rate 40 mL min−1, UV detection 254, 280, and 380 nm. Six fractions were collected: F1 (551 mg, tR = 2−6.2
min), F2 (13 mg, tR= 6.9−7.5 min), F3 (17 mg, tR= 8.1−10 min), F4
(10 mg, tR= 11.9−15.7 min), F5 (11.5 mg, tR= 22.9−23.3 min), and
F6 (73 mg, tR = 23.7−24.5 min). Fraction 1 was further purified by
preparative HPLC using a gradient of 55% to 70% solvent B in 50 min, 70% to 100% B for 10 min, and 100% B isocratic for 5 min. The fractions were combined according to UV absorption at 220, 310, and 325 nm and concurrent HPLC-MS analyses. Compound 5 (19 mg) was obtained at tR= 30.9 min, and compound 6 (15 mg) was eluted at
tR= 38.9 min. Fraction F6 (73 mg) and the crude extract derived from
the supernatant (202 mg) were pooled based on similarity in their LC-MS data and further fractionated by the same preparative HPLC protocol using isocratic conditions: 53% solvent B for 40 min. Compounds 1 (9.5 mg), 2 (2 mg), 3 (17 mg), and 4 (2 mg) were eluted respectively at the following retention times: 13.6, 18.2, 21.0, and 27.7 min.
Preussilide A (1): pale yellow gum; [α]25
D−416 (c 0.1, EtOH); UV
(c 0.05 mg/mL, EtOH)λmax(logε) 282 (3.71), 206 nm (3.72); CD (c
1 mg/mL, EtOH)λmax(Δϵ) 302 (−15.01), 265 nm (+8.80); LCMS
m/z 399 [M + H]+(52), 421 [M + Na]+(44), 381 [M + H− H 2O]+
(100), 397 [M− H]−(50), 795 [2M− H]−(100); HRESIMS m/z 399.2518 [M + H]+(calcd for C25H35O4+, 399.2530);1H NMR and 13C NMR seeTable 1.
Preussilide B (2): pale yellow gum; [α]25
D−208 (c 0.1, EtOH); UV
(c 0.05 mg/mL, EtOH)λmax(logε) 291 nm (4.35); CD (c 1 mg/mL,
EtOH)λmax(Δϵ) 316 (−48.21), 270 nm (+29.04); LCMS m/z 399 [M + H]+(51), 421 [M + Na]+(31), 381 [M + H− H 2O]+(63), 397 [M− H]−(100), 795 [2M− H]−(53); HRESIMS m/z 399.2519 [M + H]+(calcd for C 25H35O4+, 399.2530);1H NMR and13C NMR see Tables 2and3.
Preussilide C (3): yellow gum; [α]25
D−78 (c 0.1, EtOH); UV (c
0.05 mg/mL, EtOH)λmax(logε) 282 (4.50), 202 nm (4.61); CD (c 1
mg/mL, EtOH)λmax(Δϵ) 304 (−27.09), 265 nm (+13.96); LCMS m/z 397 [M + H]+(48), 419 [M + Na]+(71), 379 [M + H− H 2O]+ (100), 395 [M− H]−(100), 791 [2M− H]−(89); HRESIMS m/z 397.2362 [M + H]+(calcd for C 25H33O4+, 397.2373);1H NMR and 13C NMR seeTables 2and3.
Preussilide D (4): pale yellow gum; [α]25
D−211 (c 0.1, EtOH); UV
(c 0.05 mg/mL, EtOH)λmax(logε) 281 (4.67), 206 nm (4.62); CD (c
1 mg/mL, EtOH)λmax(Δϵ) 300 (−57.0), 262 nm (+20.66); LCMS
m/z 397 [M + H]+(4), 419 [M + Na]+(48), 816 [2M + Na]+(100),
379 [M + H− H2O]+(7), 395 [M− H]−(100), 792 [2M− H]−
(84); HRESIMS m/z 397.2362 [M + H]+ (calcd for C25H33O4+,
397.2373);1H NMR and13C NMR seeTables 2and3.
Preussilide E (5): pale yellow gum; [α]25
D−170 (c 0.1, EtOH); UV
(c 0.05 mg/mL, EtOH)λmax(logε) 299 (4.67), 202 nm (4.57); CD (c
1 mg/mL, EtOH)λmax(Δϵ) 310 (−56.17), 271 nm (+35.11); LCMS
m/z 413 [M + H]+(17), 435 [M + Na]+(23), 395 [M + H− H 2O]+
(68), 411 [M − H]− (4), 457 [M − H + HCOOH]− (100); HRESIMS m/z 413.2685 [M + H]+(calcd for C
26H37O4+, 413.2686); 1H NMR and13C NMR seeTables 2and3.
Preussilide F (6): yellow gum; [α]25
D−167 (c 0.1, EtOH); UV (c
0.05 mg/mL, EtOH)λmax(logε) 261 (4.24), 206 nm (4.44); CD (c 1
mg/mL, EtOH)λmax(Δϵ) 302 (−7.05), 194 nm (+4.58); LCMS m/z
411 [M + H]+(29), 433 [M + Na]+(50), 393 [M + H− H
2O]+(34),
409 [M− H]−(100); HRESIMS m/z 411.2531 [M + H]+(calcd for
C26H35O4+, 411.2530);1H NMR and13C NMR seeTables 2and3.
Preparation of theS- and R-MTPA Esters of Preussilide A (1). R-(−)-MTPA-Cl (10 μL) was added to a stirred solution of preussilide A (1) (1 mg) and dry pyridine (5μL) in dry CDCl3(100μL) at room
temperature. After complete consumption of preussilide A (1 h), the reaction mixture was diluted by addition of 400 μL of CDCl3. The
produced S-MTPA ester of 1 was submitted to NMR spectroscopy; for
1H NMR data see theSupporting Information, Table S4. In an entirely
analogous fashion, the R-MTPA ester of preussilide A (1) was prepared using S-(+)-MTPA-Cl; for1H NMR data see theSupporting
Information, Table S4.
Biological Activity. The biological activities of the test compounds were evaluated in accordance with literature descriptions: the minimum inhibitory concentrations (MIC) toward bacteria, yeast, andfilamentous fungi were obtained by a serial dilution technique using 96-well microtiter plates,31 except against the plant pathogen
S. sclerotiorum DSM 1946, which did not produce spores. In this instance, a standard disk diffusion assay was performed on YMG medium supplemented with a mycelial suspension of test fungus (20 μg/paper disk of nystatin was used as a positive control).32
Nematicidal activities were determined in vitro on the free-living nematode C. elegans as a model.33Phytotoxic activities were carried out by germination and seedling growth bioassay against S. italic and L. sativum.34
Cytotoxicity Assay. The cytotoxicity effects (IC50) of all
compounds were determined against a panel of eight mammalian cell lines including mouse fibroblasts L929, HeLa cells KB3.1, squamous carcinoma A431, human lung carcinoma A549, ovarian carcinoma SKOV-3, human prostate cancer PC-3, human breast adenocarcinoma MCF-7, and human osteosarcoma U2OS, by using a 5-day MTT assay according to established procedures.35
U2OS Treatment with the New Compounds. Human osteosarcoma cells U2OS (ACC785-DSMZ, Braunschweig, Germany) were grown in DMEM, 4.5 g/L glucose (Ivitrogen, Germany) with 10% fetal bovine serum (Sigma) and 1% glutamate, 1% sodium pyruvate, and 1% nonessential amino acids at 37 °C and 7% CO2.
U2OS cells were seeded on glass coverslips coated withfibronectin in 24-well plates (3× 10⁴cells/well) and allowed to adhere and spread
for 16 h. Adhered cells were treated with varying concentrations (0.25, 0.5, 2.5, 5, and 10μg/mL in DMEM) prepared from a stock solution (1 mg/mL in DMSO) of the six compounds for 24 h. DMSO-treated cells were prepared as a negative control. Subsequent staining of DNA, actin filaments, and microtubules was carried out. For actin and tubulin labeling, the treated cells werefixed with 4% paraformaldehyde (PFA) in phosphate-buffered saline (PBS) for 20 min and washed with PBS. Immunofluorescence staining was performed according to standard procedures by using a mouse monoclonal anti-α-tubulin antibody (Sigma-Aldrich, clone DM1A) for microtubules (MTs) and Phalloi ̈din Alexa Fluor 488 (ThermoFisher, A123799) for F-actin. Secondary reagents were goat anti-mouse Alexa 594 (ThermoFisher, A32723). Finally, after washing with PBS, coverslips were mounted on glass microscope slides in ProLong Diamond antifade mountant with DAPI (ThermoFisher, P36971).
Preussilides A−F (1−6) were probed for potential effects on the nuclear lamina during cell cycle phases. The cells were treated with 0.5 and 5μg/mL for 24 h, then fixed with ice-cold methanol for 15 min, and stepwise rehydrated using PBS. Cells were costained with antibodies against nuclear envelop and MTs by using anti-pan Lamin antibody (abcam, ab20740) and a rat monoclonal antibody to tyrosinated alpha-tubulin overnight. Goat anti-mouse Alexa Fluor 594 (A110329) and goat anti-rat Alexa Fluor 488 (A11006) were used as secondary reagents. Images were acquired on a Zeiss Axiovert 135TV microscope, equipped with a Coolsnap 4k cooled CCD device driven by VisiView software (Vistron Inc., Munich). Images were processed using Fiji (ImageJ)36and Photoshop CS6 (Adobe) software.
Flow Cytometry. Briefly, six-well plates were seeded with 7 × 10⁵/
well U2OS cells and treated with 5 and 10 μg/mL of preussilides (preussilide B was not tested due to sample limitation) for 18 h upon spreading. The cells were then harvested by trypsination andfixed with 1539
2% PFA/PBS. After rehydration with PBS, cell pellets were collected by centrifugation at 500g, resuspended in ice cold methanol, and kept on ice for 30 min. Afterward, the cells were centrifuged and resuspended in FACS-buffer and stained with a mixture of anti-tubulin/anti-lamin antibodies as above in combination with RNase A and propidium iodide (PI) to stain DNA. As secondary antibodies, antibody goat anti-rat Alexa488 and goat anti-mouse Alexa647 (A-21235) were used. For detection of apoptosis, cells were incubated with thefluorescent substrate Cell Event caspase-3/7 green detection reagent C10723 (ThermoFisher) for 10 min prior to fixation. Staurosporine was used to induce apoptosis in U2OS as a positive control (250 nM for 16 h). Cells were analyzed using a FACS Canto (BD Biosciences). Data were analyzed using DIVA 6.1 software.
■
ASSOCIATED CONTENT*
S Supporting InformationThe Supporting Information is available free of charge on the
ACS Publications website at DOI: 10.1021/acs.jnat-prod.7b00064.
Experimental procedures, 1D and 2D NMR data, LCMS data, morphological and phylogenetic details of the producing organism (PDF)
■
AUTHOR INFORMATIONCorresponding Author
*Tel: +49 531 6181-4240. Fax: +49 531 6181 9499. E-mail:
ORCID
Marc Stadler:0000-0002-7284-8671
Notes
The authors declare no competingfinancial interest.
■
ACKNOWLEDGMENTSS.R.N. acknowledges the Ministry of Higher Education and Scientific Research (MESRS) of Algeria for the financial support. S.E.H. is grateful for financial support from the Alexander von Humboldt Foundation. We are grateful to W. Collisi for conducting the bioassays, C. Kakoschke and C. Schwager for recording NMR and HPLC-MS data, A. Otto for excellent technical assistance in cell biology experiments, and M. Rohde for support with electron microscopy. Moreover, we thank C. Plaza for kindly providing the fluorescent substrate Cell Event caspase 3/7 and staurosporine.
■
REFERENCES(1) Bills, G. F.; Gloer, J. B. Microbiol. Spectrum, 2016, 4,10.1128/ microbiolspec.FUNK-0009-2016.
(2) Schulz, B.; Haas, S.; Junker, C.; Andrée, N.; Schobert, M. Curr. Sci. 2015, 109, 39−45.
(3) Ahmed, S. I.; Cain, R. F. Can. J. Bot. 1972, 50, 419−477. (4) Arenal, F.; Platas, G.; Peláez, F. Fungal Divers. 2005, 20, 1−15. (5) Arenal, F.; Platas, G.; Peláez, F. Fungal Divers. 2007, 25, 1−17. (6) Mapperson, R. R.; Kotiw, M.; Davis, R. A.; Dearnaley, J. D. W. Curr. Microbiol. 2014, 68, 30−37.
(7) Abdullah, S. K.; Al-Saadoon; Abdullah, H.; Guarro, J. Nova Hedw 1999, 69, 211−216.
(8) Kruys, Å.; Wedin, M. Syst. Biodivers. 2009, 7, 465−478. (9) Kruys, Å. Phytotaxa 2015, 234, 143−150.
(10) Du, L.; King, J. B.; Morrow, B. H.; Shen, J. K.; Miller, A. N.; Cichewicz, R. H. J. Nat. Prod. 2012, 75, 1819−1823.
(11) Du, L.; Robles, A. J.; King, J. B.; Mooberry, S. L.; Cichewicz, R. H. J. Nat. Prod. 2014, 77, 1459−1466.
(12) Rangel-Grimaldo, M.; Rivero-Cruz, I.; Madariaga-Mazón, A.; Figueroa, M.; Mata, R. J. Nat. Prod. 2017, 80, 582.
(13) Khan, R.; Cain, R. F. Can. J. Bot. 1979, 57, 1174−1186. (14) Arenal, F.; Platas, G.; Pelaez, F. Mycotaxon 2004, 89, 137−151. (15) Weber, H. A.; Swenson, D. C.; Gloer, J. B.; Malloch, D. Tetrahedron Lett. 1992, 33, 1157−1160.
(16) Weber, H. A.; Baenziger, N. C.; Gloer, J. B. J. Am. Chem. Soc. 1990, 112, 6718−6719.
(17) Stadler, M.; Tichy, H.; Katsiou, E.; Hellwig, V. Mycol. Prog. 2003, 2, 95−122.
(18) Karwehl, S.; Stadler, M. Curr. Top. Microbiol. Immunol. 2016, 398, 303−338.
(19) Shiono, Y.; Seino, Y.; Koseki, T.; Murayama, T.; Kimura, K. I. Z. Naturf. 2008, 63b, 909−914.
(20) Breinholt, J.; Kjoer, A.; Olsen, C. E.; Rassing, B. R.; Rosendahl, C. N. Acta Chem. Scand. 1997, 51, 1241−1244.
(21) Harada, N.; Nakanishi, K. Acc. Chem. Res. 1972, 5, 257−263. (22) Boiadjiev, S. E.; Lightner, D. A. Monatsh. Chem. 2005, 136, 489−508.
(23) Stierle, D. B.; Stierle, A. A.; Ganser, B. K. J. Nat. Prod. 1999, 62, 1147−1150.
(24) Lodge, D. J.; Fisher, P. J.; Sutton, B. C. Mycologia 1996, 88, 733−738.
(25) Kusari, S.; Lamshöft, M.; Zühlke, S.; Spiteller, M. J. Nat. Prod. 2008, 71, 159−162.
(26) Stadler, M.; Asakawa, Y.; Hashimoto, T.; Rogers, J. D.; Ju, Y.; Wetzstein, H. Mycol. Res. 2001, 105, 1191−1205.
(27) White, T. J., Bruns, T. D.; Lee, S. B. In PCR Protocols: A Guide to Methods and Applications; Academic Press: NewYork, 1990; pp 315− 322.
(28) Vilgalys, R.; Hester, M. J. Bacteriol. 1990, 172, 4238−4246. (29) Carbone, I.; Kohn, L. M. Mycologia 1999, 3, 553−556. (30) Kuhnert, E.; Surup, F.; Wiebach, V.; Bernecker, S.; Stadler, M. Phytochemistry 2015, 117, 116−122.
(31) Surup, F.; Thongbai, B.; Kuhnert, E.; Sudarman, E.; Hyde, K. D.; Stadler, M. J. Nat. Prod. 2015, 78, 934−938.
(32) Anke, H.; Zähner, H. Arch. Microbiol. 1978, 116, 253−257. (33) Stadler, M.; Anke, H.; Bergquist, K. E.; Sterner, O. J. Antibiot. 1993, 46, 968−971.
(34) Anke, H.; Hillen-Maske, E.; Steglich, W. Z. Naturforsch. 1989, 44C, 7−11.
(35) Wittstein, K.; Rascher, M.; Rupcic, Z.; Löwen, E.; Winter, B.; Köster, R. W.; Stadler, M. J. Nat. Prod. 2016, 79, 2264−2269.
(36) Schindelin, J.; Arganda-Carreras, I.; Frise, E.; Kaynig, V.; Longair, M.; Pietzsch, T.; Preibisch, S.; Rueden, C.; Saalfeld, S.; Schmid, B.; Tinevez, J.-Y. J.-Y.; White, D. J.; Hartenstein, V.; Eliceiri, K.; Tomancak, P.; Cardona, A.; Liceiri, K.; Tomancak, P.; A, C. Nat. Methods 2012, 9, 676−682.