Relationships between C respiration and fine particulate organic matter
(250-50 µm) weight
L.-Stella Koutikaa, Nicolas Dassonvillea, Sonia Vanderhoevena, Lydie Chapuis-Lardyb, Pierre Meertsa aUniversite Libre de Bruxelles, Laboratoire de Génétique et Ecologie Végétales, Chaussée de Wavre 1850, B-1160 Brussels, Belgium
bIRD, Madagascar
ABSTRACT
Soil organic matter (SOM) status was evaluated using the relationships between two independent soil variables, i.e., C respiration and the weight of particulate organic matter POM (4000-50 µm) under different vegetation covers and ecosystems of central Belgium. A positive relationship was found between the weight of the finest POM fraction, i.e., fine POM fraction (250-50 urn) and C respiration after 1 week (R2 = 0.34, n = 120, p<
0.0001) and 2 weeks (R2 = 0.28, n = 120, p < 0.0001) of incubation. Therefore, we assumed that the C respiration
and the weight of fine POM might be used to evaluate the SOM status under different vegetation covers and ecosystems.
Keywords: C respiration ; Fine particulate organic matter (250-50 µm) ; Texture ; Vegetation cover
1. INTRODUCTION
Organic matter affects soil fertility, crop productivity, and terrestrial cycling of C, N and P. Particulate organic matter (POM), one of active soil organic matter (SOM) forms has been evaluated by Cambardella and Elliot [2] and Vanlauwe et al. [12] to characterize SOM status in different agricultural systems. POM might be used as early indicator of SOM status after the change of plant community composition and agricultural systems. POM fractions are significant in SOM turnover, because they may serve as a readily decomposable substrate for micro-organisms, and as a short-term nutrient reservoir for plants. POM is an increasingly popular measure of labile SOM, because it responds readily to soil management, often identifying statistically significant trends when measures of total SOM would not [13]. To specify its effects, POM might be split into fractions [12,8]. In acidic soils of Southern Cameroon, the effectiveness of leguminous fallow has been shown by an increase in N content of medium (2000-250 |xm) and fine POM (250-53 µm) [9].
Soil C respiration has been used to evaluate C biodegrad-ability, and is an appropriate method to evaluate SOM status in the natural or managed ecosystems. Koutika et al. [7] used mineralised C of whole soils and its fractions to characterize SOM under pasture soils and forest counterparts in state of Para, eastern Brazilian Amazon Basin. By studying POM status and C mineralization, Koutika et al. [10] showed that SOM dynamics change after invasion by exotic plants: Solidago gigantea and Prunus serotina invasions induced an enhancement of SOM dynamics (high C contents of POM fractions and high soil C mineralization). While Heracleum
mantegazzia-num and Fallopia japonica invasions, slowed SOM dynamics (lower POM weight and C and N contents and
lower C mineralization). Therefore, the aim of the present paper is to combine the two variables, i.e., C respiration and POM status to evaluate SOM status under different vegetation covers and ecosystems.
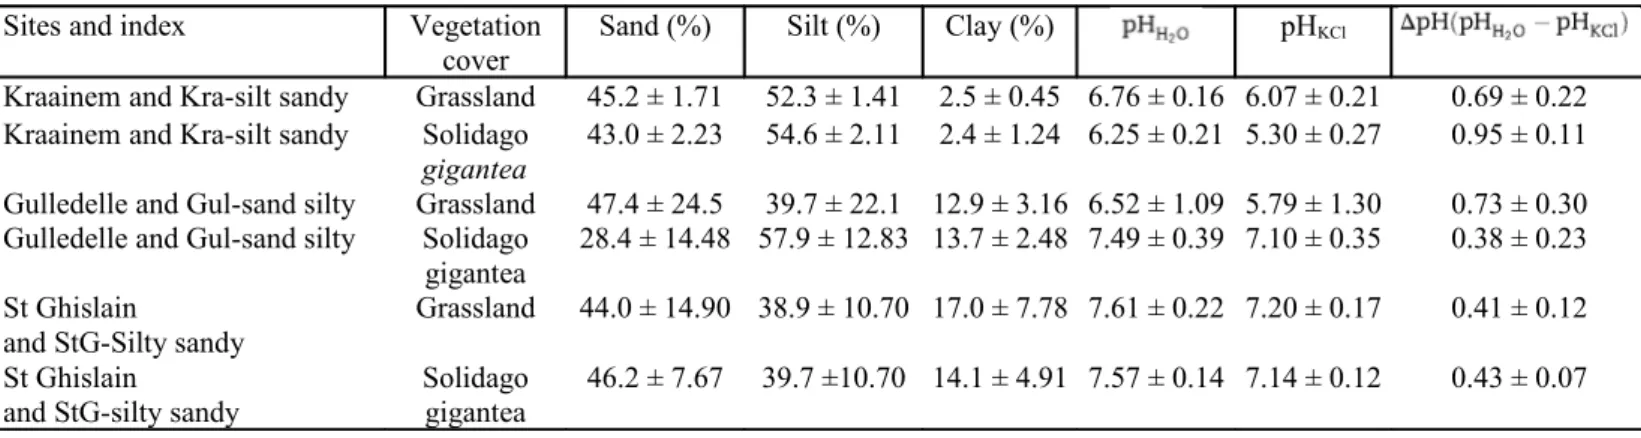
Table 1 - Soil texture, pH and vegetation cover of Kraainem, Gulledelle and St Ghislain (Solidago gigantea)
Sites and index Vegetation
cover Sand (%) Silt (%) Clay (%) pHKCl
Kraainem and Kra-silt sandy Grassland 45.2 ± 1.71 52.3 ± 1.41 2.5 ± 0.45 6.76 ± 0.16 6.07 ± 0.21 0.69 ± 0.22 Kraainem and Kra-silt sandy Solidago
gigantea
43.0 ± 2.23 54.6 ± 2.11 2.4 ± 1.24 6.25 ± 0.21 5.30 ± 0.27 0.95 ± 0.11 Gulledelle and Gul-sand silty Grassland 47.4 ± 24.5 39.7 ± 22.1 12.9 ± 3.16 6.52 ± 1.09 5.79 ± 1.30 0.73 ± 0.30 Gulledelle and Gul-sand silty Solidago
gigantea
28.4 ± 14.48 57.9 ± 12.83 13.7 ± 2.48 7.49 ± 0.39 7.10 ± 0.35 0.38 ± 0.23 St Ghislain
and StG-Silty sandy Grassland 44.0 ± 14.90 38.9 ± 10.70 17.0 ± 7.78 7.61 ± 0.22 7.20 ± 0.17 0.41 ± 0.12
St Ghislain
and StG-silty sandy Solidago gigantea 46.2 ± 7.67 39.7 ±10.70 14.1 ± 4.91 7.57 ± 0.14 7.14 ± 0.12 0.43 ± 0.07
2. MATERIALS AND METHODS
Eight sites were selected based on following criteria under different vegetation covers (grassland or forest): (i) a well established (i.e., at least 10-year-old) and still increasing population of S. gigantea, P. serotina, H.
mantegazzianum and F. Ja-ponica, and clearly distinct from the surrounding vegetation; (ii) adjacent (i.e., few
meters apart) zones of uninvaded vegetation consisting of herbaceous native species, such as Epi-lobium hirsutum, Holcus lanatus, Betula pendula and Fagus syluatica, more details on vegetation cover are given in Ref. [10]; and (iii) a soil auger investigation that suggested a relatively homogenous soil cover in the whole area (i.e., no apparent topsoil difference between invaded stands and uninvaded zones). The different sites are Kraainem, Gulledelle, Saint Ghislain, Kauwberg, Louvain-la-Neuve, Massart garden, Ganshoren and Enfants Noyés. Kraainem is located at 5 km from Brussels. Gulledelle, Kauwberg, Ganshoren, Enfants Noyés and Massart garden are located in the Brussels-Capital Region, while Saint Ghislain is located at 50 km and Louvain-la-Neuve at 25 km from Brussels. At the end of autumn 2003, soil samples were collected using a soil core sampler (4 cm diameter, 0-10 cm depth) in six 1-m2 plots in invaded and uninvaded situations at each site. Soil sample at
each place is composed of a bulk sample made of 10 independent cores in 1 m x 1 m area. Soils were air-dried, crushed and passed through a 4 mm sieve (POM) and a 2 mm sieve (other analyses). There are six replicates at each location.
Particle-size distribution was determined using the pipette method after H2O2 pre-treatment and
Na-citrate dispersion.
SOM was fractionated into POM (4000-50 µm) fractions according to the procedure described by Cambardella and Elliot [2] and modified by Vanlauwe et al. [12] and Koutika et al. [8]. The obtained coarse POM (4000-250 µm) and fine POM (250-50 µm) were dried at 45 °C and weighted. C respiration was determined after 1, 2, 4 and 6 weeks of soil incubation. Ten grams of sieved soil at 2 mm and moistened with 2 ml of distilled water were placed in the 150 ml plastic bottle with 10 ml of NaOH, and introduced in the small bottle. The CO2 of the
small bottle was captured by titration of C in the NaOH with 0.1 M H2SO4 on the Radiometer TIM 900 Titration
Manager pH meter using an ABU 901 Autoburette Radiometer. Statistical analyses were made using Stastitica.
Table 2 - Soil texture, pH and vegetation cover of Kauwberg and Louvain-la-Neuve (Prunus serotina)
Sites and index Vegetation
cover Sand (%) Silt (%) Clay (%) PHKC1
Kauwberg and Kau-silty sandy Grassland 14.6 ± 3.60 79.8 ± 3.31 5.6 ± 1.18 5.10 ± 0.17 3.97 ± 0.10 1.13 ± 0.08 Kauwberg and Kau-silty sandy Prunus serotina 16.7 ± 2.97 71.8 ± 5.61 11.5 ± 5.27 5.38 ± 0.30 4.32 ± 0.33 1.05 ± 0.07 Louvain-la-Neuve and LLN-sandy Forest 81.7 ± 4.47 12.4 ± 5.41 5.9 ± 1.20 3.96 ± 0.04 3.05 ± 0.12 0.90 ± 0.13 Louvain-la-Neuve and LLN-sandy Prunus in
hetero forest 85.6 ± 1.58 12.3 ± 1.85 2.1 ± 0.56 3.90 ± 0.04 2.85 ± 0.06 1.05 ± 0.07 Louvain-la-Neuve and LLN-sandy Prunus in Pinus
forest
86.6 ± 1.57 9.6 ± 4.32 3.8 ± 3.34 4.00 ± 0.07 2.95 ± 0.03 1.04 ± 0.05
Soils are of different textures from sandy to clay silty (Tables 1-4). C respiration was positively correlated to after 1 week (R2 = 0.39, n = 120, p < 0.0001), 2 weeks (R 2 = 0.40, n = 120, p < 0.0001), and 4 weeks (R 2
= 0.25, n = 120, p < 0.0001) and to pHKC1 after 1 week (R 2 = 0.39, n = 120, p < 0.0001), 2 weeks (R 2 = 0.42, n =
120, p < 0.0001), and 4 weeks (R 2 = 0.26, n = 120, p < 0.0001). The weight of coarse POM (4000-250 µm) was
negatively correlated to and pHKCl while a positive correlation was found between coarse POM and
. The weight of fine POM was positively correlated to and pHKCl and the contrary was
found for ΔpH. There are positive correlations between C respiration after 1 and 2 weeks of incubation and the weight of fine POM (Fig. 1). These results show that C respiration is strongly related to the weight of fine POM, and mainly fine POM contributed most to C respiration during the incubation of sieved soil (<2 mm) in the laboratory. C dynamics or SOM status are often overlooked in favour of long-term changes because analytical techniques used to examine changes in soil C or SOM status are often insensitive to detecting small changes [1,11]. For other purposes, the task of evaluating the contribution of different inputs in SOM status has been pursued effectively through isotopic approaches, which permit the separation of various sources of C [3-6]. In the present case, natural process of SOM fractionation was not estimated by techniques used to analyse long-term changes or by isotopic analyses, but by combining the weight of POM with C respiration.
It is appears that during the natural process of SOM fractionation, coarse POM (4000-250 µm) which constituted the primary material of SOM, fractionates into a small fraction, i.e., fine POM (250-50 µm). The latter
fractionates into the smaller fractions afterwards. The last step seems to be enhanced during the C respiration in the laboratory, as shown by the positive correlation between the fine POM weight and C respiration. The relationship between the two variables indicates a further natural pathway of coarse SOM fractionation into a smaller fraction linked with mineral fraction <50 µm. Therefore, the weight of fine POM (250-50 µm) combined with C respiration may be a successful tool in SOM status evaluation under different vegetation covers and ecosystems.
Therefore, the correlation of POM status, mainly the weight of fine POM (250-50 µm) and C respiration, showed that fine POM contributed most to C respiration during the two first weeks of incubation of sieved soil (<2 mm) in the laboratory. Therefore, the present paper shows that the combination of the two variables simply obtained, i.e., C respiration and POM status, is of some importance when evaluating SOM status under different vegetation covers and ecosystems.
Table 3 - Soil texture, pH and vegetation cover of Massart garden, Ganshoren and Enfants Noyés (Heracleum
mantegazzianum)
Sites and index Vegetation cover Sand (%) Silt (%) Clay (%) pH KC1
Massart garden and JJM-silty Forest 10.3 ± 0.57 76.0 ± 1.02 13.7 ± 0.78 5.40 ± 0.11 4.48 ± 0.20 0.92 ± 0.15 Ganshoren and Gans-clay silty Grassland 8.8 ± 2.05 64.3 ± 6.81 26.9 ± 7.61 7.82 ± 0.15 7.23 ± 0.04 0.59 ± 0.13 Ganshoren and Gans-clay silty Heracleum
mantegazzianum
30.7 ± 12.24 51.9 ± 7.98 17.4 ± 4.76 7.92 ± 0.30 7.36 ± 0.23 0.55 ± 0.08 Enfants Noyés and ENhm-silty Forest 9.3 ± 2.56 73.6 ± 5.85 17.1 ± 6.11 7.39 ± 0.18 7.01 ± 0.13 0.38 ± 0.09 Enfants Noyés and ENhm-silty Heracleum
mantegazzianum
13.4 ± 5.92 66.3 ± 5.98 20.3 ± 2.40 7.70 ± 0.12 7.10 ± 0.04 0.60 ± 0.08
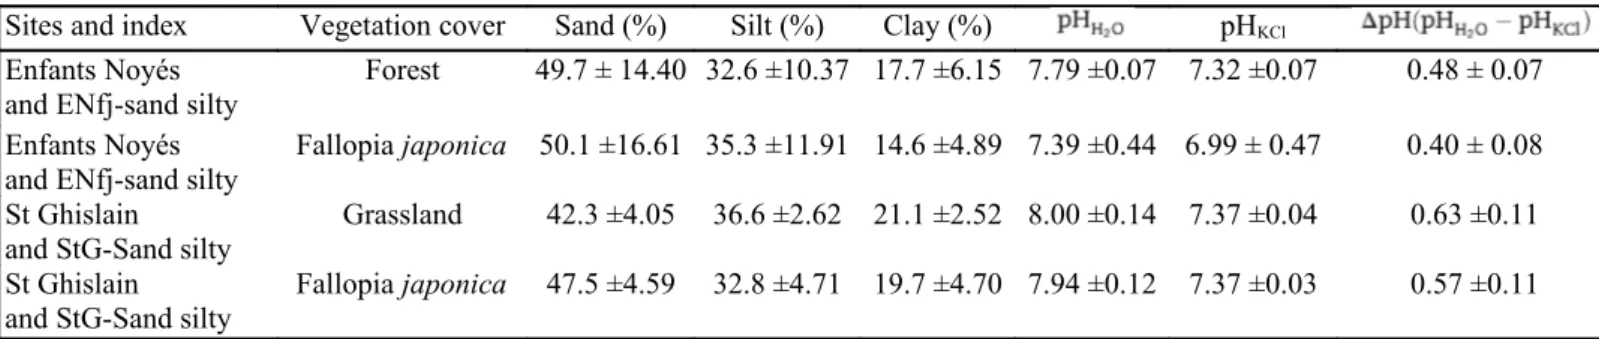
Table 4 - Soil texture, pH and vegetation cover of Enfants Noyés and St Ghislain (Fallopia japonka)
Sites and index Vegetation cover Sand (%) Silt (%) Clay (%) pHKCl
Enfants Noyés and ENfj-sand silty
Forest 49.7 ± 14.40 32.6 ±10.37 17.7 ±6.15 7.79 ±0.07 7.32 ±0.07 0.48 ± 0.07
Enfants Noyés
and ENfj-sand silty Fallopia japonica 50.1 ±16.61 35.3 ±11.91 14.6 ±4.89 7.39 ±0.44 6.99 ± 0.47 0.40 ± 0.08 St Ghislain
and StG-Sand silty Grassland 42.3 ±4.05 36.6 ±2.62 21.1 ±2.52 8.00 ±0.14 7.37 ±0.04 0.63 ±0.11
St Ghislain
and StG-Sand silty Fallopia japonica 47.5 ±4.59 32.8 ±4.71 19.7 ±4.70 7.94 ±0.12 7.37 ±0.03 0.57 ±0.11
Fig. 1 - Correlation between C respiration and the weight of fine POM (250-50 µm) after 1 and 2 weeks of
Acknowledgements
Authors thank Prof. J. Herbauts (ULB) for his comments and suggestions regarding the soil texture analyses. Thanks to Dr. Hugo Rainey (WCS, Project Lac Tele, Congo-Brazzaville) for reviewing the English. The research was supported by Brussels-Capital Government, "Research in Brussels".
REFERENCES
[1] D.W. Anderson, E.A. Paul, R.J. Arnaud, Extraction and characterization of humus with reference to clay-associated humus, Can. J. Soil Sci. 54 (1974) 317-323.
[2] C.A. Cambardella, E.T. Elliot, Particulate soil organic matter changes across a grassland cultivation sequence, Soil Sci. Soc. Am. J. 56 (1992) 777-783.
[3] C.C. Cerri, C. Feller, J. Balesdent, R. Victoria, A. Plenecassagne, Application du traçage isotopique naturel en 13C à l'étude de la dynamique de la matière organique dans les sols, C.R. Acad. Sci. Ser. II 9 (1985) 423^128.
[4] Th. Desjardins, F. Andreux, B. Volkoff, C.C. Cerri, Organic carbon and 13C contents in soils and soil size-fractions, and their changes due
to deforestation and pasture installation in eastern Amazonia, Geoderma 61 (1994) 103-118.
[5] T.A. Doane, O.C. Devêvre, W.R. Horwath, Short-term soil carbon dynamics of humic fraction in low input and organic cropping systems, Geoderma 144 (2003) 319-331.
[6] L.S. Koutika, F. Bartoli, F. Andreux, C.C. Cerri, G. Burtin, Th. Chone, R. Philippy, Organic matter dynamics and aggregation in soils under rain forest and pastures of increasing age in eastern Amazon Basin, Geoderma 76 (1997) 87-112.
[7] L.S. Koutika, F. Andreux, J. Hassink, Th. Chone, C.C. Cerri, Characterization of organic matter in topsoils under rain forest and pasture in the eastern Brazilian Amazon basin, Biol. Fertil. Soils 29 (1999) 309-313.
[8] L.S. Koutika, W.A.M. Didden, J.C.Y. Marinissen, Soil organic matter distribution as influenced by enchytraeid and earthworm activity, Biol. Fertil. Soils 33 (2001) 294-300.
[9] L.-S. Koutika, N. Sanginga, B. Vanlauwe, S. Weise, Chemical properties and soil organic matter assessment in fallow systems in the forest margins benchmark, Soil Biol. Biochem. 34 (2002) 757-765.
[10] L.-S. Koutika, S. Vanderhoeven, L. Chapuis-Lardy, N. Dassonville, P. Meerts, Assessment of changes in soil organic matter following invasion by exotic plant species, Biol. Fertil. Soils 44 (2007) 331-341.
[11] M. Schnitzer, Humic Substances: Chemistry and Reactions, in: M. Schnitzer, S.U. Khan (Eds.), Soil Organic Matter, Elsevier, Amsterdam, 1978.
[12] B. Vanlauwe, O.C. Nwokoe, N. Sanginga, R. Merckx, Evaluation of methods for measuring microbial biomass C and N and their relationship with soil organic matter particle size classes for soils from the West-African moist savanna zone, Soil Biol. Biochem. 31 (1999) 1071-1082.
[13] M. Wander, Soil Organic Matter Fractions and their Relevance to Soil Function, in: F. Magdoff, R. Weil (Eds.), Advances in Agroecology, CRC, 2004, pp. 67-102.