A real-time assessment of the ship design complexity
J-D. Capracea,1,∗, P. Rigoa
aANAST – University of Li`ege, Chemin des chevreuils, 1, 4000 Li`ege, Belgium
Abstract
The paper introduces an innovative complexity metric for passenger ships taking into account the shape complexity of steel parts, the assembly complexity and the material complexity. The goal is to provide the designer with such information throughout the design process so that an efficient design is obtained at the first design run. Real-time assessment of complexity and quality measurements is rather imperative to ensure efficient and effective optimality search, and to allow real-time adjustment of requirements during the design. Application and validation on a real passenger ship show that the new method is effective in giving a complementary aid to decision process for ship designers.
Keywords: Design complexity, Shipbuilding, Cost assessment, Design for X, Life cycle cost
1. Introduction
1.1. How to define complexity
. The description and understanding of the complexity
in the design stage remains an open problem in the ship-building industry. In contrast with the relative simplic-ity involved by few degrees of freedom, the behaviour of ships cannot be simply understood from knowledge about the behaviour of their individual parts.
. Despite many years of research in this field, it is very
hard to find a formal definition of a ”complex system” in the literature. Complexity is a term normally used to describe a characteristic, which is hard to define and even harder to quantify precisely.
. In general usage, complexity often tends to be used
to characterize something with many parts in intricate arrangements [1]. Actually, in science there are vari-ous approaches to characterizing complexity, as diverse as they are different. We can take into account : en-gineering, IT technology, management, economy, arith-metic, statistics, data mining, life simulation, psychol-ogy, philosophy, information, linguistics, etc. This is
∗
Principal corresponding author
Email addresses:[email protected] (J-D. Caprace), [email protected] (P. Rigo)
URL:http://www.anast.ulg.ac.be (J-D. Caprace), http://www.anast.ulg.ac.be (P. Rigo)
1Phone: +3243669621; Fax: +3243669133
just a small sample of the enormous diversity of con-siderations given to the concept of complexity. Many definitions tend to postulate or assume that complexity expresses a condition of numerous elements in a sys-tem and numerous forms of relationships among the el-ements. At the same time, what is complex and what is simple is relative and changes with time.
In a series of observations about complex systems and the architecture of complexity, [2] highlights some com-mon characteristics:
• Most complex systems contains a lot of redun-dancy
• A complex system consists of many parts
• There are many relationships/interactions among the parts
• The complex systems can often be described with a hierarchy; redundant components can be grouped together and considered as integrated units
. A hierarchy is a system that is composed of
interre-lated subsystems, each of the latter being, in turn, hier-archic in structure until we reach the lowest level of the elementary subsystem. In their dynamics, hierarchies have a property, near-decomposability, that greatly sim-plifies the description of a complex system, and makes it easier to understand how the information needed for the development or reproduction of the system can be stored in reasonable way.
. In the everyday use of the word ”complexity”, a part
A may be considered more complex than B, if A is more difficult to design and to manufacture than B. This sub-jective measure of complexity is however not sufficient for engineering analysis.
Complexity has captured the interest of engineers for many years, and a lot of various definitions are given in the literature [3]. Nowadays, more and more systems and technologies contain an overwhelming complexity. This issue requires methods to break them down into a more understandable way, hence the need to define and measure complexity.
Industry has already attempted to measure complex-ity using empirical measures. The problem is that this results in a proliferation of possible measures: typical examples include the number of items in the ship, anal-ysis of production sequence and assemblies, etc. Hav-ing so many metrics offers problems. How do you know you are using the most appropriate ones or that you have sufficient accuracy? How can you tell if complexity is bring reduced if one measure falls but another rises?
Various researchers have recognised the importance of objectively measuring complexity, as an aid to ad-dressing the cause of such engineering and management related problems [4, 5, 6]. Our first objective is to decide what complexity is. Then a model of how to measure it can be produced.
1.2. Different kind of complexities
. According to the literature, design complexity is
gen-erally divided into two topics: the shape or topology complexity and the assembly complexity.
Shape or topology complexity. In applications such as
Finite Element Modelling (FEM), the mesh generation is defined in terms of polygons which determine the polygonal face of the mesh. The notion of shape com-plexity is important to measure how oblong a polygon is in order to measure the mesh quality. Several algo-rithms for triangulation of the mesh have been used and, in some of them, shape complexity is a factor for deter-mining the resolution [7].
Kyprianou [8] pioneered feature recognition tech-niques for the purposes of classifying shape for auto-mated part coding. Since the feature recognition has been applied to many aspects of design, different mea-sures of complexity have been established depending on the precise application.
Various algorithms have been offered to assess the ge-ometric similarity of 3D models. Considerations such as the number of faces in a model, the number of sides of
a polygon, curvedness, symmetry, number of turns, de-gree of compactness, angular variability and crinkliness have all been used to quantify shape complexity [9, 10].
Assembly complexity. Although complexity research in
design has focused on component shape, some attempts have been made to quantify the complexity of an as-sembly. In defining measures to select a optimal assem-bly sequence from those that are geometrically feasi-ble, [11, 12] define sequence complexity in terms of the number of insertions, reorientations, total assembly op-erations and the depth of the product structure hierarchy. [13] and [14], and more recently [15] have introduced a complexity measure which, besides being quantifi-able, encodes the relevant properties of hierarchical sys-tems. This measure is related to the diversity or lack of self-similarity in hierarchical trees. In their present form, these metrics are more suited to the analysis of algorithm complexity.
1.3. Objectives of a ship design complexity metric . As the complexity of a ship increases, the Life
Cy-cle Costs (LCC) of the ship will typically increase as well. Also, a complex ship is commonly the result of a lengthy and complicated, and therefore, costly design process. Furthermore, because of the interconnection of various components and sub-assemblies in a complex ship, the engineering change process is often a complex and cumbersome task. Next, manufacturing of a com-plex ship entails adaptation of comcom-plex process plans and sophisticated the manufacturing tools and technolo-gies. Additionally, a complex ship results in a complex supply chain which introduces various managerial and logistic problems. Finally, serviceability in a complex ship is a challenging issue due as well to the existence of numerous failure modes with multiple effects having varying levels of predictability.
. Therefore, it is beneficial to objectively measure the
complexity of design ships in order to systematically reduce their inessential details. The main objective of this study is to define a quantitative measures of com-plexity that can be evaluated from a ship model at the early stage of the project design. This complexity mea-sure of a design should be able to guide the designer in creating a product with the most cost effective balance of manufacturing and assembly difficulty. The goal is to provide the designer with such information throughout the design process so that an efficient design is produced in the first instance.
. In terms of the manufacturing processes of ships,
as-sembly costs and quality of the end product, complex-ity plays a vital role in the achievement of the best de-sign. Unfortunately, little has been achieved in the area of complexity metrics that can be used in a useful way. One survey by [16] shows that from a series of stud-ies devoted to complexity, only 20% have attempted to produce some sort of quantification, thus considerable further research is required to make complexity a prac-tically useful concept.
. One outlook of this work is the development of the
means to quantify the complexity of a ship and the definition of measures to be used in conjunction with other metrics such as the assessment of production cost. Complexity is not defined in a quantifiable manner by the authors cited here, and thus considerable further re-search is required to make complexity a practical useful concept for shipbuilding industry.
2. Definition of a ship design complexity
. Designing is a heterogeneous, fuzzily defined,
float-ing field of various activities and chunks of ideas and knowledge. Therefore, design is a complex process [17]. This complexity stems from time varying de-sign requirements and the voluminous solution spaces to be explored. Detailed design requirements generally include requirements for design quality measurement. Systematic assessment of such qualities is a traditional bottleneck in design, in particular for the shipbuilding industry. Assessment of such qualities is imperative to evaluate the satisfaction of design requirements, which is an essential component in design optimisation. Satis-faction assessment guides the search for optimal design solutions. Real-time provision of complexity and qual-ity measurements are quite imperative to ensure efficient and effective optimality research, and to allow real-time adjustment of requirements during the design.
. Some decisions taken at the early design stages often
fail to deliver outputs that meet the expectation of cus-tomers [18]. These failings are attributed to a lack of understanding of complexity and can result in a num-ber of costly changes and even to a redesign. It has been suggested that to reach a better understanding of a project, its complexities should be measured so that new approaches can be developed to systematically re-ducing complexity [4].
. Complexity implies time, quality, cost, performance,
etc. Several factors that will influence product complex-ity have been identified such as the number of com-ponents, the number of interactions/connections, the number of assembly operations, the number of sub-assemblies, the number of branches in the hierarchy, the number of precedence levels in the hierarchy, the type of interactions/connections, the properties of inter-actions/connections, the type of components, geometry, shape, material, production process, size, density, ac-cessibility, weight, etc.
. In order to evaluate a product with respect to all these
design and production aspects it is important to consider complexity in many different ways. Indeed, when we try to reduce the complexity of a product by reducing the number of parts another issue can arise. As parts are integrated or eliminated to optimise assembly with re-spect to part count and assembly operations, inevitably more complex components are created and more com-plex insertion processes are required [19]. The overall assessment requires that the time and cost of production is minimised, but this obviously requires a compromise between manufacturing overheads, assembly processes and part count.
. We can therefore deduce the following statements
(see Fig. 1):
• A large number of simple components leads to a complex assembly and therefore a high cost • A small number of complex components also leads
to a complex assembly and once again high cost
Figure 1: Influence of component complexity and part count on cost [20]
Implicit in these assumptions is the fact that the higher the number of parts the more costly the assembly. But the reverse is also true, the higher the complexity of parts the more costly the assembly.
. Our research explores the relationships between these
complexity factors. The overall design complexity has been considered here as a combination of the shape
complexity, the assembly complexity and the material complexity:
• Shape, manufacturing complexity – Csh – Ability to perform the manufacturing of individual parts of the products. It is very common to say : ”The more there are components in a product the more simple are the individual parts”. The opposite is also avail-able : ”The less there are components in a product the more complex are the individual parts”. (see Fig. 1)
• Assembly, sequence, process complexity – Cas – Ability to easily assemble the components of a product. It is very common to say : ”The more there are components in a product the more the product is complex to assemble”.
• Material complexity – Cmt– Ability to use different types of material in a product. It is very common to say : ”The more there are materials in a product the more the product is complex”.
The following model is given in equation 1, where CT
represents the total complexity and w1, ..., wirepresents
numerical constants called weighting factors.
CT =w1Csh+ w2Cas+ w3Cmt
w1+ w2+ w3
(1)
2.1. Shape complexity – Csh
. The shape complexity, sometimes called shape factor
or compactness is a numerical quantity representing the degree to which a shape is compact. In this study we assume that the more a steel part has a complex shape (not compact) the more it is difficult to manufacture.
. In the literature various compactness measures are
used for 2D shapes and 3D solids [9, 10, 21, 22, 23]. These classical measurements of shape complexity for 3D solids relates in large part to the enclosing surface area and the volume while for 2D shape it relates in large part to the perimeter and the surface area.
. However, all these shape factors have the same
fol-lowing properties:
• They are dimensionless
• They are invariant under geometric transforma-tions such as: translation, rotation and scaling • They are applicable to all geometric shapes
. The most common shape complexity measurements
for 3D shapes is the sphericity ψ (see equation 2), de-fined by [24], is the ratio of the lateral surface of a sphere (with the same volume as the given solid) to the surface area of a 3D solid. This ratio is maximum (= 1) for a sphere and minimum (= 0) for a infinitely long and narrow shape.
ψ = As
A =
π1/3(6V)2/3
A (2)
where ψ is the sphericity,
A is the lateral surface of the solid,
As is the lateral surface of the sphere,
V is the volume of the solid.
. Finally, shape complexity Csh can be determined for
each individual steel component of the ship with equa-tion 3. The average shape complexity of a set of parts such as a ship assembly can be evaluated with equation 4. Csh= 1 − ψ (3) Csh= Pn i=1(1 − ψn) n (4)
where Csh is the shape complexity,
ψ is the sphericity or the circularity
ratio,
n is the number of part inside the as-sembly.
2.2. Assembly complexity – Cas
. Measuring the assembly complexity in a ship
struc-ture represents the measurement of the level of the di-versity and the interconnectedness of the parts. The more there is variability in the design parameters, the more complex the design becomes. A ship with modu-lar architecture, in which sub-systems have fewer func-tional interdependencies, should have lower coupling complexity than a ship with integral architecture. It should be noted that high performance is not necessar-ily a result of complexity. In other words, increased in-terdependence of various modules and assemblies in the ship is not necessarily translated into improved ship per-formance.
. The method used to establish a quantitative measure
of assembly complexity in this research is based on the definition of the complexity of hierarchical systems pro-vided by [14].
. We will consider a hierarchical assembly tree
struc-ture composed of N elementary elements at the lowest level, described by trees of constant depth M (see fig-ure 2(a)). For indistinguishable elementary elements, [13] prove that the only distinction between nodes in the tree is in the structure of sub-trees, which defines the di-versity of the global structure. Thus, we can conclude that the total diversity D(T ) of a hierarchical structure is given by the equation 5.
T
NT
MT
b
b b b
(a) Generic forest with sub-tree generated by node T T2 NT MT b b b b T T1 Tn bb b
(b) A blow-up section of the sub-tree T showing its own sub-trees
Figure 2: Hierarchical assembly structure
D(T ) = F(T ) k
Y
j=1
D(Tj) (5)
where D(Tj) denotes the diversity of the j
sub-trees in the forest,
k is the number of non-isomorphic sub-trees,
F(T ) is the form factor of the root T
of the forest.
. The recursive nature of this definition is well suited
to a hierarchical assembly tree structure, in which each sub-tree represents a particular stage in the global as-sembling of the product. The form factor F(T ), is a function of the number kT of non-isomorphic elements,
T 1, T 2, T 3, ... Tkin which T diversifies. As shown by
[13], this can be seen from the fact that the total num-ber of interactions ITamong the distinct elements of the
tree that take place through the node T is simply related to kT by the equation 6.
IT = (2kT(m)−1) (6)
where kT(m) depends on the number of the
lower levels that we consider in order to decide whether or not two sub-trees are isomorphic.
. Besides this dependence on kT, the form factor should
also contain some information on the relative impor-tance of the T clustering level contribution to the global diversity. In other words, a node which subtends a fat tree should have a larger contribution to the total tree complexity than one at the same height but with only infertile branches.
Based on these definitions, [14] proposes a formu-lation in order to assess the complexity of hierarchical systems. He defines a complexity measure of hierarchi-cal tree structures as described in equation 7.
C(T ) = log2D(T ) (7)
. Thus the complexity of a forest composed of n
non-isomorphic trees is given by equation 8.
C n [ i=1 Ti = n X i=1 C(Ti) + log2F n [ i=1 Ti (8)
. This equation with the prescription of how to compute
the form factor F(T ) (see equation 6) provides a way of calculating the complexity of a hierarchical assembly tree structure. In order to make it reflect the relative im-portance of each node in the structure, as measured by the number of final leaves it subtends, we may choose the last term of equation 8 to be given by equation 9.
log2F n [ i=1 Ti = NTlog2(2 kT(m)−1) (9)
. Thus the fat trees and their clustering will be the
ma-jor contributors to the overall complexity of the system. Finally, equation 8 can be written in the form of equa-tion 10. We will consider that m = 1 for simplicity. It means that we will only explore the root node of the T sub-trees in order to check their isomorphism.
Cas= C n [ i=1 Ti = n X i=1 C(Ti) + NTlog2(2 kT −1) (10)
where Cas= C
hSn
i=1Ti
i
is the assembly com-plexity of a forest composed of n non-isomorphic trees, Pn
i=1C(Ti) is the complexity
of the n
non-isomorphic
sub-trees,
NT is the number of
el-ements at the lower level of the tree,
kT is the number of
branches
non-isomorphic.
2.3. Material complexity – Cmt
. Considering the stiffened structure of ships, the
ma-terial complexity has been defined for an assembly by equation 11.
• For the plates Cpt – the material complexity is the number of the different combinations between plate thickness and material type. For instance an assembly containing 10 steel plates of 20 mm, 5 aluminium plates of 20 mm and 3 steel plates of 15 mm, the complexity will be equal to 3.
• For the stiffeners Cst – the material complexity is the number of the different combinations between profile types, profile scantling and material types. For instance for an assembly containing 35 steel bulb profiles of 100×6 mm, 10 steel bulb profiles of 100×8 mm and 5 aluminium steel bulb profiles of 100×8 mm, the complexity will be equal to 3.
Cmt= Cpt+ Cst (11)
3. Application
. To investigate the relative complexities of the
struc-tural parts of a ship (i.e. steel structure), ten different passenger ships built in European shipyards were se-lected for the purpose of the experiment. The average number of individual steel components is about 200 000 per ship. The study has focused on the complexity anal-ysis of the 3500 structural sections (small blocks), each one containing about 500 individual steel components. The complexity value was determined by the equation 1 which takes into account the 3 complexity compo-nents detailed above : the shape complexity, the
as-sembly complexity and the material complexity.
Cur-rently, these measures are calculated automatically but
not yet in real time. Nevertheless an automated system can be developed to compute the complexities using a machine-interpretable model in the CAD/CAM model.
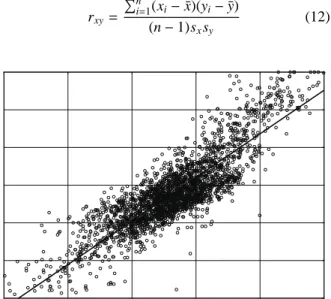
. The weighting factors of equation 1 have been
eval-uated through a minimization of the linear correlation coefficient r2
xybetween the total complexity and the
pro-duction work of ship sections (see equation 12). A sim-ple gradient descent optimisation algorithm was used here. The r2 linear coefficient went from 0.7102 to
0.7557 which represents a gain of 6%. Fig. 3 represents the dot clouds diagram of the optimized linear corre-lation between the total complexity and the production time.
rxy=
Pn
i=1(xi−¯x)(yi−¯y)
(n − 1)sxsy (12)
Figure 3: Diagram of the total complexity versus the production time (r2= 0.7557)
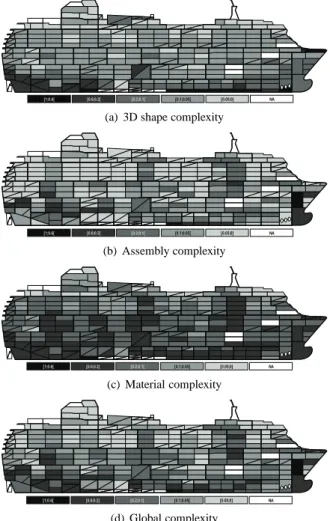
. The main outcome of the test case is presented in
Fig. 4 where we can see the relative complexities of each ship section i.e. the shape complexity, the assem-bly complexity, the material complexity as well as the global complexity evaluated thanks to equation 1. By analysing the figures, it is interesting to note that the high complexity is generally located in the bottom part of the ship as well as in the fore and aft part whereas the ship hull has a big curvature. Nevertheless, other areas of the ship don’t have uniform complexity. Some sec-tions are much more complex than others. We can men-tion here for instance that the complexity of the three access tower for passenger with lifts and stairs appear very well in Fig. 4(b).
. An upper and a lower complexity limit for each type
of section can be defined by the managers to control the design. Moreover the composition of the complex-ity index with the three factors i.e. shape complexcomplex-ity, the assembly complexity and the material complexity, can direct the designer to revise the appropriate design variables in order to reduce the global complexity of the ship during the design phase.
By arranging the structural details of a ship in a way that enhances the modularity of steel components, stan-dardising the scantling and simplifying the shape of the components, it is possible to eliminate unneces-sary weldings, lengths of piping, ventilation ducting, and many other sources of production and maintenance cost. All of these efforts will result in a reduction of man-hours, material cost and construction time, result-ing in a reduction in recurrresult-ing construction costs.
Expe-[1;0.6[ [0.6;0.2[ [0.2;0.1[ [0.1;0.05[ [0.05;0] NA
(a) 3D shape complexity
[1;0.6[ [0.6;0.2[ [0.2;0.1[ [0.1;0.05[ [0.05;0] NA (b) Assembly complexity [1;0.6[ [0.6;0.2[ [0.2;0.1[ [0.1;0.05[ [0.05;0] NA (c) Material complexity [1;0.6[ [0.6;0.2[ [0.2;0.1[ [0.1;0.05[ [0.05;0] NA (d) Global complexity
Figure 4: Complexity of a cruise ship
rience has shown [25] that structural detailed arrange-ments that were made during the early stages of design were often carried through detail design without any at-tempt at optimisation.
. The system deals with the geometric details of the
de-sign and highlights the relative complexities of ship sec-tions. It quickly provides measurements of complexity but not yet in real-time. Therefore it is particularly suit-able in design, where fast response to design modifica-tions is quite imperative for the search of optimality.
4. Conclusions
. Complexity can be seen as a critical problem in
de-sign that is needed to be reduced as much as possi-ble. For example, complexity is associated with the difficulty of solving design problems, the combinatorial size of the search space, and the variety of the gener-ated designs. Notably, the complexity of solving design problems occurs not only because these problems are often intractable, ill-defined or ill-understood, but also because they involve many different participants, with many different goals and needs.
. In order to solve these problem, different kinds of
ship design complexity were investigated and a com-plexity metrics based on shape, assembly and material complexity were put forwards. To validate the proposed measures, the production efforts of a set of passenger ship sections were compared to the complexity value. A significant correlation was obtained that means that the relation between complexity and design was success-fully implemented.
. The complexity measurement is an imperative basis
for systematic optimality search, which is the essential process in design. The definition and the control of the upper limit of this metric will provide a good manage-ment tool to improve the overall design performance of ships.
. We are well aware of the risk of creating a model that
is mathematically viable but may not reflect reality be-cause of the quantity of assumptions made during the design process. The idea, nevertheless, is to define a model to make the complexity more approachable and, perhaps, even practical. Nobody has ever succeeded in giving a definition of the complexity which is meaning-ful enough to enable one to measure exactly how com-plex a system is. Ships cannot and should not be re-duced to one single complexity measure. A ship is not
only the end result but is also an entire system of manu-facturing, transport and economic evolution. Complex-ity should be seen as a decision tool aid.
5. Acknowledgements
. The authors thank University of Liege and experts of
some European shipyards for the collaboration in this project as well as the Belgian National Funds of Scien-tific Research (NFSR) for the financial support.
6. References
[1] H. A. Simon, The Architecture of Complexity, in: Proceeding of the American Philosophical Society, Vol. 106, 1962, pp. 467– 482.
[2] H. Simon, The Sciences of the Artificial, Mass.: MIT Press, Cambridge, 1996.
[3] C. RodriguezToro, S. Tate, G. Jared, K. Swift, Complexity met-rics for design, IMechE’03 217.
[4] G. Chryssolouris, Measuring complexity in manufacturing sys-tems, Tech. rep., University of Patras 26110 Greece, working paper Department of Mechanical Engineering and Aeronautics (1994).
[5] G. Little, D. Tuttle, D. E. R. Clark, J. A. Corney, Feature com-plexity index, Proceedings of Institution of Mechanical Engi-neers 212 (1997) 405–412, proceedings of Institution of Me-chanical Engineers.
[6] A. Calinescu, J. Efstathiou, S. Sivadasan, J. Schirn, H. L. Huaccho, Complexity in Manufacturing: An Information The-oretic Approach, Conference on Complexity and Complex Sys-tems in Industry (2000) 19–20University of Warwick, UK. [7] B. Chazelle, J. Incerpi, Triangulation and shape complexity,
ACM Trans. Graphics 3 (2) (1984) 135–152.
[8] L. K. Kyprianou, Shape classification in computer-aided design, Ph.D. thesis, University of Cambridge, p. 186 (1980). [9] E. Bribiesca, A Measure of Compactness for 3D Shapes,
Com-puters and Mathematics with Applications 40 (November 2000) 1275–1284(10).
[10] E. Bribiesca, An Easy Measure of Compactness for 2D and 3D Shapes, Pattern Recogn. 41 (2) (2008) 543–554. doi:http://dx.doi.org/10.1016/j.patcog.2007.06.029.
[11] C. J. Barnes, G. E. M. Jared, K. G. Swift, Decision support for sequence generation in an assembly oriented design envi-ronment, Robotics and Computer-Integrated Manufacturing 20 (2004) 289–300.
[12] S. J. Hu, X. Zhu, H. Wang, Y. Koren, Product Variety and Manu-facturing Complexity in Assembly Systems and Supply Chains, CIRP Annals - Manufacturing Technology 57 (2008) 45–48. [13] B. A. Huberman, T. Hogg, Complexity and Adaptation, Physica
D 2 (376) (1986) 376 – 384.
[14] H. A. Ceccatto, The Complexity of Hierarchical Systems, Phys-ica Scripta 37 (1988) 145–150.
[15] G. S. Hornby, Modularity, reuse, and hierarchy: Measuring complexity by measuring structure and organization, Complex-ity 13 (2) (2007) 50–61.
[16] V.Tang, V.Salminen, Towards a Theory of Complicatedness: Framework for Complex Systems Analysis and Design, 13th In-ternational Conference on Engineering Design (2001) 8. [17] W. Jonas, J. Meyer-Veden, Mind the Gap! on Knowing and Not
Knowing in Design, Hauschild-VerlagBremen.
[18] S. Austin, A. Newton, J. Steele, P. Waskett, Modelling and aging Project Complexity, International Journal of Project Man-agement 20 (3) (2002) 191–198.
[19] M. Sealy, S. Corns, Lucas Design for Assembly method applied at Hawker SiddeleySwitchgear, IEE Seminar on Team Based Techniques Design to Manufacture (1992) 7.
[20] C. RodriguezToro, S. Tate, G. Jared, K. Swift, Shaping the Com-plexity of a Design, IMECE2002 (2002) 8.
[21] R. M. Haralick, L. G. Shapiro, Glossary of Computer Vision Terms, Pattern Recogn. 24 (1) (1991) 69–93.
[22] Y. Youssry, Quantification and Characterization of the Motion and Shape of a Moving Cell, Ph.D. thesis, McGill University, Montreal (1982).
[23] J. Valentan, T. Brajlih, I. Drstvensek, J. Balic, Basic Solu-tions on Shape Complexity Evaluation of STL Data, Journal of Achievements in Materials and Manufacturing Engineering 26. [24] W. Hakon, Volume, Shape and Roundness of Quartz Particles,
Journal of Geology 43 (1935) 250–280.
[25] N. S. R. Program, Development of Producibility Evaluation Cri-teria, Tech. rep., Wilkins Enterprise Inc. (December 1993).
![Figure 1: Influence of component complexity and part count on cost [20]](https://thumb-eu.123doks.com/thumbv2/123doknet/6547206.176471/3.892.466.795.774.957/figure-influence-component-complexity-count-cost.webp)