C.Le Goff,(1) N.Fabregat-Cabello (1), L.Huyghebaert (1), S.Peeters(1), L.Vroonen (2), E.Cavalier(1) Department of Clinical Chemistry, University of Liège, CHU Sart-Tilman, B-4000 Liège, Belgium.
Department of endocrinology, University of Liège, CHU Sart-Tilman, B-4000 Liège, Belgium. Email: [email protected]
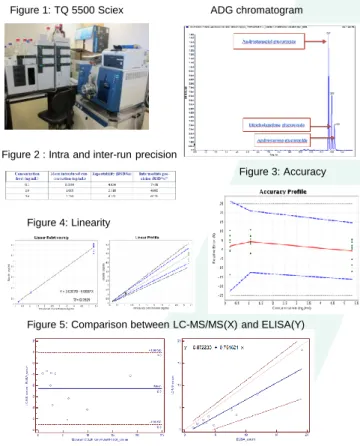
Figure 1: TQ 5500 Sciex
Quantification of serum androstanediol glucuronide
by LC-MS/MS
Background:
Plasma androstanediol-glucuronide (ADG) is considered to be a highly marker of peripheral androgenicity. The quantification of steroidal glucuronide conjugates by indirect methods of immunoassays may underestimate some conjugates since hydrolysis is needed in sample processing. To overcome these limitations, we have validated a LC-MS/MS method (because of its high sensitivity, specificity, and an excellent reproducibility) for ADG determination in plasma and serum and to compare it with our previously employed ELISA.
Materials and Methods:
We used a HPLC system AD20XR Shimazu connected to triple quadrupole mass spectrometer TQ5500 (SCIEX, Framingham, Massachusetts, USA) (Fig 1).
3 water and serum samples depleted in steroids were spiked with a known concentration (0.2, 1 and 5 ng/mL) of ADG; these samples were run in triplicate on 3 different days to evaluate within and between-run CV. With those samples, we evaluated also recovery and matrix effects.
Linearity of the calibration curves(0.1, 0.5, 1, 5, 10 ng/mL) for serum was assessed by performing linear regression.
The limit of detection (LOD) and limit of quantification (LOQ) were calculated with the lowest concentration that we tested. LOD and LOQ were respectively defined as 3:1 and 10:1 signal/noise ratio respectively. The e-noval software (Arlenda, Belgium) was used to perform the statistical calculations.
Results:
The detection mode was MRM in negative mode. For ADG, the transitions were: 486.35/257.2 (quantifier) and 486.35/275,2 (qualifier). For the d3-ADG, the transitions were: 489.4/260.2 (quantifier) and 489.4/278.2 (qualifier). The intra-run precision (CV) was 2.5-6.3% and between-run precision (CV) was 4.7-7.4% (Fig.2-3). Recoveries were: into natural matrix (95%CI: 94.3-107.5) and water (95%CI: 101.2-111).
Within the calibration ranges, the linear regression model is fitted ,the equation was: Y=0.03078+0.9867X. The LOD was 0.018 (+/-0.002) µg/L (n = 5) and the LOQ at 0.059(+/-0.006) µg/L (n = 5) ( Fig 4).
For the comparison between LC-MS/MS(X) and ELISA(Y), the Passing-Bablok test gave the following regression equation: Y=1.14+1.31X (Fig 5).
The average median was 2.57 µg/L (95% CI: 1.18-6.3) for LC-MS/MS and 4.33 µg/L (95% CI: 2.53-10.3) for ELISA (Fig 6).
Between the serum(X) and plasma(Y) in LC-MS/MS, the regression equation was: Y=0.09+0.92X, the median average was 2.57 µg/L (95% CI: 1.18-6.3 in serum compared with a average median of 2.46 µg/L (95%CI:1.21-6.3)) in plasma.
Conclusions:
We have validated the method by LC-MS/MS. We noted a significant bias between ELISA and LC-MS/MS. Finally, we urge the Clinical Chemistry community to develop an international standard reference material for steroids and a candidate reference method for LC-MS/MS.
ADG chromatogram
Figure 2 : Intra and inter-run precision
Figure 3: Accuracy
Figure 4: Linearity
Figure 5: Comparison between LC-MS/MS(X) and ELISA(Y)
Figure 6: Comparison between serum(X) and plasma(Y) in LC-MS/MS T134