Université de Montréal
Blue flicker modifies the subfoveal clioroidal blood ftow
in the human eye
par
Marcelo Alejandro Wajszilber
Ecole d’Optometrie Universite de Montreal
Thèse présentée à la Faculté des études supérieures en vue de l’obtention du grade de Maîtrise (M.Sc.)
en sciences de la vision
option sciences fondamentales et appliquées
August 2007
(uEc/o/5
u2
:<fld•
Direction des bibliothèques
AVIS
L’auteur a autorisé l’Université de Montréal à reproduire et diffuser, en totalité ou en partie, par quelque moyen que ce soit et sur quelque support que ce soit, et exclusivement à des fins non lucratives d’enseignement et de recherche, des copies de ce mémoire ou de cette thèse.
L’auteur et les coauteurs le cas échéant conservent la propriété du droit d’auteur et des droits moraux qui protégent ce document. Ni la thèse ou le mémoire, ni des extraits substantiels de ce document, ne doivent être imprimés ou autrement reproduits sans l’autorisation de l’auteur.
Afin de se conformer à la Loi canadienne sur la protection des
renseignements personnels, quelques formulaires secondaires, coordonnées
ou signatures intégrées au texte ont pu être enlevés de ce document. Bien
que cela ait pu affecter la pagination, il n’y a aucun contenu manquant.
NOTICE
The author of this thesis or dissertation has granted a nonexclusive license allowing Université de Montréat to reproduce and publish the document, in part or in whole, and in any format, solely for noncommercial educational and research purposes.
The author and co-authors if applicable retain copyright ownership and moral
rights in this document. Neither the whole thesis or dissertation, nor
substantial extracts from it, may be printed or otherwise reproduced without the author’s permission.
In compliance with the Canadian Privacy Act some supporting forms, contact information or signatures may have been removed from the document. While this may affect the document page count, it does flot represent any loss 0f
Cette thèse intitulée
Blue flicker modifies the subfoveal choroidal blood flow
in the human eye
présentée par: Marcelo Wajszilber
a été évaluée par un jury composé des personnes suivantes
Prof. Dr.John Lovasik OD,PhD, Directeur de recherche
Prof .Dr.Helene Kergoat OD,PhD, Membre du jury
Prof. Dr Etty Bitton OD,MSc, Membre du jury
Résumé
L’objectif de cette étude était de démontrer le lien entre le débit sanguin choroïdien (ChBF) et l’activité des photorécepteurs induite par la lumière. Dans le passé, cet effet a déjà été démontré pour la circulation rétinienne mais a été réftité pour la circulation choroïdienne. Dix sujets en bonne santé ont participé à cette étude.
Le débit sanguin a été mesuré à l’aide d’un laser Doppler infrarouge pendant la stimulation avec une lumière bleue clignotante. Les photorécepteurs rétiniens ont été stimulés par 24 fréquences de clignotement comprises entre 1 et 64Hz. Pour chaque fréquence, nous avons augmenté l’intensité lumineuse de 1 unité logarithmique à 4 unités logarithmique. Ensuite, nous avons diminué l’intensité de 1 unité logarithmique par
étape pour retournerau point de départ, c’est-à-dire de 375 cd/m à O,00375cd/m. En
même temps, nous avons mesuré l’activité électrique rétinienne avec
l’électrorétinograrnme par flash (ERG’s) pour déterminer le degré d’activité des cônes bleus (S) et des bâtonnets avec la stimulation bleue. Les mesures du ChBF normalisées et moyennées par groupe nous ont révélé une variation de 9% liée à la fréquence du
clignotement. L’augmnentation d’intensité lumineuse a atténué le ChBF subfovéal de 32%, —3O% et ‘-5% respectivement pour la vitesse, le volume et le débit. Par contre, la diminution progressive de l’intensité n’a pas démontré le même effet
En général, les données nous indiquent que l’activité générée par les photorécepteurs est associée àun changement de la distribution du ChBF dans le fond d’oeil selon le degré et le type de stimulation des photorécepteurs.
Mots clés t Electroretinogramme par flash bleu, débit sanguin choroïdien, hémodynarnique choroïdienne, clignotement, mesure du débit par laser Doppler, activité neuronale rétinienne.
Abstract
The objective of the present study vas to reveal an interaction between choroidal blood flow (ChBF) and Iight-induced photoreceptor activity, a physiological coupling that is already dernonstrated for retinal blood flow, but rejected for the ChBF. Ten healthy aduits volunteered for this study. A real-time recording near infrared Jaser Doppler ftowmeter was used to quantify the subfoveal ChBF while the luminance ofblue flicker
between 1Hz and 64Hz was first increased, then decreased by 4.0 log units in 1.0 log unit steps between 0.0375 cd/rn and 375 cd/m . In separate testing, flash electroretinograms
(ERGs) provided electrophysiological indices of the relative response of shoiiwave cones and rods to blue light stimulation. Group-averaged, normalized ChBF measurements revealed that it was rnodulated by 9% by flicker frequency. Increasing the blue flicker luminance from low-to-high attenuated the subfoveal choroidal ftow, volume (ChBVol), and velocity (ChBVeI) by 32%, 30%, and 5% respectively. Decreasing the luminance from high-to-low over the sarne range had no effect on the subfoveal choroidal hemodynamics. The markedly different effects of reversed directions of change in blue flicker luminance on the subfoveal ChBF were linked to transitions between rod dominated and shortwave cone-dominated retinal responses. Collectively, these findings indicate that blue light-induced photoreceptor response is associated with a differential
distribution of the ChBF across the ocular fundus according to the degree and type of retinal photoreceptor stimulated.
Keywords Keywords: blue-flash electroretinogram, choroidal blood flow, choroidal
Table des matières
Resurne iii
Summary y
List ofabbreviations viii
List of figures ix
Introduction 1
1 .1 Anatomy of the Retina and Photoreceptors 3
1.2 Choroidal Anatorny and Physiology 15
Choroidal blood flow physiology 24
2.0 Project description 27
2.1 Description ofthe instrument 29
3.0 Materials and rnethods 37
4.0 Results 37 5.0 Articles body 38 6.0 Conclusion 39 6.1 Clinical implications 41 Bibliography 43 Annexe
List of abbreviations
À
AngstrornANSI American National Standard For Safe Use of Lasers
ARMD Age Related Macular Degeneration
CCD Charged Coupled Device
Cd/m2 Candela per Meter Squared
CFF Critical Flicker Fusion
ChBF Choroidal blood flow
DSPS Doppler Shifted Power Spectrum
ERG Electroretinogram
FFT Fast Fourier Transform
Hz Hertz
Khz Kilohertz
LED Light EmmittingDiode
NIR Near Infrared
nrn Nanorneter
RBC Red Blood Celis
TTL Transistor-Transistor Logic
V Volt
Micron Microfarad
List of figures
Figure # 1 Rods and cones distribution by density in the retinal tissue 4 Figure # 2 Relative absorbance ofphotopigrnents found in rod and cone
photoreceptors 5
Figure # 3 Topographie distribution ofcones and rods across the retina 6 Figure # 4 Waveforrn of a flash-induced Electroretinogram 9 Figure # 5 Intraretinal celi architecture showing connections between cones,rods
bipolar and ganglion celis 10
Figure # 6 Changes in the dark adapted ERG as a ftinction of flash
luminance 12
Figure # 7 Log Spectral sensitivity ofrod and cone photoreceptors 14 Figure # 8 Retinal view ofchoriocapillaris at different sites 16
Figure # 9 Choroidal Complex 1$
Figure # 10 Anatomical layout ofthe lobular sub-units in the choriocapillaris. ..19
Figure # 11 Retinal view ofchoriocapillaris 20
Figure # 12 Vascular perfussion ofthe eye 22
Figure # 13 Electron rnicroscopy ofchoroidal and retinal vessel casting 24
Figure # 14 Diagram of laminar flow 27
Figure # 15 Doppler pararneters 3 1
Figure # 16 Doppler shift power spectnim 32
Figure # 17 Schematic diagram of the laser Doppler flowmeter with the flicker
generator 34
Dedication
I would like to dedicate this work to my wife Debora who supported me with trust and ecouraged me tbroughout rny life as a source of inspiration .Also to rny chiidren Dafna, Eliel and Abigail who gave methe determination for the important changes in my life. Finally, to bothmyparents, Enrique and Ana who supported my education with loving care and inspiration.
Remerciements
I would like to express rny gratitude to Dr. John Lovasik, for being an outstanding advisor and excellent professor. His constant encouragement, support, and invaluable suggestions
made this work successful. His constant dedication to my learning process and love to research encouraged me to enjoy eye research. He has been everything that one could find in a director: knowledge, guidance and friendship.
My sincere thanks go to Dr. Helene Kergoat for lier patience and dedication during my
training and and also for reviewingmy writings.
I also thank Dr. Etty Bitton for having read my research report and provided many important suggestions for improving the accuracy and quality of the thesis presentation.
Introduction
The hurnan eye includes an optical system that parallels a photographic camera. Basicafly, the focusing system is comprised of the comea and the crystalline lens whule the retina serves as the light sensitive interface comprising the light sensitive rod and cone photoreceptors. Retinal light stimulation induces a change in the molecular structure of the photo-labile pigments within the photoreceptors, initiating electrical impulses that travel through the various layers of the retina, along the optic nerve and up to the visual cortex where they are further processed, ultimately leading to visual perception.
The human retina lias a very high metabolic rate and as such requires adequate vascular perfusion to sustain optimal neural retinal function. Blood supply to the retina is derived from a dual vascular bed consisting of the choroid, perfusing the outer third of the retina and the central retinal artery circulation perfiising the inner two thirds of the retina. The choroid is one of the most perftised tissues in the hurnan body. The choroidal vasculature represents about 85% of the total volume of blood perfusing the retina, however, the outer retina extracts only a small percentage (-2-3%) of the oxygen available from the choroid. The reason for this low oxygen extraction from the choroidal blood flow is flot fully elucidated. It lias long been hypothesized that this high blood flow level served as a cooling system to prevent the photoreceptors from overheating during light stimulation. However, more recent studies have shown that the retina needed all of the oxygen provided by the choroid to satisfy its metabolic requirements. (15)
Vascular autoregulation has been defined as the ability of a living tissue to maintain a relatively constant blood flow despite changes in the vascular perfusion pressure. (Roy and Sherrington (27)• From their early experiments on cerebral blood flow regulation, these authors noted that different metabolic products were able to modify the calibre of arterioles and hence blood flow. They proposed that vascular autoregulation was the result of both metabolic and rnyogenic mechanisms.
It lias long been known from studies in animals and hurnans, that the central retinal artery circulation possesses the capacity to regulate its blood flow during altered vascular
perfusion pressure or metabolic stress7. On the other hand, studies have shown that the choroidal circulation did not have the capacity to regulate its blood flow. More recently, however, studies in animals’4 (13) ,Jeff Kiel et al in studies in pigeons and in humans, Lovasik et al 2003 ‘andRiva et aI 1997(25) have demonstrated the capacity ofthe choroid to regulate its Nood flow over a certain range of altered perfusion pressure. Up to now, however, it was believed that blood flow in the choroid was independent of changes in retinal metabolisrn caused by retinal light stimu1ation7’62122’14’28
The present study was therefore undertaken to evaluate the relationship between choroidal blood flow and retinal rnetabolism. The principal objective was to deterniine if and how blood fiow is regulated in the normal heafthy hurnan choroid in the presence of retinal light stimulation.
1.1
ANATOMY 0F THE RETINA
Retina and Pliotoreceptors
PhotoreceptorsThe retina is a thin three dimensional complex of neurons and guai tissue lining the inner part of the eyeball. It is considered to be part of the brain because during embryonic development it forms as a projection of the forebrain. Within the retina are included the sensory neurons (rod and cone photoreceptors) that respond to light and are connected inan organized fashion to other retinal neurons to forrn a specialized neural circuit that initiates the first steps of vision at the retinal level.
Histologically, the retina has three principal ceils, the photoreceptors, bipolar celis, and the ganglion celis. The photoreceptors are found in the outermost layer of the retina such that light must pass through ail retinal layers to initiate photo-transduction. Once light has caused a change in the isornerization of photopigments in the photoreceptors, minute electrical signais are transmitted through the retina by the bipolar and ganglion cells and ultirnately reach the visual cortex to initiate visual perception’8
In mammalian evolution, retinas have at least two types of photoreceptors: rods and cones. Typically primates and humans have a “duplex retina” allowing good visual discrimination over a wide range of lighting conditions. The number of rods in the retina exceeds those of cones by a ratio of about 20:1. The rod free area in the retina known as the fovea corresponds to about 1 degree of visual angle. The absolute number of photoreceptors in the hurnan retina is approxirnately 120x106 rods and about 6x10⁶ cones.t12
But The region in the center of the retina is called the fovea and contains only cones very densely packed. The cone density rapidly declines with eccentricity from the fovea. The rods begin to appear about I degree from the center and their density increases to a maximum at about 17-20 degrees eccentric to the fovea, and thereafter decreased in density towards the far periphery as shown in figure I below.
Figure # 19 Rods and cones distribution by density in the retinal tissue
cone peak
‘
H
?0 I
o
Rod and cone distribution in human retina. Density scale is i03 photoreceptors per mm2. Note the absence of photoreceptors in the optic disk.
Rods are highly light sensitive photoreceptors and their principal function is light perception under dim-dark conditions. Rods house a visual pigment called rhodopsin that undergoes photo-isomerization when is activated by a photon of light. The peak spectral sensitivity of rhodopsin is in the region of about 49$ nm5
rod peal conesj 70605040 QJ0 O 10 03)O5Oé070 8090 1rM tovea ECCENTRICFFY n degrees Osterberg,7935
Figure # 20 Relative absorbance of photopigments found in rod and cone photoreceptors
Conversely, cones contain opsins as visual pigments and due to the differences in the molecule of the visual pigment, they are more sensitive to either long wavelengths (red light) with maximal sensitivity at 564 nm, medium wavelengths (green light) with peak sensitivity at 533 nm and short wavelengths (blue light) with peak sensitivity at 437 nm.
Such long, mcdium and short-wave cones (L-cone, M-cone and S-cone, respectively) have been found in higher primates as well as in human retinas.
Morphologically, L,M and S-cones differ from each other; S-cones have longer inner segments that go deeply into the inner retinal space.
Caption: Normalized view ofrods and cones spectral sensitivities for different light wavelengths.(from Webvision by Dowling,1987).
Moreover, the number and distribution of cones across the retina is flot uniform. L-cones represent 33% of the population while M- cones peak in the fovea at 64% and may vary from 52 to 5% elsewhere in the retina. (t2)•
The S-cones have their lowest density in the fovea] pit representing only 3 % of the cone population to reach a 15 % peak some I degree from the foveola (from Latin:central portion of the central retina that contains cones only.) and 8% of the total population elsewhere in the retina.
The rnost interesting point is that the signal derived from S-cones are processed differently in the retinal circuitry from L and M cones, probably, because the blue system is older in phylogenetic evolution.
Figure # 3 Topographic distribution of cones and rods across the retina
A
A Rads
B= L andMcon c=S-canes
Caption for Fig 3 The rod distribution across the fundus is shown in green. The distribution of medium and long wavelength sensitive cones is shown in orange. The distribution of blue sensitive cones is shown in bi ue.
Rods are very sensitive to light in darkness and dim light conditions and they can actually detect one quanta oflight under certain viewing conditions. Unlike cones, rods are much siower to respond to light stimulation and electrical signais generated in photopic conditions. may arrive 1/10 of a second later than those originating from cones.17 Therefore, the rod retinal circuitry with its convergent intermediary neurons is specifically designed to collect and amplify srnall light quanta for twihght and night vision.’8
The intraocular portion of the optic nerve, referred to as the optic disk is the region where axons of ganglion cells connected with photoreceptors, exit the spherically shaped eye to connect with higher levels of visual processing in the brain As the optic disk is devoid ofphotoreceptors, any image projected onto this area cannot be seen, and hence is named ‘Tthe biind spot”.’2
Figure 1 shows that the photoreceptors are syrnmetrically distributed about the fovea except at the blind spot where there is a complete absence of light sensitive neurons.
In the centre ofthe fovea, where cones are packed most denseiy, the neural synapses are displaced to the side giving more direct light stimulation of the photoreceptors. This distribution gives rise to a central depression called the “fovea” (Latin= small pit
).
In the peripheral retina, several rods are capable of synapsing to one ganglion celi, hence, it determines a converging system being able to collect more light under low luminance ievels regardless of visual discrimination
In contrast, the number of ganglion ceils corresponding to the foveal region is about equal to the number of cones in a ratio of 1: 1. Although it is considered that every cone bas
a direct connection to only one bipolar-ganglion ceil, each ganglion ceil is nonetheless
affected by the actions of a greater number of cones and each cone may influence the activity of several ganglion celis because of lateral connectivity through other retinal neurons typically at the outer and inner plexiform layers •(1
Electrical response ofthe retina to diffuse light flashes
The global electrical response of the retina to a diffuse flash of light is referred to as the electroretinogram (ERG). This signal is typically recorded at the corneal level that results from extracellular currents generated by the retinal neurons in response to light activation of the photoreceptors.
Clinically the most important components ofthe ERG include an electro-negative a
wave and an electro-positive b-wave. The a-wave results from the hyper-polarization ofthe
photoreceptor membrane after light induce isornerization of the visual pigment which subsequently gives rise to a potential change in the photoreceptors. This process occurs in the outer segment of the photoreceptors.
Figure # 4 Waveform of a flash-induced Electroretinogram.
— AnpIite r nDtt — nphi h iIILccnd
bwa’e(+)
Caption: Typical fomis of ERG showing implicit time and amplitude for both a and b waves.
The interaction between different cel]ular types in the primate retina, determines the existence of an eccentrically organized circular receptive fields with center ON and periphery OFF (and vice versa) synapsed to the ganglion cells and Muller ceils.
The b wave is an electropositive defiection receiving its major contribution from the ON center of bipolar ceils and / or the potassium potential difference across die membrane of Muller celis in the retinal circuitry. The time between the onset of a flash and the peak of the b wave is referred to as the “implicit time” and is measured in milliseconds.
Regardless of the origin of the b-wave, it reflects die photoreceptor light response post synaptically as well as the degree of light adaptation.
As stated previously, the human retina can be subdivided into two subsystems, the rod system for night vision. and the cone system for day vision, hence a duplex retina. The principal contributors to the flash ERG, photoreceptors, bipolars, and ganglion celis are shown schematically in Figure #5 below.
The anatomical and physiological complexity of the hurnan retina is reduced to five celi types in clinical electrodiagnostics. These include the photoreceptors (rod and cones), the bipolar celis, the Mueller ceils, the arnacrine ceils and the ganglion ceils. Each of these can be functionally isolated to evatuate the structural and functional integrity of the neural layer in which each of these celI type populations are found.
Figure # 5 Intraretinal celi architecture showing connections between cones,rods bipolar and ganglion celis
The cone isolated ERG (Photopic ERG) is not as sensitive to dim lights as is the rod —dominated ERG (Scotopic ERG). When a bright light is used to stimulate the retina, cone
photoreceptors respond very rapidly (typically within 30 ms) with an amplitude that is
rnuch smaller than a rod-isolated ERG because of the 20: 1 rod: cone ratio. Conversely, if the ERG is acquired under scotopic conditions, the resulting ERG is considerably larger in amplitude but siower to generate the ERG” a” and “b” waves.
Scotopic ERGs used as an objective index ofretinal response to blue flashes
In the present study, the scotopic ERG, was used as an objective measure of the global retinal response to flicker of dim-to-bright light.The bright-to-dirn blue flashes
selectively activated the rods because these contain the pigment rhodopsin that is very
sensitive to blue light. Blue sensitive cones have been activated by brighter light flashes.
It is particularly important to note here that the amplitude and timing ofthe scotopic ERG b-wave was used to show that the retina responded differently when the retina was stirnulated by dim-to-bright blue flashes in 1.0 log steps versus bright-to-dim blue flashes in 1 .0 log steps over a 4 log range. The differential retinal responses to flashes of identical luminance that were presented in reverse order helped confirm that the measured changes in ChBF at the fovea reflected the changes in the degree of metabolic activity in
topographically discrete segments of the retina. Specffically, when eccentrically distributed
rods were increasingly activated by 1.0 log luminance steps, more blood was progressively shunted towards this site of increased retinal activity as indexed by the step-wise decrease
in the ChBF at the foveal test site. This stealing of blood in favor of areas of greater metabolism is a comrnon phenomenon in exercise physiology that seems to occur also in
Figure # 6 Changes in the dark adapted ERG as a fiinction of flash luminance. dark-adapted human
Caption: An increase in the flash intensity causes the amplitude of the scotopic b-wave to increase and the implicit time ofthe b-wave to decrease. The oblique arrow shows the change in the b-wave imp]icit tirne with brighter flashes.
Changing the intensity of the flash reveals that the profile of the ERG changes in
two significant ways. First, the amplitude of the b-wave increases with flash intensity. Second, the implicit tirne of the b-wave decreases with an increase in flash intensity. It is also seen that the a-wavc becomes visible at relative flash intcnsity -2.0 and higher. This is because prior to that stimulus intensity the positive deflection of the b-wave overwhelmed the development of a measurable a-wave.
Tn contrast to the dark adapted responses, when the retina is sufficiently light adapted, the amplitude of the a-wave increases with flash intensity but demonstrates a constant irnplicit time. Furthennore, the amplitude of the photopic ERG is significantly
-I-o
-2.0
-3.0
-4.0
-5.0
Erztr.,n)mos nxc,&,dwt ±kacptmt.-ct.tr Ucreatnqttin-uIJ aC* 00IX OtOps
smaller than the one obtained with a bright flash scotopic ERG because of the large difference inthe number of rods versus cones in the human retina
Another important factor is the wavelength of the test flash used to elicit the ERG because the spectral sensitivity curves for a cone vs. rod mediated response differs due to their differential spectral sensitivity. The rod spectral sensitivity curve peaks in the blue green region of the visible spectrum at about 500 nrn, but the spectral sensitivity for the cones resuits from the sum of the three subpopulations of short, medium, and long wavelength sensitive cones. Therefore the peak sensitivity for the cone population falls in the green-yellow region ofthe spectrum at about 560 nm.
The rod system is considerably more sensitive to light than the cones. There is a 3-4 Log difference in light sensitivity favoring the rods over the cones. However, for wavelengths above 620 nrn, sensitivity for both photoreceptors becomes similar as shown in fig #7
Figure # 7 Log Spectral sensitivity of rod and cone photoreceptors
Rod and cone mediated activity can also be separated due to their differential response to light flashes presented across the frequency spectrum.The Critical Fusion Frequency (CFF) represents the highest flash frequency at which a subject just fails to perceive the temporal variation between the light flashes. In photopic conditions, the human eye can perceive fiicker up to about 60 -70 Hz. In scotopic conditions where the rods dominate the response, the CFF is reduced to flicker levels between 20 -25 Hz. (317)
scotopic (md) vision e e u e m o u t e u e / photopic(cono) vision V. V
1.2 ANATOMY 0f THE CHOROIU
Choroidal Anatorny and Physiology
The choroid is a vascularized and pigmented tissue that forms the posterior part of the uveal tract. It extends from the ora selTata anteriorly to the optic nerve posteriorly. The choroid is light to dark brown and it has a spongy consistency. The choroid lies just posterior to the retinal pigment epithelium and is separated from it by Bruch’s membrane. It is the onlyblood supply to the outer portion of the retina and is the sole vascular supply for central vision at the fovea.
The posterior choroid thickness is 0.22 mm and 0.10 to 0.15 anteriorly .The choroid is attached to the sciera by strands of connective tissue creating a potential space between them called suprachoroidal space.’°
The innermost choroidal layer is tightly adhered to the retinai pigment epithelium and the optic nerve. The choroidal circulation perfuses both the retinal pigment epithelium and the retina up to the outer aspect of the inner nuclear layer of the retina. Overail, the choroid roughly represents a vascular bed between the junction of the anterior and posterior cilliary arteries (Fig 11).. Furthermore, the density of the choriocapillaris plexus varies rougÏily with the density of photoreceptors. In the human eye, the choriocapillaris is most dense at the fovea and decreases in density towards the periphery. The variation of the choriocapillaris across several frmndus sites is illustrated in f ig 8 below.
Figure # 8 Retinal view of choriocapiHaris at different retinal sites.
aarterioles vvenu1es
The choroid is considered to be an expandable vascular plexus that supplies
nutrition for the rod and cone photoreceptors across ail parts of the retina, and also perftises
up to about 130 microns of the outer retina, particularly in the macular area Fig #12
(choriocapillaris inthe subfoveal portion ofthe retina)
ICriI);II)iIhlrt
.2
r,
Caption: Human choriocapillaris,posterior pole from retinal view.Montage from peripapillary to peripheral areas (29)
Anatornically, the outermost layer in contact with the sclera is called the lamina fusca and the suprachoroidal space. Underlying is the Haller’s layer characterized by a large number of arterial and venous plexuses. Sattler’s layei is the next one containing medium sized vessels and is located in the center ofthe choroidal complex. (Fig #9)
The choriocapillaris layer is characterized by large and fenestrated vessels of approximately 40-60 microns in diarneter in the sanie plane of Bruch’s membrane . This
vasculature offers a large enough diameter to allow several blood ceils to circulate sirnultaneously in any part of the choriocapillaris. The anatornical layout of the choroidal cornplex with its various vessels as seen froiii the scleral side is illustrated schematically in Figure #9 below.
Casts of the choriocapiliaris suggest that it functions as an end arteriolar network. In the posterior pole the choriocapillaris has a lobular pattern with a centrai precapiilary arteriole and a peripherat post capillary venule.t9
The anatomicai layout of the iobular sub-units in the choriocapillaris from the scierai side is iiiustrated schematicaily in Figure #lO beiow. The green outiine deiimits the approximate position of a single lobule in the choriocapiiiaris. The arterial biood inflow and venous outflow are rnarked by boid arrows.
Caption; Diagrammatic representation of the choriocapillaris and its functionai organization into roughty hexagonal subunits called lobules, outlined here in green
ink.t9
In the present study, non-invasive measurements of choroidal blood flow were made
from the retinal skie by a near infra red (NIR) probing beam that passed through the retina and penetrated the retinal pigment epithelium to sampie blood flow parameters of flow, volume and velocity. Specificalty, choroidal blood flow (ChBF) was measured in the
Figure # 10 Anatornical iayout of the iobular sub-units in the choriocapillaris
Bruch’s membrane
Choriocapillaris
Retinal pigment epithelium
choriocapillaris of the subfoveai choroid. A picture of a choriocapiliaris cast revealing its lobular appearance where biood flow measurements were made in the present study is shown in Fig 11 below. The NIR probing laser sarnpled the dispiacement of blood celis in this iobular complex.
Figure # 11 Retinal view of choriocapillaris
-* -I
i
44
t$At. -I
Caption: Anterior view ofchoriocapillaris in avascular foveal zone.29
The ophthalmic artery. a branch of the internai carotid artery, divides into a medial and lateral posterior ciliary artery. Before penetrating the sciera both arteries divide into one long posterior ciiiary artery and a variable number of short posterior ciliary arteries. The long posterior ciliary artery pierces the sciera sorne 4 mm distant to the optic nerve and
proceeds anteriorly through the suprachoroidal space to subdivide in the area known as the ora serrata into 3 to 5 branches that proceed posteriorly to stipply the ora at the equator.t12
The short posterior ciiiary arteries pierce the sciera and in the subchoroidal space branch into the choriocapiiiaris to suppiy blood flow for the posterior choroid. The insertion point ofthe short and long ciliary arteries at the posterior pole and their travel in the eye are illustrated schematically in Fig. 12 beiow (extracted from Woiffs Anatorny of the Eye and Orbit).4 Note that the short posterior ciliary arteries contribute to the choroid just iateral to the optic nerve head.
The long posterior ciliary arteries, on the other hand, move in the supra-choroidal space and perfuse the ciliary body, iris and the extraocuiar muscles. One of the four principal drainage vessels, the vortex veins (from latin: vena vorticosa), is shown on the right side of the diagram. Note also, that the choriocapillaris would be the vascuiar layer closest to the photoreceptors (not iliustrated) so that its circulation is vital for sustaining normal retinal metabolisrn.
The choroid is also supplied by the anterior ciliary artery accompanying each of the rectus muscles, that mainly supplies the major circle of the iris and provides branches to the ciliary muscle and choroid. Drainage of the choroid is principally via the vortex veins and secondarily by the ciliary body anterior veins.
Figure # 12. Vessels comprising the Vascular perfussion mechanism of the eye.
CIL. vrSSLs
Post-capillary venules form afferent veins that provide drainage around the inner sciera. In each ofthe quadrants, a main vortex vein is connected to these afferent veins via a wide ampulla. Each ofthe 4 vortex veins in the eye narrows at the end ofthis ampulla and descends through its respective quadrant of posterior sciera between the rectus muscles. Rareiy there may be a secondary vortex vein in the same quadrant. These veins are similar to other smali veins with a diameter of about 300 microns. The vortex veins drain biood into the superior and inferior orbital veins. The superior vortex veins pass through the orbital fissure to the cavernous sinus, while the inferior orbital vein goes through the inferior orbital fissure to the pterygoid plexus.
Choroidal innervation
The choroid receives extensive innervation from both sympathetic and parasympathetic systems. The sympathetic system bas a reguiatory mechanism through vaso-constriction to keep the blood flow constant, but the parasympathetic system has no effect on ChBF. The choroid is innervated by the short posterior ciiiary nerve .They enter the sciera 4 mm away from the optic nerve and as soon as they reach the suprachoroidal space they lose the myeiin and develops arborization. The long posterior ciliary nerves suppiy the innervation to the anterior choroid branching at the ora serrata level. The long posterior ciliary nerve joins the nasociliary nerve whereas the short posterior cilliary nerve goes through the ciliary ganglion.
Choroidal Histology
Microscopicaiiy the choroid consist of 4 iayers. From the outenuost these layers are the: suprachoroid,stroma,choriocapi ii an s and Bruch’ s membrane. The suprachoroid I ays between the pigmented sciera and the large vessel choroidai stroma. It is 30 microns thick
and bas no vessels. furthermore, it consists of tightly packed collagen fibers and nerve plexus.
The strornal layer consists of blood vesses and collagen fibers. Both arteries and veins are present with major number of veins compared to arterioles. The Haller layer is the rnost external part consisting of wide diameter arteries and veins, melanocytes and nerve fibers. These vessels are not fenestrated. The Sattler’s layer consists of smaller diameter and more intertwined vessels.
Figure # 13 Electron microscopy ofchoroidal and retinal vessel casting
Caption: The foveal area in antero-posterior view.rnicrophotograph shows perifoveal retinal capillaris and underlying choriocapillaris.the diameter of this area measures about 400
(9)
-The choriocapillaris lias a unique histological structure crucial to perforrn its
fiinctions. Capillaries in this layer are 40—60 microns in diameter with very thin walls. Vascular walls are provided with 600-800
À
(Angstroms, 1À1x10¹⁰m.) fenestrations facing the Bruch’s membrane with a covering diaphragrn to allow metabolites to difftise to the retina.This capillary system is characterized by a rapid transformation from arteriole to capillary. Several studiest9 have offered a view of the choroidal vasculature in 3
dimensions to show its unique pattern. li these models, choriocapillaris circulation is
explained by a lobular model where a central precapillary feeding arteriole empties into peripherally post capillaiy venules. This system with many venules provides a rapid blood
flow especially in the post equatorial cioroid. In the peripheral areas, the arterioles and venules seem to be more parallel to each other interconnecting in a ladder like pattern. The
innerrnost layer is Bruch’s membrane or the lamina vitrea. It is a collagenous multilayer of 2-4 microns width that gives support to the retinal pigment epithelium.
Choroidal blood flow physiology
As rnentioned in the section on choroidal anatomy, the choroid is supplied by the ciliary artery branches of the ophthalmic artery. Choroidal circulation is unique because of its lobular anatomy resulting in segmental filling ofthe choriocapillaris.
Thus blood moves into each lobule and out the relatively low resistance venules. Blood will not be directed to a neighboring lobule because of the relatively high resistance
compared to the draining venules and this determines a segmental pattern called ‘watershed zones’‘(9)
The choroidal blood flow is the greatest in the body and bas many times the flow necessary for the nutrition of the outer retina. As part of the incident light on the phortoreceptors is transformed in a small amount of heat, one hypothesis is that this excessive flow protects the retina from over heating when light strikes in acting as a heat dissipator. More recently, the idea of the choroid acting like a heat dissipator has been discounted (32)
This flow is in excess of the oxygen needs of the retinal pigment epithelium and outer retina. This is evident when measurernents are made in the artery and vein oxygen concentration difference in the choroidal circulation. Ibis difference cornes only to a few percentage points, providing a safety margin in case of flow reduction. However, Linsenmeier bas calculated the metabolic needs of the retina and the oxygen content of the choroidal blood and concluded that the retina uses and needs ail the oxygen provided by the choroidal blood fiow.t15 .Choroidai blood flow is under reguiation of the autonomic nervous system. Stimulation of sympathetic fibers decreases choroidal blood flow and syrnpathectorny increases it.
Physics ofblood flow
Biood flow is defmed as the total arnount of volume passing a point in vessel per unit tirne. In capiliaries the flow of cells and plasma may not be the same. Ceils flow faster in the central stream while plasma near the wall rnoves more slowly. This is referred to as larninar flow. Relative volume of ceils and plasma is iower in the capillaries than in larger vessels because celis concentration is higher in central stream in a process named blood skimming.31)
Figure # 14 Diagram of laminar flow
Pressure (i.e. forcefunit area)
Skie View of
Parabolic Flow Profile End View
Caption: In larninar flow, fluid speed in the periphery is siower due to friction
Cylindrical (Volume) FIow Concentric Fluid
(e.g. blood vessel) Layers
2.0 PROJECT DESCRIPTION
In the present study, the principal objective was to show that the hurnan choroid vas capable of regulating blood flow during changes in retinal metabolism induced by light
stimulation of the retina. Blue flicker stimuli were used to specifically activate rod
photoreceptors that were topographically isolated from the sub-foveal measurement site of choroidal blood flow. It was clear for tis that the appropriate bltie light stimulation of the rods would generate a significant change in metabolic demand because of the high number
ofrods in the hurnan retina, and the high ratio between rods to cones (20:1).
The underlying hypothesis was that choroidal blood flow would be directed to retinal areas with the greatest metabolic activity. By stirnulating eccentrically located rods that are particularly sensitive to blue light because of their rhodopsin content, choroidal blood flow would be directed eccentrically if the hypothesis was correct. In fact,
measurements of choroidal blood flow at the fovea revealed a progressive decrease in the subfoveal choroid during increased stimulation of the eccentrically located rod population. This provided direct evidence that the choroid was capable ofregulating blood flow.
For rnany years there was a general agreement that the human choroid was incapable of regulating its blood flow7 Ah studies perfonued in the past were done using invasive techniques such as micro-spheres casting and rnany of them were not suitable for in-vivo examination. One of the studies was particularly interesting. The authors used lights
of different wavelengths to stimulate the retina of the newborn piglets having retinopathy of prematurity30
By using the microspheres tecirnique thoy found a significant decrease in the choroidal blood flow when the retina was exposed to blue light whereas the retinal blood ftow increased under the same test conditions.
Laser Doppler measurernent of choroidal blood flow
For obvious reasons, we used a system based on an invisible laser probe to detect the moving red cells in the choriocapillaris vasculature. These blood cells reflect the
probing beam differently according to the number of moving celis and their velocity. The multiple reflections are detected by a photo amplifier system and the Doppler Shift Power Spectrum produced by the moving particles is produced and analyzed. The resulting data are outputs in relative parameters with respect to blood velocity, volume and flow.
2.1 DESCRIPTION 0F 111E INSTRUMENT TO STIMULATE 111E RETINA AND
MEASURE CHOROIDAL BLOOD FLOW. Materials and Methods
For the purpose of the present study we needed to measure blood flow with a non invasive reproducible, accurate and sensitive method to show the changes in the flow, volume, and velocity parameters of blood flow. This method is based on the principle
described by the Austrian physicist Christian Doppler in 1842. The Doppler phenomenon
describes the frequency shift that a wave undergoes when emitted from an object which is moving towards or away from the observer.
A diode laser module producing a single wavelength of light that is used to detect changes in the frequency of moving particles such as the red blood ceils in the choriocapillaris. For the human eye, the Doppler effect can be considered as the change in
frequency of a probing laser caused by the velocity of a moving blood cell in a target tissue. Thus, a probing laser with a frequency of)1 incident on a red blood cell (RBC) moving at a different velocity V ,and an incident laser at an angle of ai will be backscattered at an angle
ofar,determines a change in frequency that can be visualized in the following equation:
= n. V.(cos a- cos OEr
)
Ii
In this formula AF = the Doppler shift.
? is the wavelength ofthe probing laser light within the blood
2i
Figure # 15 Doppler parameters
V
Caption:The incident laser beam 2j is reflected in a moving particle
with an angle Œi and reflected in c with a different Doppler shifted
(From Riva C. et.al.)
When the laser beam strikes the RBC’s moving in multiple directions and with different velocities, the backscattered light from thepoint where the laser is incident on the target tissue represents the summation of multiple waves with various Doppler shifts. The
resulting plot of the different shifts versus the Doppler shifted frequency results in the so
called Doppler Shift Power Spectrum (DSPS) that defmes the frequency proportional to the REC movement within a vesse18. The particle velocity is directly proportional to this
difference frequency and can be measured asolutely from the scattering geometry and the
laser wavelength23’24’20
f
Figure # 16 Doppler shift power spectrum.
:
k
20 10 L 1 J T 1 0 100 200 300 400 500 900 000 f(Hz)Caption: The backscattered light contain ing different frequencies acording to the different velocities of the moving particles are shown.dotted une represents the noise threshold level to be filtered.
The horizontal dashed une in this figure represents the Tnoise’ in the measurernent system that is omitted during analysis. Typically, elements at the low frequencies that correspond to tissue movernents are discarded from analysis. To derive the various blood flow
parameters, the area under the DSPS is integrated and processed to yield the following
variables:
a) Velocity (Vel): Is measured in kilohertz (Khz) and is related to the difference ofthe shifted wavelength. This parameter is proportional to the mean velocity of the RBC’s within the perfused tissue targeted by the laser.
b) Volume (Vol): represents the number of RBC’s within the volume of tissue illurninated by the probing laser
c) F low:, is the resuit of Vol x Vel x constant.
Consequently, the blood flow and volume measured by this near infrared laser Doppler flowrneter system is an extrapolation ofthe RBC’s number and velocity.
It is important to note that the backscattered light also contains light scattered by
non-moving elements such as the vessel wall or other supporting structures in target tissues.
The frequencies of light backscattered by moving tissue (RBCs) and non-moving tissue ai-e mixed in the process called heterodyning. The intensity of the heterodyned backscattered light undergoes a Fast Fourier Transforrn (FFT) (19)
to yield the Doppler shift power spectrum from which energy related to the heartbeat can be extracted. In this way, light shifted by non-moving tissue is separated from that scattered by moving blood ceils.
When this type of analysis is perforrned in real tirne, laser Doppler Flowmetry yields a continuous measurement of changes in the above-mentioned blood flow parameters at the measurement site. In the present case, the area of interest was the choroidal blood flow under the foveal area of the retina. This area was selected because it is devoid of retinal blood vessels and thus free from any contaminants related to retinal blood flow.
The laser Doppler flowmeter used in the present study was designed from a Kowa Fundus Camera so as to obtain a Doppler shifted signal while sirnultaneously delivering flicker stimulation to the retina while measuring blood flow subfoveally. An infrared CCD camera (Pulnix MRO7, USA) was attached to the system to provide a retinal image for each subject to ensure continuous foveal fixation during experimentation.
A specialized flicker stimulation device was placed in the fundus camera light pathway using a 50/50 beamsplitter prism in order to get a coaxial illumination of the fundus over a 30 degrce area of the retina.
Figure # 17 Schematic diagram of the laser Doppler flowmeter with the flicker generator.
Sensorsystem forDoppler
sNfted laser light
Caption: Fundus camera optic path including the probing laser and the flicker stimulation device.An infrared image of the fundus is detected by the CCD camera and visualized in the monitor.Data is detected by de Doppler head sensor and computer processed.
The probing laser beam was set to an intensity that produced a radiation of approximately 96 rnicrowatts at the cornea with a circular area on the retina approximately 150 microns in diameter. A fiber optics sensor placed on the focal plane of the camera trapped the backscattered light and directed it to a photo detector-amplifier system. The amplifier output was then acquired and digitized in a Next computer using an FFT chip and dedicated software. A FF1’ analysis was performed in pseudo-real-time (20 measurements
Test
eye
MUMIOR
780
Flicker
, Blue FlashLEDs bulb
svstein
ler— —
code
Blue flicker
JLJL
RATA AC1ILA
34
output was then acquired and digitized in a Next computer using an FF1 chip and
dedicated software. A FFT analysis was performed in pseudo-real-time (20 measurements
per second) while simultaneously recording the heart rate through an earlobe sensor so that the flux from RBC’s could be correlated with the systolic- and diastolic phases of each cardiac cycle.
To be able to use various colors of light stimulation in future studies purposes, a four colour
(blue, red, green and white) Light Emitting Diode (LED) system was developed and
rnounted in a rotary carrousel in une with one of the common optical pathways of the
fundus camera. However, only the Nue flicker channel was used in the present study. The
blue LED array consisted of5 equally spaced LEDs with peak wavelength at 473 nm and a
22 mii bandwidth at haif peak. The luminance at the comeal plane of the blue flicker light
source was 375cd/m2 (Minolta CS-100 Chromameter; Milton Keynes UK). By placing
neutral density filters (Kodak Wratten, USA)jtlst after the blue LED’s, retinal stimulation
was moduÏated over a 4.0 log range in 1.0 log steps.
OCUE LED Mxirrn,ns Lomiornsoe
10000 —. —-—— — 0500 0000 __ — - _. --0500 —————-— ---— ——---0000 — — ——.— —--—-...— —-.-- -—— — — 7500 ——--- —--—-—.—- -— — — 7000 --——-——- ———----4-1-—--——— ---— 6500 6006 ---- ---.- —-—---— —---—---— 5500 -.— . .— - - -5000 -——-j— . - - -— --- -4500 -4000 ———-———-— — ————— —— 3500 ——--—- —- - —-— 3000 — 25c-0 -- .- -—— — 2000 1500 — -————— -— 1000 500 —— 625 650 075 700 400 425 450 475 500 525 550 575 600 WoIonglI (n,,s
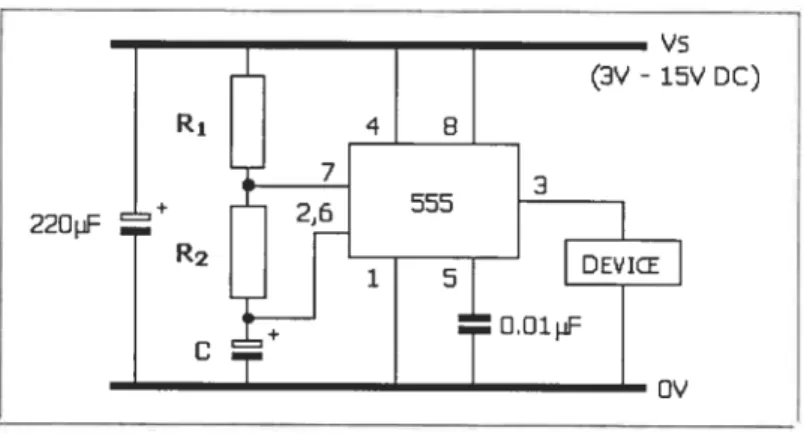
The flicker stimulator was controlled by a specially built electronic circuit (sec Annexe No.1). This circuit allowed delivery ofblue flashes at fixed frequencies of
1-2-3-4-5-6-7-8-9-10-11-12-14-16-18-20-22-24-26-32-44-64 Hz that were modulated on a 50% on/off
duty cycle.
Detection ofbackscattered light
The detection of backscattered laser light was detected by the fiber optics sensor placed atop the aerial image of a laser-illurninated spot on the retina. The sensitivity of this light detection system was influenced by two factors:
a) The intensity of the probing Laser light, and
b) The sensitivity ofthe light amplifier Iinked with the fiber optics probe.
For the purpose ofthis experiment we used a near infrared (NIR) 783 nm laser light. The maximum permissible level of retinal irradiation for a given exposure time increases
exponentially with wavelength. Therefore a probing beam in the NIR portion of the
spectrum will allow a long safe exposure according to ANSI standards (1)
without incurring photic damage. For the case of the 783 nm laser probe, a single point of the retina could be
continuously irradiated for as long as three hours without compromising its safety. The
flicker stimulation and LDF recordings in the present study feu well within the established ANSI standards of safety.
The sensitivity of the detector is crucial to maxirnize the signal-to-noise ratio of the measurernents and stili remain within safety levels for die subject with respect to photic damage. Typically an avalanche photodiode is used to detect the backscattered light because of its spectral sensitivity characteristics and it’s quantum efficiency for NIR light.
Monitoring neural reactivity of the retina to blue flicker
A clinical signal averaging system (ESPION, DiagnosysLitt1eton,MA) was used to quantify the retinal response to flicker at each of the luminance steps used to change retinal rnetabolism and hopeftilly evoke measurable changes in die choroidal blood flow. For the purpose of this study, the amplitude and implicit tirne of the b-wave was quantified and colTelated with flash intensity. The ERG recordings were carried out at the beginning and at die end of each flicker series to determine whether the retinal response differed when stirnulated by flicker of the same intensity, but presented in a dim-to-bright, vs. bright-to dim order. Changes in neural reactivity were then correlated with measurements of sub foveal choroidal blood flow.
3.0 N’laterials and methods
This section is described in the article’s bodyBlue fticker modifies the subfoveal choroidal blood ftow
in the human eye
By
Marcelo A. Wajszilber
École d’optométrie
Université de Montréal
Montréal, Québec, Canada
ABSTRACT
The objective of the present study was to reveal an interaction between choroidal blood
flow (ChBf) arid light-induced photoreceptor activity, a physiological coupling that is
already demonstrated for retinal blood flow, but rejected for the ChBF. Ten healthy
aduits volunteered for this study. A real-time recording near infrared laser Doppler
flowmeter was used to quantify the subfoveal ChBF while the luminance of blue flicker
between 1 Hz and 64Hz was first increased, then decreased by 4.0 log units in 1.0 log unit
steps between 0.0375 cd/m2 and 375 cd/m2. In separate testing, flash electroretinograms
(ERGs) provided electrophysiological indices of the relative response of shortwave cones
and rods to blue light stimulation. Group-averaged, normalized ChBF measurements
revealed that it was modulated by 9% by flicker ftequency. Increasing the blue flicker
luminance from low-to-high attenuated the subfoveal choroidal flow, volume (ChBVo1),
and velocity (ChBVe1) by —32%, 30%, and 5% respectively. Decreasing the
luminance from high-to-low over the same range had no effect on the subfoveal choroidal
hemodynamics. The markedly different effects of reversed directions of change in blue
flicker luminance on the subfoveal ChEF were linked to transitions between rod
dominated and shortwave cone-dominated retinal responses. Collectively, these findings
indicate that blue light-induced photoreceptor response is associated with a differential
distribution of the ChEF across the ocular fundus according to the degree and type of
retinal photoreceptor stimulated.
Keywords: blue-flash electroretinogram, choroidal blood flow, choroidal
INTRODUCTION
Experimental data pointing to the existence of vascular autoregulation (AR) in the human
choroid bas been reported only within the last 5 years or so. The principal purpose of
choroidal AR is to keep choroidal blood flow (ChBF) constant throughout changes in the
ocular perfusion pressure (OPP) such as occurs during exercise.19’28 Vascular AR also
adjusts blood flow to meet the changing metabolic demands of retinal neurons and to
prevent rupture of fine capillary networks where the exchange of metabolites occurs.
The relatively recent adaptation of near inftared (NIR) laser Doppler flowmetry (LDF)26
to the human eye made possible several studies into choroidal hemodynamics including
the discovery of blood flow regulation in the choroidal vasculature.’9’28 Unfortunately,
the fundamental interaction between light-induced changes in neuro-retinal activity and
ChBF has remained largely unexplored.
In lower order animal species, photic stimulation of the retina increases the ChBF8
through the Edinger Wesphal Nucleus reflex. In sharp contrast, diffuse flash stimulation
of the human retina has been linked to changes in blood flow in the retinal vasculature
and optic nerve head7”°”3’22’24’27 but flot the choroid.’3”8 To our knowledge, only two
other research groups bave examined the interaction between light and ChBF in fl•l38
Longo et al.‘ were the first to investigate the influence of retinal light levels on the
ChBF. Specifically, they found that a 20 minute transition from cone to rod-dominated
vision decreased the subfoveal ChBF by -1 5%. Subsequent exposure of dark-adapted
much as the transition from light to dark altered the ChBF, it was surprising that
stimulating the central 400 of the retina for 10 minutes with a bright green light (peak
spectral emission at 524 nm, and a 60 nm bandwidth at 50% peak transmission) failed to
elicit significant changes in the ChBF. However, these conflicting observations could be reconciled if different mechanisms controlled blood flow in the choroid during light-dark
exposure of the retina, and when the retina was stimulated by light in photopic
conditions.
In a more recent study Garhofer et al.13reported that stimulation ofthe central 30° ofthe
retina with 8Hz flickering light from a Grass PS2 stroboscope covered with a 550nm low
pass filter failed to change the subfoveal ChEF, but did increase blood flow in the optic
nerve head by 30%. From these data, Garhofer et al.13 concluded that a light-induced
increase in retinal activity had no effect on the ChEF, and that the ChBF was independent
of changes in retinal metabolism. However, they acknowledged that the 550 nm lowpass
flicker may have preferentially activated the dense cone population at the macula and that
thc resulting subfoveal choroidal hemodynamics may have differed from ChBF reactions
in the greater retinal periphery.
These limited and inconclusive findings on the correlation between light-induced neural
activity in the retina and blood flow changes in the choroid prompted us to further
investigate this issue. Therefore, instead of using flashes with a broad spectral profile that
unavoidably would differentially stimulate ah macular cones to different degrees in the
luminance range to selectively stimulate rods and shortwave cones. By presenting blue
flicker in a low-to-high luminance order, the goal was to elicit responses principally from
the rhodopsin-bearing rods, then the rods and shortwave blue cones, and lastly the
shortwave cones with the brightest flicker.
We rationalized that narrowband blue flash (473 nm) stimulation of the retina at very low
luminance was more likely to induce changes at the subfoveal measurement site because
of selective activation of rods populating the greater retinal periphery instead of exciting
the cones and rods located doser to the fovea by high luminance flickcr. Because the rod
to cone ratio in the human retina is about 20:l, we postulated that strong activation of
rods by dim blue flashes would change the distribution of ChBF across the retina and this
would be reflected by changes in the subfoveal ChBF. It is likely that previous studies
could flot find ChBF changes at the fovea because they used either broadband spectral
stimuli, or bright narrowband light that stimulated ah cone types in the macula and these
determined the metabolic need for ChBF in the foveo-macular zone.
In order to determine which type of retinal photoreceptor and the degree to which it was
activated by the blue flash luminance sequences, retinal responses were compared using
the amplitude and temporal features of the flash-evoked retinal potential, the
MATERIALS and METHODS
Subiects and procedures
Ten healthy aduit volunteers, 7 women and 3 men. with an average age of 25.4 years (SD: + 9.4) participated in this study. Ail participants were experienced research subjects
with excellent fixation abiiity. The subjects range of refractive errors was +1 D to -5D equivalent sphere, the intraocuiar pressure (TOP) was between 10 and 20 mmHg, and the systemic blood pressure (BP) was within normal limits. Ail testing protocois complied with the deciaration of Helsinki, and ethical guidelines for humans in research at the University of Montreal. A signed informed consent was obtained from each participant after the nature and purpose ofthe experiment had been explained to each voiunteer.
Measurement of choroidal blood flow
Prior to testing, each subject was familiarized with the experimental protocois. The pupii
ofthe test eye was diiated with 2 drops ofMYDRIACYL (1% tropicamide), and one drop of MYDFRU’1 (2.5% phenylephrine HC1). Choroidal hemodynamics were quantified with
a non-invasive continuously recording near infta-red (NIR) 7$4nm Laser Doppler
f lowmeter (LDF; Oculix, $witzerland). Ail subjects adapted to the normal laboratory
lighting for at least 20 minutes prior to any measurements of ocular blood flow. Because the design and operation of the dynamic LDF used to measure the subfoveal ChBF have been reported previously,26 only a summary of its use is presented here. The LDF consisted of a fiindus camera modified to deliver the narrow laser beam into the foveal avascular zone. The laser power at the comea was 90-95 j.iW which complied with the
ANSI 136.1 standards for laser safety.’ The laser power was kept constant throughout the entire experiment tbrough a feedback power supply. The laser light back-scattered by static tissue and moving blood celis in the subfoveal choriocapillaris was focused in the retinal image plane ofthe fundus camera, and a 90iM diameter fiber optics sensor guided the laser light to an Avalanche photodiode. The photocurrent was sampled at 20 kHz and then processed by a dedicated program on a NeXT computer to provide real-time (about 22 points per second) measurements of blood flow parameters based on the Bonner and Nossal theory.3 The hemodynamic parameters included the choroidal blood flow (ChBf), velocity (ChBVe1) and volume (ChBVo1). The measured blood flow represents the product of the blood celi velocity and the concentration of blood ceils in the sampled tissue volume. A blood ftow sensor clipped to the ear provided measurements of the heart rate throughout the experiment. Ail LDF measurements were carried out in moderately reduced room lighting to minimize reflections of visible light into the light sensor for the back-scattered light. As a further precaution to eliminate stray light from contaminating blood flow measurements, a 50 mm dichroic filter (“cold” filter) sealed the aperture leading to the small chamber containing the fiber optics sensor; thus only IR from the test eye was analyzed.
flicker stimuli:
A cluster of 5 high intensity blue light emitting diodes (LEDs) with a peak spectral
emission at 473 nm. and a 22 nm bandwidth at haif peak height was used as the flicker
flicker in 1.0 10g unit steps, with neutral density filters, from 0.0375 cdlm2 to 375 cd/m2. In the follow-up experiment, the order of step changes in flicker luminance was reversed. The blue flicker frequency and stimulus duration were controlled by dedicated electronics. Light from both the LEDs and the NIR laser was projected onto the retina by the background illumination optics of the fundus camera. An auxiliary optical system directed the probing laser light into the center of the flicker field that fihled the entire field of view of the subject. Maxwellian optics in the fundus camera assured a bright uniform illumination of the retina.
Effect of increased flicker luminance on the ChBF
This phase of the study involved flicker stimulation of the retina at frequencies between 1Hz and 64 Hz in 24 steps. The duration of each flicker frequency was 10 seconds with no delay between frequencies. A complete ChBF stimulus-response profile involved continuous measurement of the subfoveal ChBF during 5 consecutive flicker frequency series as described above and presented over a 4.0 log cd/m2 luminance range. The luminance ofthe aerial image ofthe LED matrix formed by the fundus camera optics was 375 cd/m (Minolta CS-lOO Chromameter; Milton Keynes, UK).
In this test phase, flicker luminance started at the lowest level, 0.03 75 cdlm2. and was increased to the brightest one, 375 cd/m2, in 1.0 log unit steps. The lowest flicker luminance, 4.0 log unit steps below 375 cd/m2 was achieved by placing 4.0 ND Kodak Wratten in front of the LED light source. At the end of each flicker series, normal room lighting was restored for one minute to insure that the retina remained light adapted.
During this interval subjects maintained fixation of the probing laser, ChBF recordings were stored to computer memory, and the ND filters were changed to increase the flicker luminance by 1.0 iog unit step. As such, each test eye underwent 20 minutes of flicker stimulation throughout this phase of the experiment.
Since the LDF system measured only relative changes in choroidal hemodynamics, the ChBF for ail test conditions was recorded in one continuous session to be abie to quantif’ absolute changes in the ChBF as elicited by changes in flicker frequency and luminance.
Effect of decreased flicker luminance on the ChBF
Six of the original 10 subjects participated in this follow-up study where the order of flicker frequencies was maintained but the order of step changes in luminance was reversed, such that the first flicker frequency series was presented at a luminance of 375 cd/m2 and the luminance of each subsequent flicker series was decreased by a 1.0 iog unit step down to 0.0375 cd/m2. It was hypothesized that any cumulative effect on the retina caused by diffuse blue flicker wouid be changed radicaily by a reversai in the step changes in flicker luminance. Conversely, if retinai activity and ChBF were unaffected by photic stimulation per se, then a reversai of the step changes in flicker iuminance would also have no effect on retinal activity or choroidal perfusion and consequently the ChBF response profile wouid be the same whether the flicker luminance was increased or decreased.
Electroretinographic index of neuroretinal responses to light
Blue flash (peak wavelength 473nm) ERGs were recorded to differentiate the contribution of rods and shortwave cones to changes in the ChBF during blue flicker stimulation of the retina at different luminance levels. The ERGs were recorded with an Espion (Diagnosys LLC, Littieton, MA, USA) evoked potential system respecting ISCEV guidelines for recording clinical ERGs.21 Each subject was positioned in the LDF system for ERG recordings. b record the ERG, a Dli fiber electrode6 placed in the inferior sulcus of the test eye served as the active electrode, while a second Dli electrode placed in the inferior sulcus of the contralateral light-occluded eye served as the reference electrode. That eye was occluded by a light-tight black patch. An Ag-AgC1 electrode on the inner wrist formed the electrical ground. All ERGs were recorded in response to 1Hz diffuse blue flashes delivered tbrough the background channel of the fundus camera as during LDF recordings. Each retinal response to a flash was gated through a 0.15-100 Hz band-pass filter and amplified X 10,000. The average of 10, 200 ms epochs synchronized to the onset of each flash comprised the ERG signal. This ERG was measured before and afier each blue flicker series to quantify any changes in retinal responsiveness induced by the flicker. for the needs of this study, the ERG response was quantified by measuring the amplitude of the b-wave. Changes in rod/cone contributions to the ERG b-wave were derived from light-induced changes in the overall ERG waveform, including changes in the amplitude and temporal attributes of the principal ERG components with changes in blue flash intensity.
The specific response parameter sought and the various methods used to extract the information from the large database are listed below:
A) Quantfying any changes in choroidal hemodynamics caused by flicker between 1Hz and 64Hz and step increments in fticker luminance followed by flicker with step decrements infiicker luminance. (sec Fig. 1 and 2)
The ChBF response for a particular flicker frequency was averaged over the corresponding 10 seconds flicker interval using an electronic averaging cursor in the LDF program. This process simultaneously yielded the time-averaged value for the ChBF, ChBVol, and ChBVe1 that were then normaiized so that blood flow responses across subjects could be compared on a common scale. The ChBF was normalized by assigning a 100% value to the 10 seconds of ChBF recorded in response to the first flicker stimulus (i.e. 1Hz) and luminance level, and expressing subsequent ChBF responses to incremental changes in flicker frequency as a percentage of the 100% reference value across ail flicker luminance levels. The same data reduction was applied to the ChBVol and ChBVe1 data for each subject for flicker of increasing and decreasing luminance. Any separation of consecutive flicker ftequency response profiles would be due to step changes in flicker luminance.
B) QuantJJ’ing the effects of step increments inflicker luminance on the ChBF (sec Fig. 3)
While the group averaging procedure was particularly effective for revealing the effect of flicker luminance on the frequency driven response profile, the interaction between flicker frequency per se and the ChBF was much less evident. In fact, the first analysis
somewhat obfuscated the frequency effects because the ChBF peakcd in narrow but different frequency ranges across subjects. Consequently, a second analysis of raw data was carried out and presented the modulation amplitude for ChBF as a function of the peak driving ftequency.
C) Quantfying the interaction between the choroidal Velocity, Volume and Flow when flicker luminance was increased and then decreased (see fig. 4)
In order to beller quantif’ the interactions between the Velocity, Volume and Flow, all individual normalized responses for Volume and Velocity (n 24 each) for each flicker luminance level (n= 5) were plotted against the corresponding normalized change in flow for flicker of increasing and decreasing luminance. Subsequently, curve-fitting functions helped define interactions between these hemodynamic parameters.
D) Quantfying changes in retinal sensitivily during repeated exposure to blue flashes of increasing and decreasing luminance (sec fig. 5)
The ERG b-wave peak time and amplitude were measured with clectronic cursors. The most revealing and compelling information about the retinal sensitivity status came from a side-by-side comparison of the ERG profiles taken before and afier each flicker series on the same scale and over flash luminance series that a) increased luminance and b) decreased luminance.